

In short
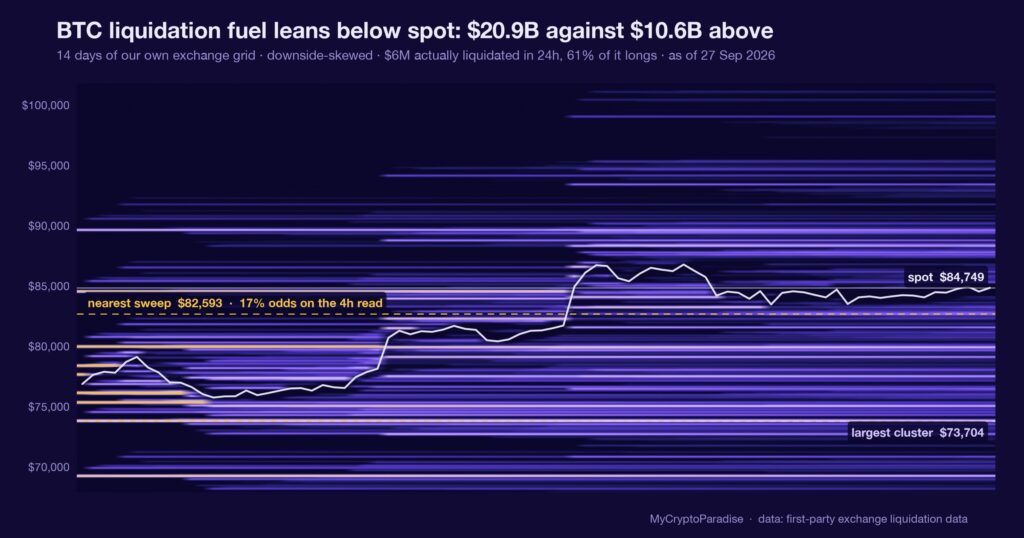
A liquidation heatmap plots where leveraged positions carry their forced-exit prices, so a bright band marks a pocket of stops that a move can chain through. On 27 September 2026, our MCP Insights liquidation heatmap flagged three high-leverage pockets overhead, at $83,000, $84,000 and $85,600, with $83,000 the nearest. We read this as a constructive lean, not a target: clustered liquidity above tends to act as a magnet, and we are explicitly not calling a level. The reading is a model estimate, flagged as such by our own series, so we treat it as a lean worth one line of risk. Base rates for liquidation-pocket regimes are not wired into our data yet, so we claim no historical frequency. We have not graded this read; it publishes today. This piece shows you how to read a liquidation heatmap yourself, pocket by pocket.
Key facts
- BTC spot at the reading
- $84,749
- Estimated BTC liquidation fuel above spot
- $10.57B
- Estimated BTC liquidation fuel below spot
- $20.88B
- Fuel balance
- downside-skewed, -33 points toward the heavier side
- What would prove this read wrong
- The liquidation heatmap rebuilding its heaviest pocket below spot rather than overhead, or a daily close above $85,600 that consumes the entire overhead ladder, either of which removes the magnet the read depends on.
- Reading taken
- 27 September 2026
- Source
- Our MCP Insights tools, from first-party exchange data
A heatmap marks where stops live
A liquidation heatmap does not forecast price; it maps the levels at which leveraged longs and shorts would be force-closed, then shades each level by how much size is resting there. Brighter bands mean more leverage waiting, in one place, to be liquidated.
That geometry matters because forced liquidations are not decisions. When price touches a dense band, the exchange closes those positions at market, and that market selling or buying pushes price further the same way, which can reach and trip the next band above or below.
So liquidity behaves like a magnet more than a wall. It does not stop a move; it feeds one that arrives. A heatmap is a map of fuel, and fuel explains acceleration, never ignition.
Three pockets stacked in a tight band
On 27 September 2026, our MCP Insights liquidation heatmap, read across a 24-hour window, flagged three high-leverage pockets clustered overhead: $83,000, $84,000 and $85,600. The nearest sits at $83,000, and the whole ladder spans a tight $2,600.
Three bands inside $2,600 is a concentration, not a scatter. Leverage has piled into a narrow overhead range, so a move that reaches the first pocket has two more directly above it to chain through, each one closer than the last.
We flag this as a model estimate, because our own series marks the reading estimated. An estimate is a lean, not a ledger entry, and a figure with no verified feed behind it is a hypothesis wearing a decimal point.
The magnet is a lean, not a level
The obvious misread is to treat $83,000 as a target. It is not one. A pocket of liquidity raises the odds that price, once travelling toward it, keeps travelling; it does not schedule the journey or promise the arrival.
This is one input, and a modest one. It sits alongside funding, open interest and spot absorption, and on its own a heatmap is the quietest of the four: it shows you where the fuel is stacked, never who decides to light it.
A gauge that shows the fuel and admits it cannot show the spark is more useful than one that always claims to time the fire. Honesty about what a single map cannot do is the whole of its edge.
What is different here
The ParadiseTeam does not read a heatmap as a price prediction. We treat each bright band as conditional fuel, weight it by whether our funding, open-interest and absorption reads agree, and attach an invalidation before we act. The map sizes a bias; it never becomes one on its own.
Who hunts a cluster like this
Tight overhead clusters attract attention precisely because they are efficient. A push into $83,000 that begins to close shorts can, mechanically, carry into $84,000 and $85,600, and larger players know the map as well as anyone reading this.
That does not make the move a conspiracy. It makes it an incentive: liquidity above is where stopped-out shorts become forced buyers, and forced buyers are the cheapest fuel a rally can find. The map simply shows where that fuel waits.
The lean here is constructive while price sits below the ladder: the pull points up. It is a lean worth exactly one line of risk, not a reason to chase price into the pocket it is drawn toward.
Nothing is graded yet, and that is the point
This read publishes today, so there is no outcome to grade. We will mark it in a future ledger the same way we mark the misses: against what price actually did, not against how confident the call sounded when we wrote it.
Base rates for liquidation-pocket regimes are not wired into our data yet, so we claim no historical frequency here. The lean rests on the mechanics of forced flow and on a single live model-estimate reading, and on nothing borrowed.
A read you cannot yet grade is not a weak read; it is an honest one. The weakness would be pretending today the certainty that only next week can earn.
Reading the liquidation heatmap yourself, step by step
- Open our crypto liquidation heatmap and find current spot, so you know which pockets sit above price and which sit below.
- Note the brightest bands, not every band: brightness is size, and size is what makes a pocket worth watching.
- Measure the spread between the nearest clusters; a tight ladder chains more easily than pockets spaced far apart.
- Check whether funding, open interest and absorption agree with the side the liquidity sits on before you weight it.
- Write the level whose break would move the heaviest liquidity to the other side; that is your invalidation.
The step most people skip is the last one: they read where the fuel sits and never write down the price that would prove the read wrong.
Every number above is checkable against the live data. Start with the crypto liquidation heatmap, then cross-read the MCP Insights hub and the Crypto Fear and Greed Index.
Act and invalidate
| Scenario | What confirms it | What kills it |
|---|---|---|
| Price drawn up into the pockets | Shorts closing, $83,000 tested | Heatmap rebuilds heavy below spot |
| Cluster holds as resistance | Rejection wick, funding cooling | Daily close above $85,600 |
| Read stays a lean, no trade | Tools disagree with each other | One clean confluence appears |
Posture: Constructive while price sits below the ladder and the pull points up, but sized as a lean, not a chase. No entry belongs inside the pockets themselves.
Frequently asked questions
What is a liquidation heatmap?
It is a map of the prices where leveraged positions would be force-closed, shaded by how much size sits at each level. Brighter bands hold more leverage. It shows where a move would find fuel, not where a move begins.
Does liquidity above mean price goes up?
Not on its own. Dense liquidity acts as a magnet: once price travels toward it, forced closes can carry the move further. But the map never promises the move starts, only that it would accelerate if it did.
Why call this reading a model estimate?
Because our own liquidation series flags it as estimated rather than fully verified. We quote it as a lean, not a calibrated probability, and we would rather label the uncertainty than dress an estimate up as a settled fact.
What invalidates the constructive lean here?
The heatmap rebuilding its heaviest liquidity below spot instead of above, or a daily close above $85,600 that consumes the whole overhead ladder. Either one removes the magnet the read depends on, and the lean should be dropped.
Is a heatmap enough to trade on?
No. It is one input among funding, open interest and spot absorption, and the weakest of them alone. It sizes a bias you already hold from other reads; it should never be the sole reason for a position.
Crypto trading involves substantial risk and is not suitable for everyone. Nothing here is financial advice; it is education only. Never risk more than you can afford to lose.
The private Extras feed, where the liquidation heatmap, its overhead pockets and the invalidation level update with every intraday redraw, is part of PRO Paradiser, the intelligence layer behind the ParadiseFamilyVIP strategies.














Join the discussion 27
but what about the historical accuracy? how often do these "magnets" actually get hit within, say, a 48-hour window.
I'm sorry, but this idea of "liquidation magnets" as targets for small accounts... it just feels like its encouraging reckless leverage that most of us just cant afford.
I'm sorry, but this part about "liquidation magnets" as targets... it feels like it encourages people to take risks, no? Like it's a game to play with leverage, and that just makes me worried, I think. !!
All this talk about "liquidation magnets" makes me so nervous... it feels like it just encourages more of the risky leveraged trading that hurts so many people. 😔
Hannah, I see your point, but these zones are less about encouragement and more about identifying areas of structural weakness. We design for the worst case, not hoping for it.
I understand you're looking at "weakness," Ahmed, but when people see these "magnets," it becomes a self-fulfilling prophecy. It just draws more high-risk bets… I've seen it firsthand. 😔
Hannah, it's a valid debit to consider. Trading into those "magnets" as targets, without a clearly defined stop loss, is definitely an unbalanced entry. 😅
Liquidation magnets" is certainly precise for where the margin calls will hit. But identifying *where* leverage collapses is not an invitation to add more. Borrowed money eventually costs everyone.
The "liquidation magnets" are indeed useful to identify crowded positioning. The danger, as Hannah points out, is in framing it as a target rather than a sign of sentiment asymmetry to fade.
isabella, you say identifying crowded positioning is useful, but focusing on 'liquidation magnets' as a tool for that is a dangerous distraction for new people. they will just see targets to chase.
This thing... it’s a tool. Don't go leaning on it. Saw a good man ruin his life doing that... chasing ghosts.
Yeah this reminds me of how I always pick the longest line at the grocery... a real magnet for bad luck. 🤔 Hannah, I see what you mean about the risk too.
So, the assumption is the highest-leverage cluster is always the strongest magnet? What's the statistical backing for that specific pull-strength correlation?
Magnets always there... watched a guy lose a year on one. Be careful.
reading the stack is key, those overhead levels usually clear before any real moves up can hold. liquidity always decides.
my 15m chart always got these magnets visible, they are helpful for anticipating traps 🧲📉, but not for entry🎯. Marta, Hannah, the article is not telling anyone to take risk 🙄.
Those pockets up there 👀... makes me wonder what the volume profile looks like on the spot exchanges in those same zones 🤔. Are we just clearing leveraged longs or is there real sell pressure too?! 🔥📉
i really don't get why anyone pushes new people towards speculating on liquidations like this. it's just telling them to risk everything for a quick buck, and believe me, i've seen exactly what happens when that goes wrong. 🤦♂️🤦♀️
i remember 2007 coffee prices were like this sometimes you dont look for the magnets you just wait for the price to move to them
i get the idea of liquidity magnets pulling price... but focusing only on overhead pockets feels like it misses half the story... you could be the exit liquidity if you ignore the other side.
liquidation magnets are useful, yes, but for me it's more about avoiding being the exit liquidity when everyone else gets flushed. good to know where the stacks are.
for me the magnets are also useful for knowing where to avoid holding a heavy perp position through a new season like this one
It’s true that observing these high-leverage areas can be unsettling, especially after seeing how quickly price can run through them; I saw that May 2021 cascade play out myself. Useful to understand the mechanics, though.
hey jonas, i just dont see it the same way... the article just explains why they happen, not that you shud target them 🤷♂️
maybe its unsettling for some but i think it shows you where the real risk is not just targets
Jonas, the cascade in May 2021 was brutal, yes. But the data from back then showed that price tends to revisit those liquidity levels regardless.
Revisiting levels, yes, but the question is *when*. Back then, perp premiums were already negative and sustained. We saw no such basis now, rather the opposite.