


Listen: the breakdown
Developing story update (September 22, 2026, 05:41 UTC):
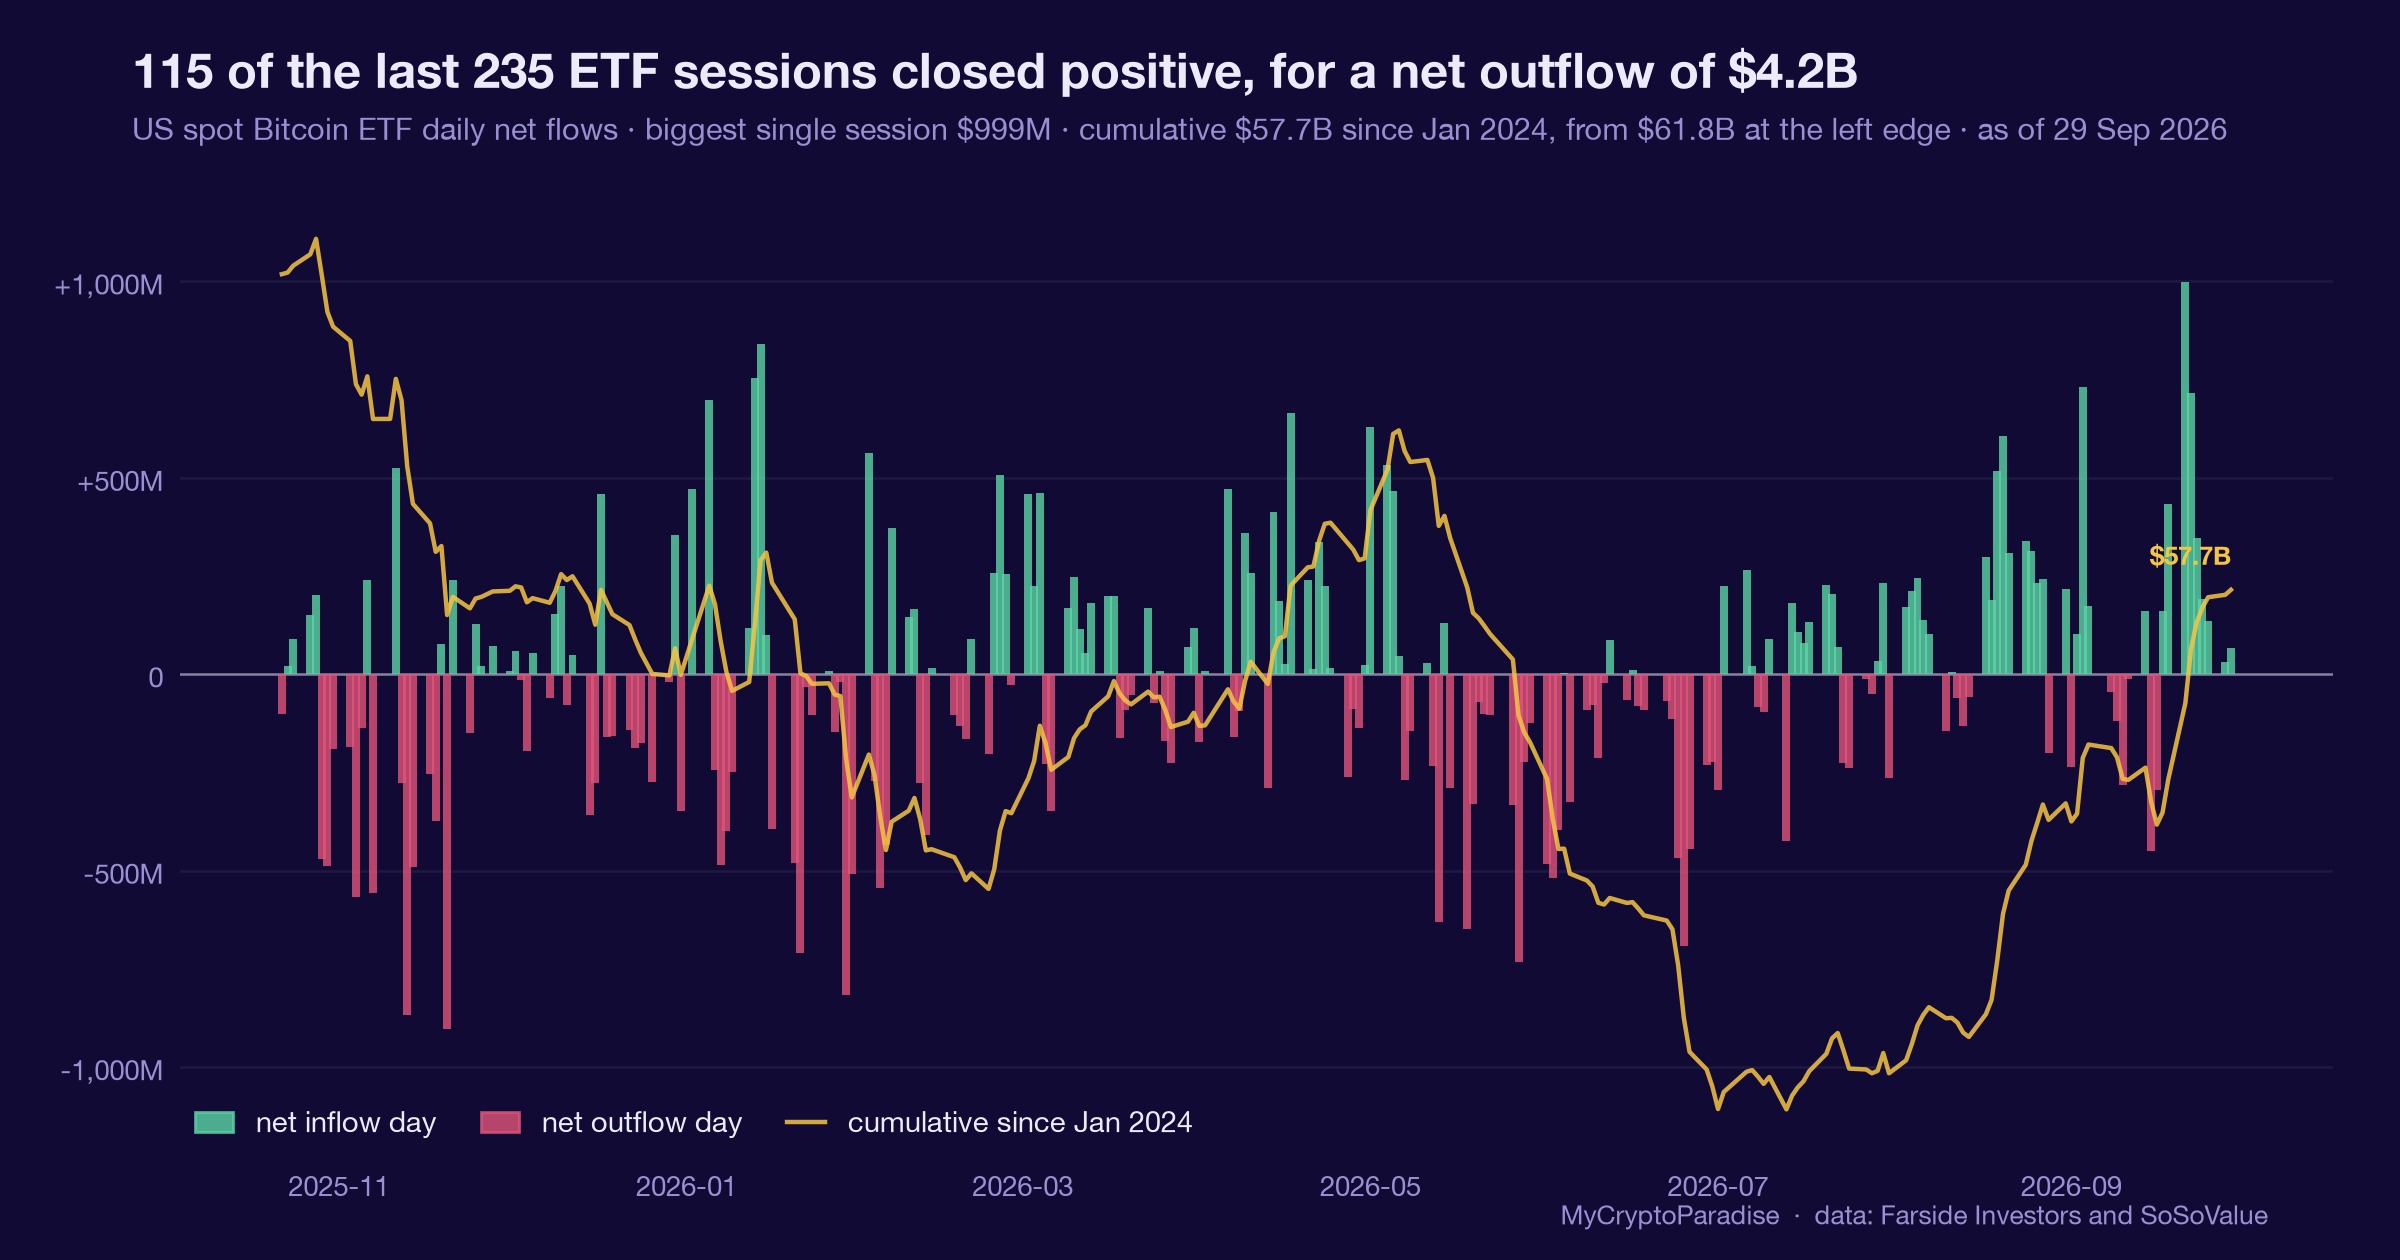
US spot bitcoin ETFs saw $999 million in net inflows on Monday, the largest single-day amount the funds have attracted since Oct. 6, 2025. Bitcoin briefly surged above $87,300 to a multi-month high.
Spot ether ETFs also logged $270 million worth of inflows, the largest amount since Oct. 7, 2025. BTC ETH
Market briefing: US spot bitcoin ETFs bled roughly $296 million on September 17, with ether products losing more on top. BlackRock's own fund joined the exits. BTC traded near $77,239 as institutions quietly stepped back.
- US spot bitcoin ETFs recorded net outflows of about $296 million on September 17.
- BlackRock's IBIT posted a $144 million net outflow, and spot ether ETFs lost $186M to $224M the same day.
- Combined bitcoin and ether ETF outflows reached $514M to $520M, draining institutional demand.
Spot bitcoin ETF outflows hit roughly $296 million on September 17, and even BlackRock's IBIT sold. So who is really buying while retail celebrates the bounce?
US spot bitcoin ETFs did not add money on September 17. They lost it. Net outflows landed near $296 million in a single session, and the selling was broad rather than isolated to one small fund.
The detail that matters most is the identity of the seller. BlackRock's IBIT, the largest and usually the steadiest of the group, reported a $144 million net outflow of its own. When the anchor fund leaves, the story is no longer about one nervous manager.
Ether products fared worse in percentage terms. Spot ether ETFs shed between $186 million and $224 million on the same day. Together, bitcoin and ether funds gave back $514 million to $520 million, a real drain on the demand that carried this market higher.
An early tally that circulated suggested a modest inflow. The confirmed picture says the opposite. We report the verified numbers, not the first headline, and the verified numbers are outflows.
Why does this cut against the mood? Because BTC still traded near $77,239, up on the day, while the money that supposedly validates that price was walking out the door. Price strength and fund flows are pointing in different directions.
That gap is the whole trade. Retail reads a green candle as confirmation. The flow data reads as larger players using that green candle to exit. One of those two readings is usually wrong, and it is rarely the one holding the size.
Institutional demand is quietly walking out
ETF flows are the cleanest proxy we have for institutional appetite. Each dollar that enters a spot fund forces the issuer to buy real coins. Each dollar that leaves forces a sale. So a $296 million bitcoin outflow is not sentiment. It is mechanical selling.
Stack ether on top and the drain widens to more than half a billion dollars across the two majors in one day. That removes a steady bid the market had leaned on all cycle. Passive inflows had absorbed a lot of supply. Take them away and price has to find demand elsewhere.
The IBIT detail sharpens the read. This fund is where the largest allocators park size. Its outflow suggests the exit is not retail panic inside the ETF wrapper. It looks like considered de-risking by the deepest pockets in the room.
There is a familiar rhythm here. Glossy adoption narratives tend to peak just as the flow data quietly turns. The press release and the balance sheet stop agreeing.
For traders, the transmission is simple. Weaker fund demand means thinner support on dips. It means rallies meet supply sooner. And it means the burden of proof now sits with the bulls, because the buyer of last resort just became a seller.
How the flow drain reaches BTC then alts
The pressure starts at the top of the stack and rolls down. Bitcoin absorbs the first hit because ETF flows touch BTC most directly. A $296 million outflow is a headwind even when price prints green intraday.
Ether sits one rung lower and took the harder blow. Losing up to $224 million against a smaller market drains liquidity faster. ETH near $2,471 looks firm on the tape, but the flow behind it is negative, which weakens any bounce.
Alts feel it last and worst. They have no ETF bid at all. They live entirely on the risk appetite that BTC and ETH create. When the majors lose their institutional sponsor, altcoin liquidity thins first and gaps lower fastest.
Watch the mechanism, not the mood. A modest 24-hour green print with negative flows is exactly the environment where sellers work. They feed stock into strength so the exit does not move price against them.
Open interest (OI), the total value of live derivatives contracts, is the tell here. If OI climbs while spot flows bleed, late longs are stacking into a market that large holders are leaving. That is trapped leverage waiting to be flushed, and it usually is.
The flow signal that flips this read
The first thing to track is whether these outflows were a one-day event or the start of a run. A single red day is noise. Three or more consecutive net outflow days would confirm the institutional bid is genuinely fading, not just resting.
Price gives the second signal. BTC sits under the $79,000 resistance that has capped every recent attempt. Reject there again and the bearish case holds. Reclaim and hold above it on strong volume, and the flow story could be changing faster than the tape suggests.
The $58,000 area is the level that matters below. It marks the prior low. A clean break beneath it, especially on rising volume, opens the path toward the $55,000 to $44,000 zone we have flagged.
Invalidation is specific, and we respect it. Sustained positive ETF inflows returning, IBIT included, alongside a confirmed reclaim of $79,000 would force a rethink. That combination would say the deep pockets are buying again, not selling.
Until then, treat green candles as questions, not answers. Ask who sold into that strength. The flow data on September 17 gave a very clear reply, and it was not the reply retail wanted.
Reading the outflows through smart money exits
The ParadiseTeam sees this session as textbook distribution, not a dip to defend. Outflows near $296 million with IBIT among the sellers fit our thesis cleanly: larger holders are offloading into any liquidity retail provides.
Ground it in price. BTC traded near $77,239, pressed against $79,000 resistance, with $82,000 above looking heavy. That is exactly where distribution happens, into strength, near a ceiling, while flows bleed.
Our macro bias stays firmly bearish. We expect continuation toward the $55,000 to $44,000 downside zone, with $58,000 the prior low we think likely breaks. This ETF data does not change that map. It reinforces it.
The smart-money-versus-retail split is the whole point. Retail turns hopeful on small bounces and supplies the exit liquidity larger players need. The green 24-hour print is the bait, not the confirmation.
We stay honest about the other side. There is a bullish divergence and extreme fear on the tape, which can spark sharp relief rallies. We treat those as opportunities for sellers, not proof of a bottom, unless $79,000 is reclaimed and held with real whale support behind it.
Risk note: this is our read, not certainty. Size positions so a fast squeeze against the bearish view does not hurt, and let the flow data and the $79,000 level, not the mood, decide the direction.
The read behind this: we framed this story through our own market analysis, Can Bitcoin Rally From Extreme Fear?
Track it live: our live crypto funding rates and the Crypto Fear and Greed Index both update in real time, so you can watch this shift for yourself.
Related coverage
For exact entries, targets, and stop losses with full risk management, that is what ParadiseFamilyVIP is for. New to reading these moves? Start with our crypto trading strategies guide.
ParadiseTeam is monitoring the market situation closely, and we are taking these developments into consideration while building our trading tactics inside ParadiseFamilyVIP.
Crypto trading involves substantial risk. Prices are volatile and you can lose money. This article is educational and is not financial advice. Past performance does not guarantee future results.
Does BTC break below $58,000 before it reclaims $79,000?
Follow this topic: Bitcoin ETF news











Join the discussion 2
Always instructive to watch the liquidity flow from the weak hands. This reminds me of spring 2013, when the real conviction was forged.
Isabella-san, I also recall the strange energy of that time. It's interesting to see how these patterns repeat, even with new instruments.