



In short: The On-Neck pattern is a two-candle bearish continuation signal. A weak bullish candle closes near the prior bearish low, showing buyers failed. In a downtrend, it warns that sellers likely stay in control.
The On-Neck pattern is a two-candle bearish continuation signal. It appears in a downtrend when buyers try to recover but fail. The second candle closes near the first candle’s low, showing weak demand.
Read that failure as your edge. Sellers paused, not stopped. Once the small bounce runs out of buyers, the downtrend often resumes.
This lesson teaches why the pattern forms, not just how it looks. You will learn to separate strong setups from weak ones using market structure, volume and liquidity.
Understanding the On-Neck pattern
The On-Neck pattern forms during an established downtrend. The first candle is a strong bearish candle, showing sustained selling. The second candle opens below the prior low, or briefly trades under it, then recovers only slightly.
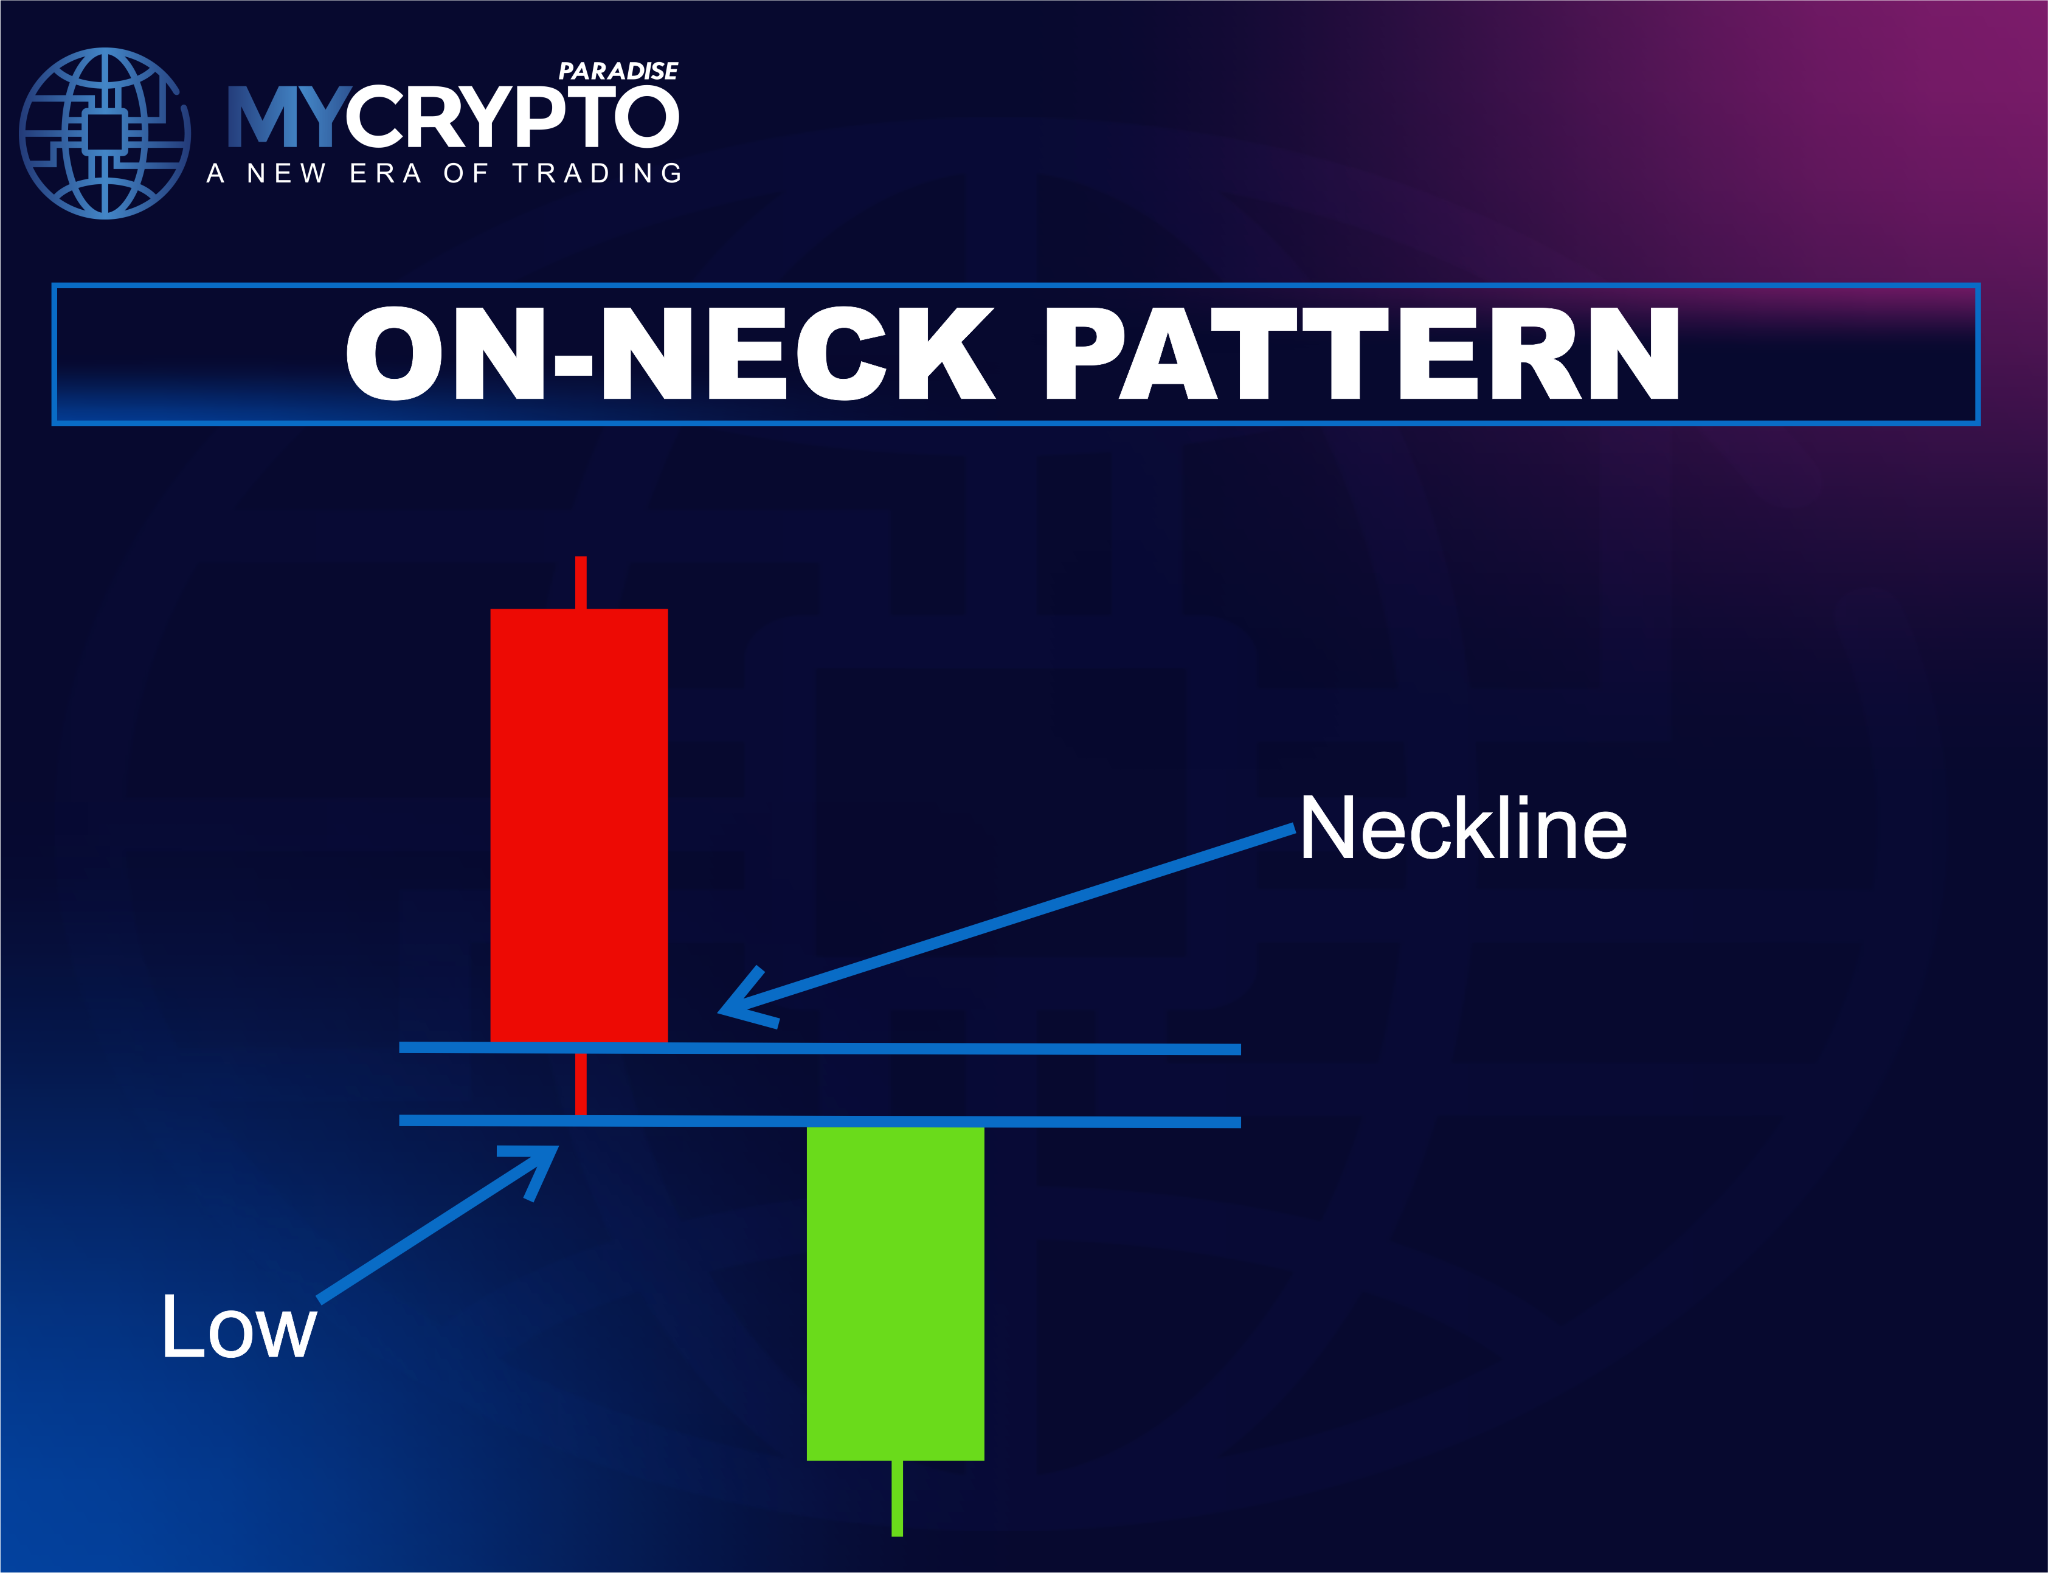
Despite the bounce, the second candle closes at or very near the first candle’s low. That limited recovery shows buyers cannot regain control, so sellers keep the trend intact.
The signal strengthens when it forms below broken support or inside a bearish order block. That block is a price zone where large sellers stepped in before and may sell again. A supply zone, an area where selling has repeatedly overwhelmed buying, adds further weight.
Combined with market structure, volume and liquidity, the pattern gives an early hint that the downtrend may continue.
Key characteristics
A strong downtrend is essential
The pattern only matters inside a clear downtrend. Price should already print lower highs and lower lows. In a sideways market, the signal means little.
The first candle shows strong selling
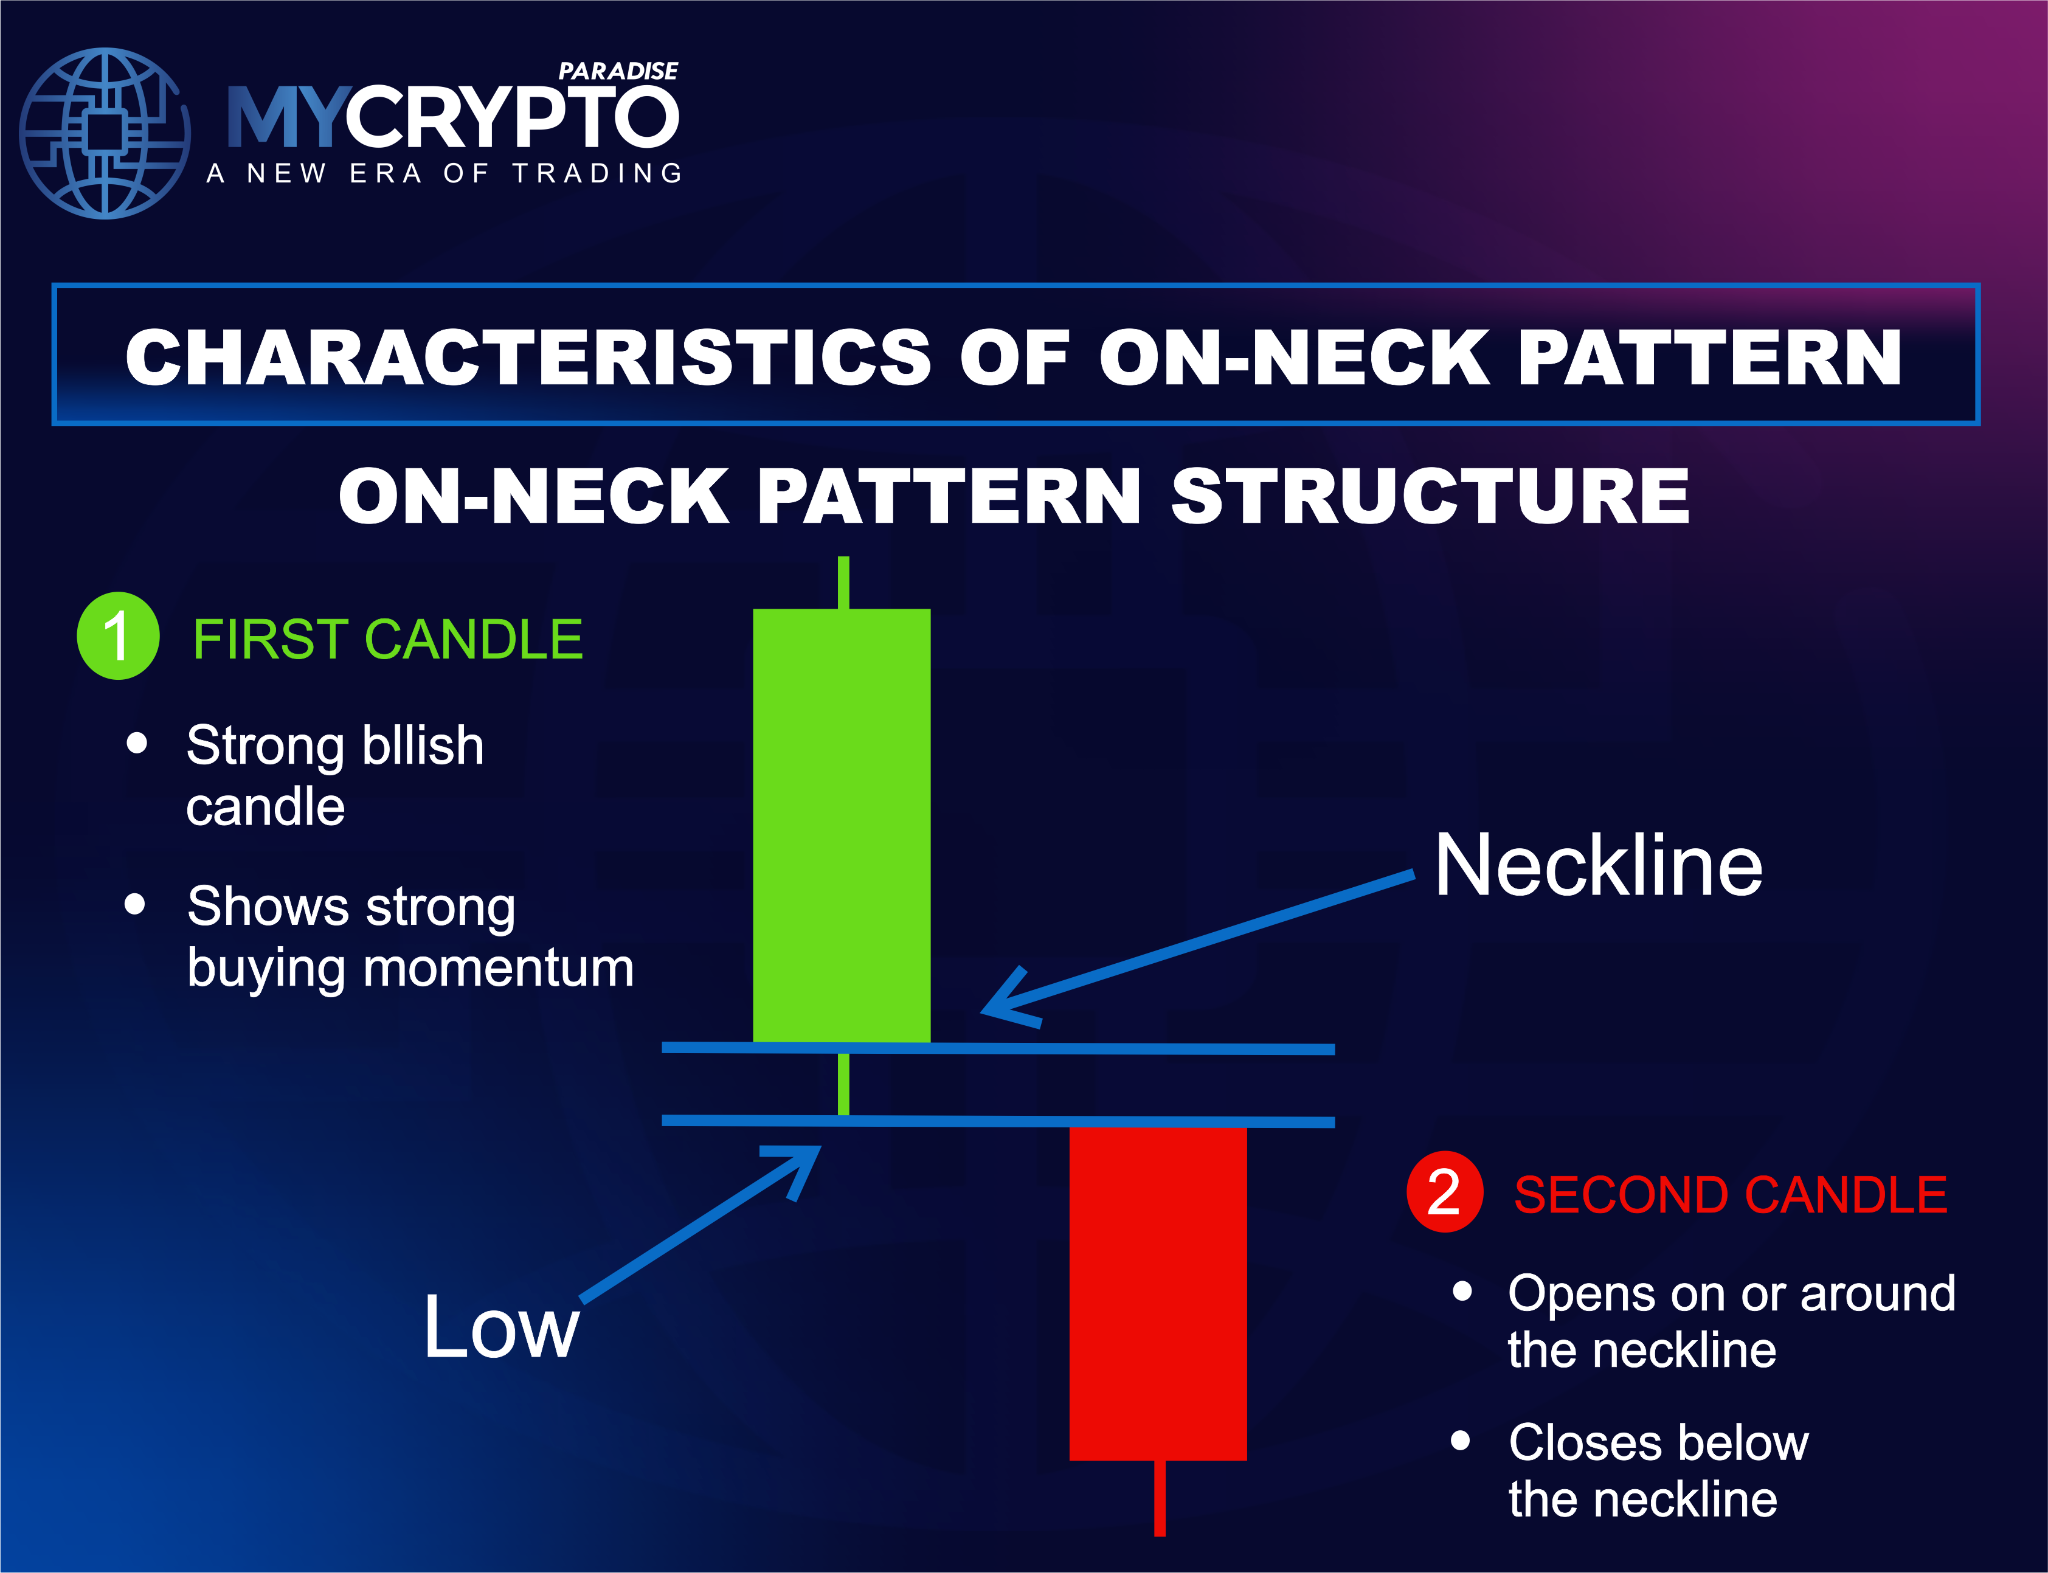
The pattern opens with a large bearish candle. A close near its low shows sellers controlled the session from open to close.
The second candle shows a weak recovery
The second candle is small and bullish. It opens below the previous low, or dips beneath it, then recovers modestly. Buyers gain no real ground.
The closing price defines the pattern
The second candle must close at, or very close to, the first candle’s low. A deeper close inside the body suggests an In-Neck or Thrusting pattern instead.
Why the pattern works
The On-Neck pattern reflects a pause in selling, not a real change in sentiment. Short sellers take profit while dip buyers step in. That buying builds the small second candle, then fades fast.
The weak close is the key. Buyers cannot reclaim the bearish candle, so demand stays too thin to threaten sellers. The market pauses, then bearish momentum returns.
In crypto, this often follows a break below support. The bounce may retest the breakdown level or fill a Fair Value Gap. That gap is a void left by a fast price move that the market often revisits before continuing.
Many retail traders read the bounce as a reversal. More experienced traders often use it to add shorts or offload remaining holdings. Once buying liquidity is absorbed, sellers take back control.
How to identify the setup
Step 1: Confirm the downtrend
Price should make lower highs and lower lows, with sellers in charge. A sideways market lowers the odds. Broader context tools like crypto funding rates can confirm bearish pressure.
Step 2: Mark a key level
Look for the pattern near broken support, bearish order blocks, supply zones, Fair Value Gaps or old breakdown levels. These zones attract fresh selling.
Step 3: Read the two candles
The first candle should be a strong bearish body closing near its low. The second should be a small bullish candle that fails at the first candle’s low.
Step 4: Confirm with volume
Heavier selling volume on the first candle and lighter volume on the second strengthen the setup. Wait for a close below the pattern before acting.
How to trade the On-Neck pattern
Trade the pattern with structure and confirmation, never in isolation. The strongest setups sit at clear resistance with bearish confluence, such as Elliott Wave structure.
Entry
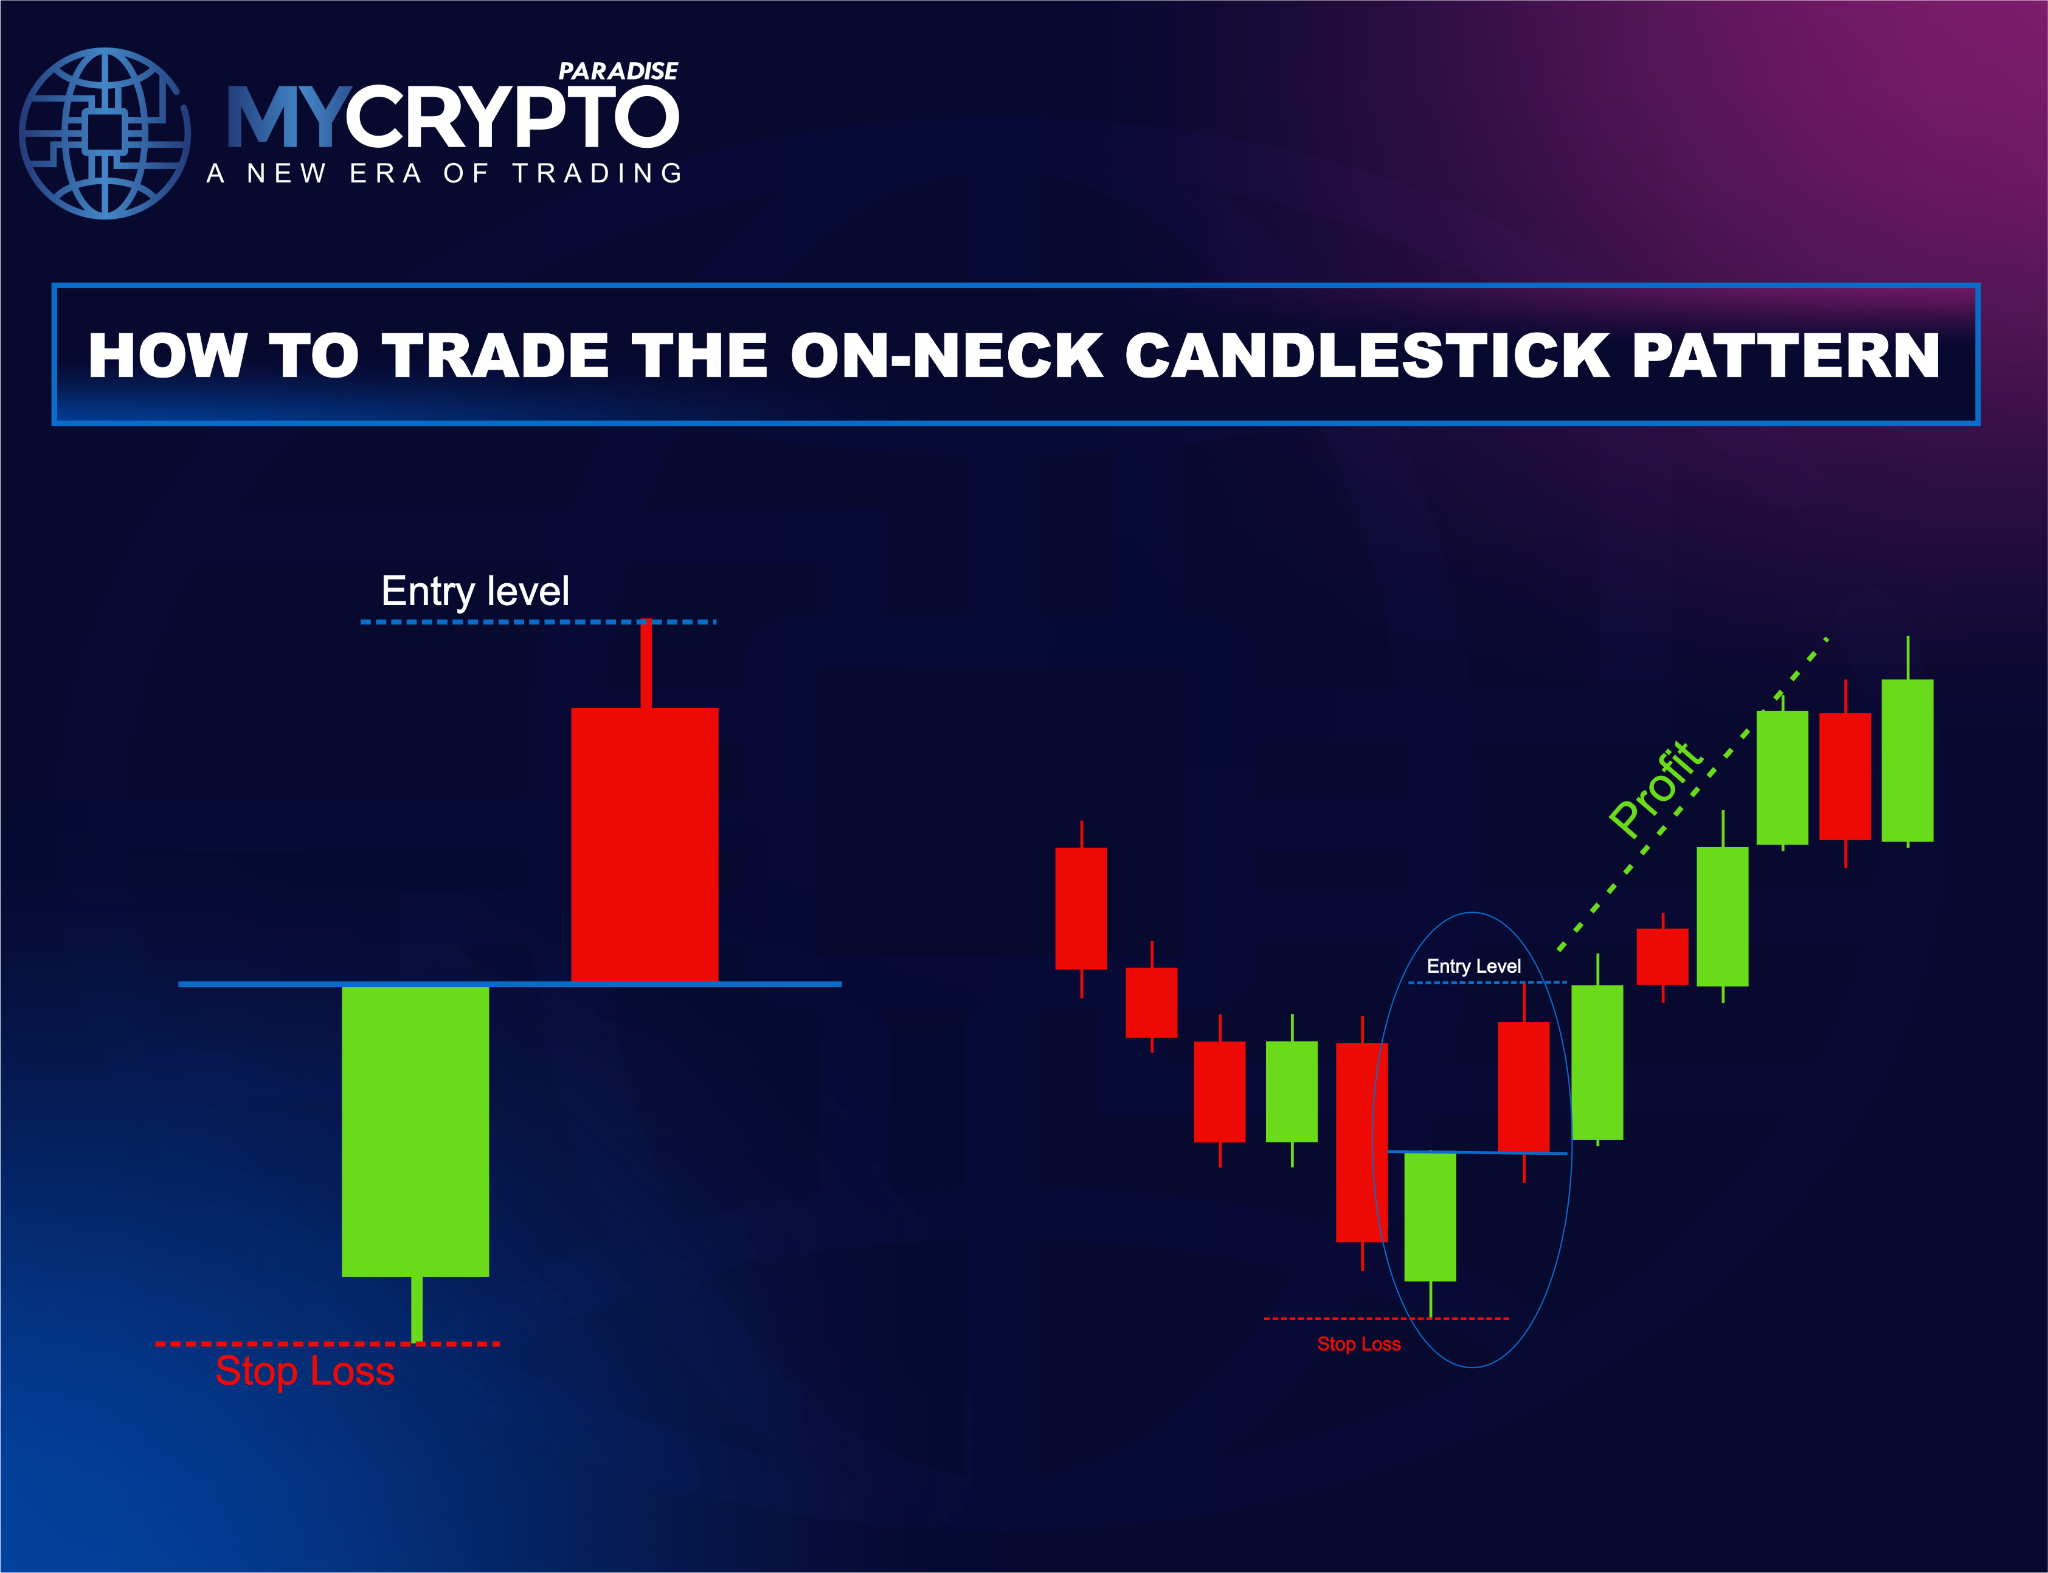
The safer entry comes after price breaks below the pattern’s low. Aggressive traders may enter on the second candle’s close if resistance and confluence line up.
Confirmation and stops
Find the pattern on a higher timeframe, then refine entry on a lower one. Look for a bearish Break of Structure: price breaking below a prior swing low, confirming the downtrend continues.
A liquidity sweep can add confidence: price briefly dips past obvious lows to trigger resting stop orders, then continues. Place the stop-loss above the second candle’s high, or above nearby resistance for more room.
Targets and risk
Aim at logical downside levels: previous swing lows, equal lows, major support, or sell-side liquidity. Sell-side liquidity is the pool of stop orders resting below obvious lows that price is drawn toward.
A crypto liquidation heatmap helps you spot where that liquidity sits. Take partial profit at the first target and trail the rest. Skip any setup where nearby support leaves little downside room.
How reliable is it?
The On-Neck pattern is moderately reliable, and context matters more than the candles. In Thomas Bulkowski’s research, it continues the downtrend just over half the time historically.
Reliability rises inside a strong downtrend, below broken support, or within a bearish order block. Weak bullish volume and alignment with the higher timeframe help too. For context, candlestick analysis is well documented at Investopedia.
Common mistakes
- Ignoring the close: a deep close inside the bearish body may signal an In-Neck or Thrusting pattern instead.
- Shorting into support: entering just above major support caps reward and skews risk.
- Ignoring volume: a strong bounce on heavy volume may warn of a real reversal.
- Overlooking liquidity: price often sweeps equal highs before dropping, wrecking tight stops.
- Fighting the trend: counter-trend setups need far stronger confirmation.
- Excessive leverage: no pattern is certain, and oversizing turns normal volatility into losses.
- Moving the stop: shifting your invalidation after entry breaks the plan.
On-Neck versus similar patterns
Several patterns look alike but tell different stories. Knowing the difference separates a brief pause from a genuine reversal.
On-Neck versus Bullish Engulfing
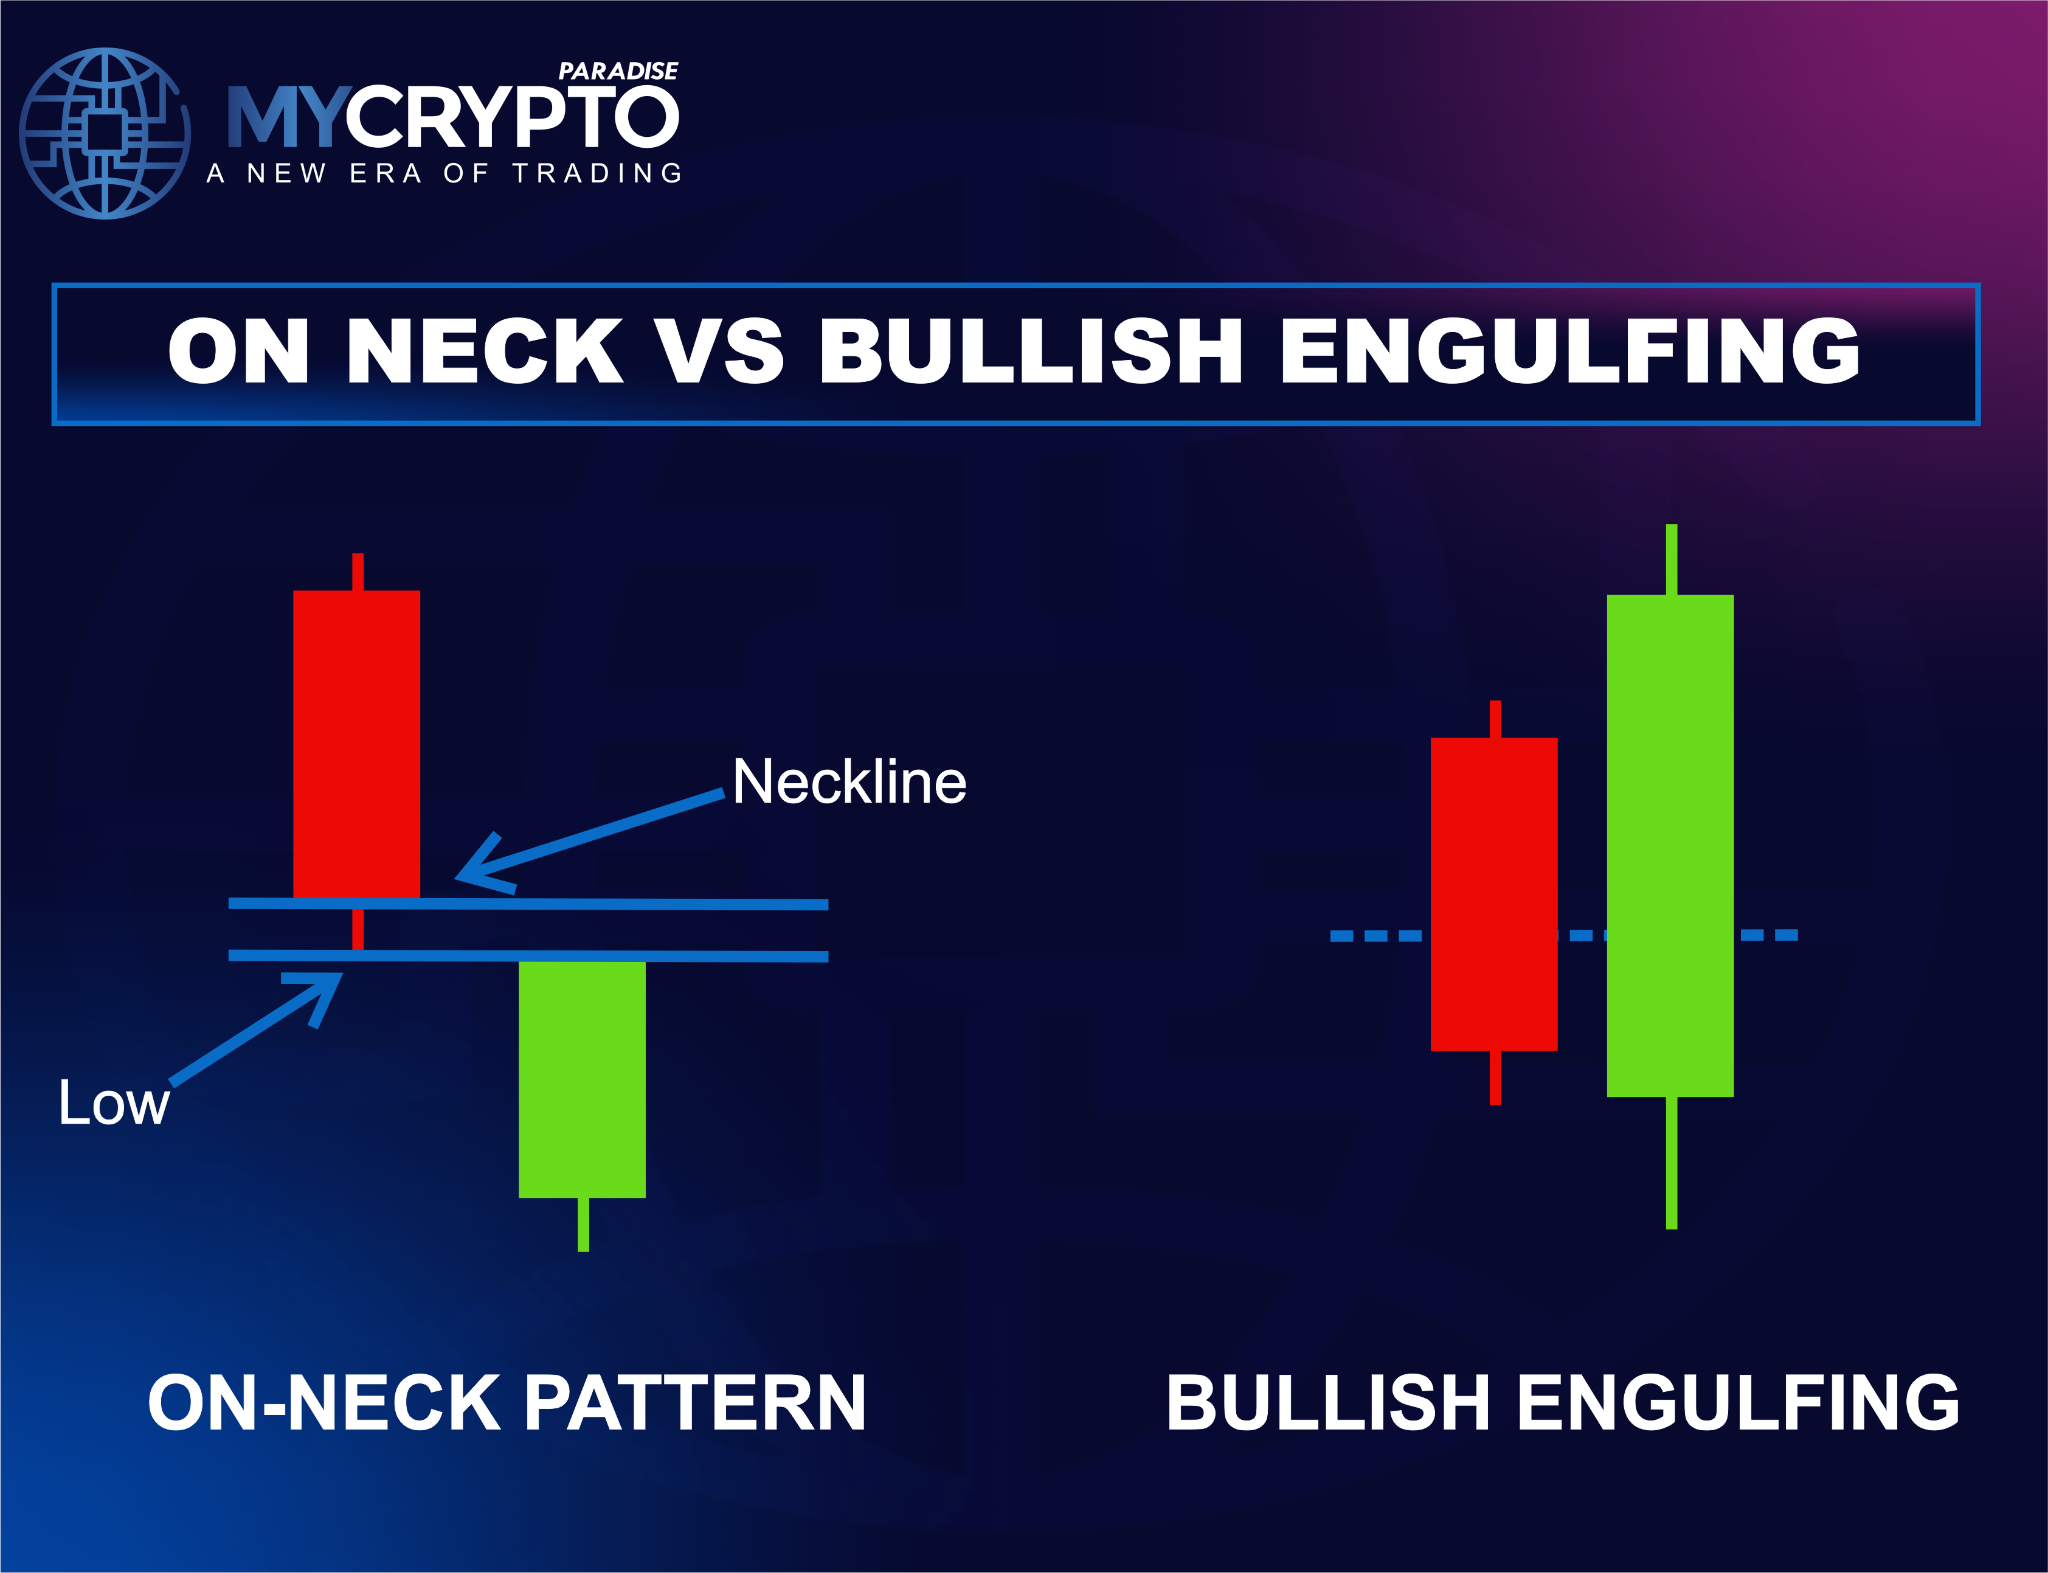
A bullish engulfing pattern fully engulfs the prior bearish candle, showing buyers took control. The On-Neck bounce stays small and closes near the prior low.
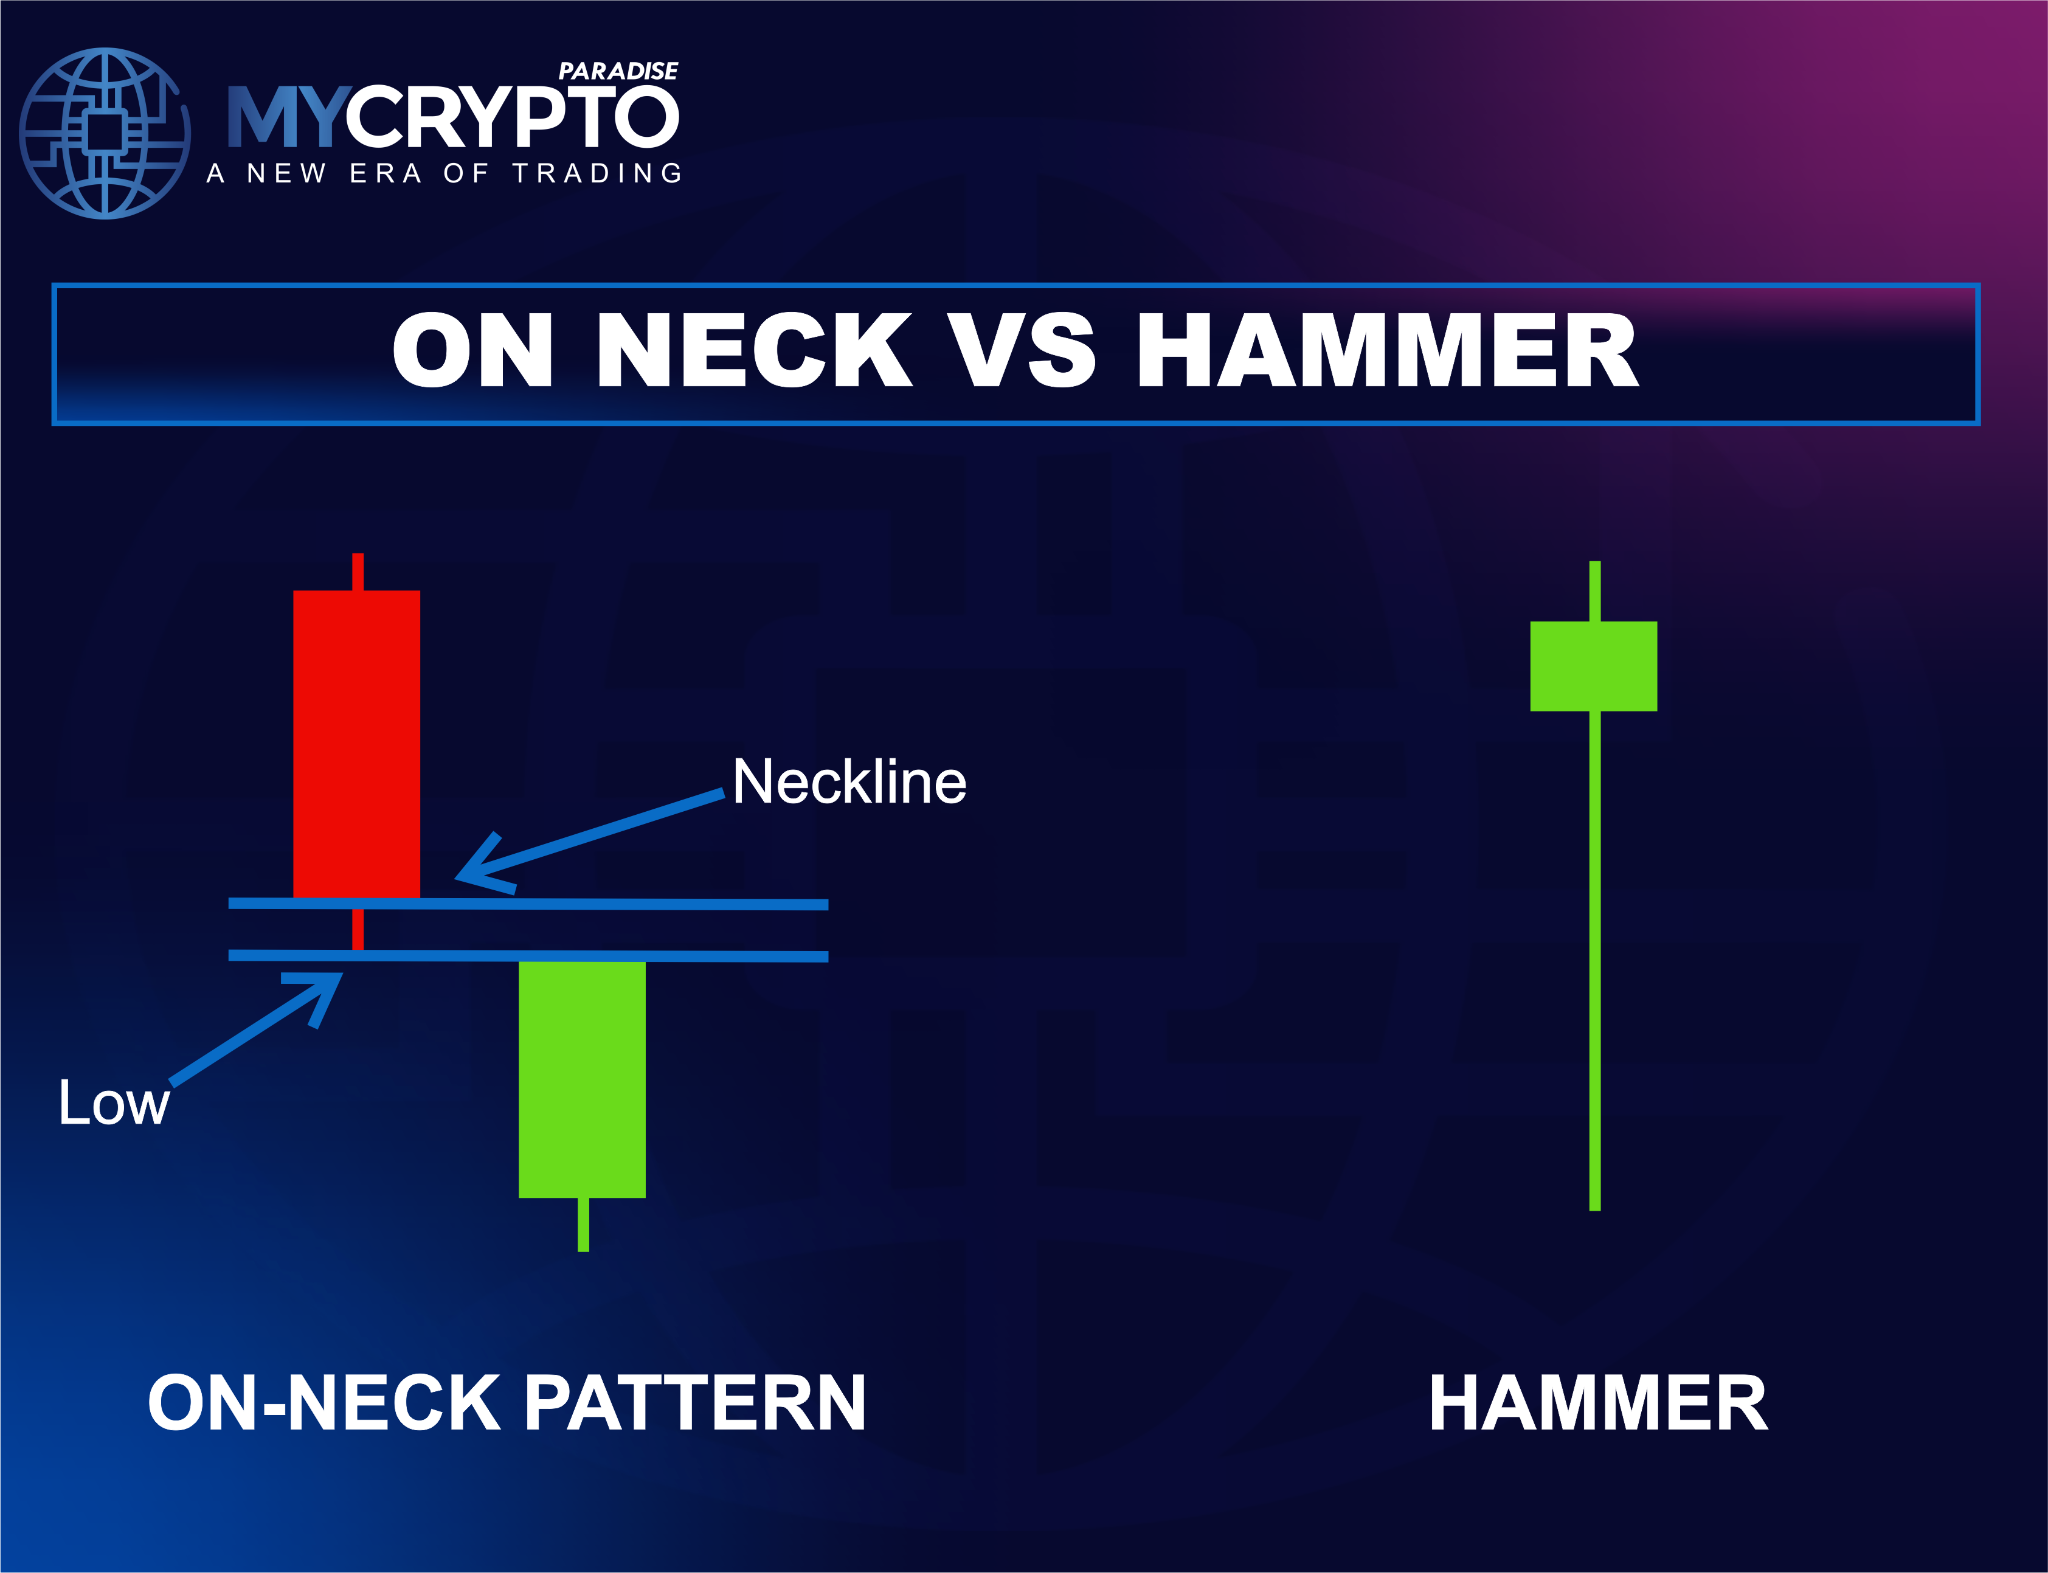
On-Neck versus Hammer
A hammer prints a long lower shadow, showing buyers rejected lower prices. The On-Neck pattern lacks that rejection, so sellers stay in charge.
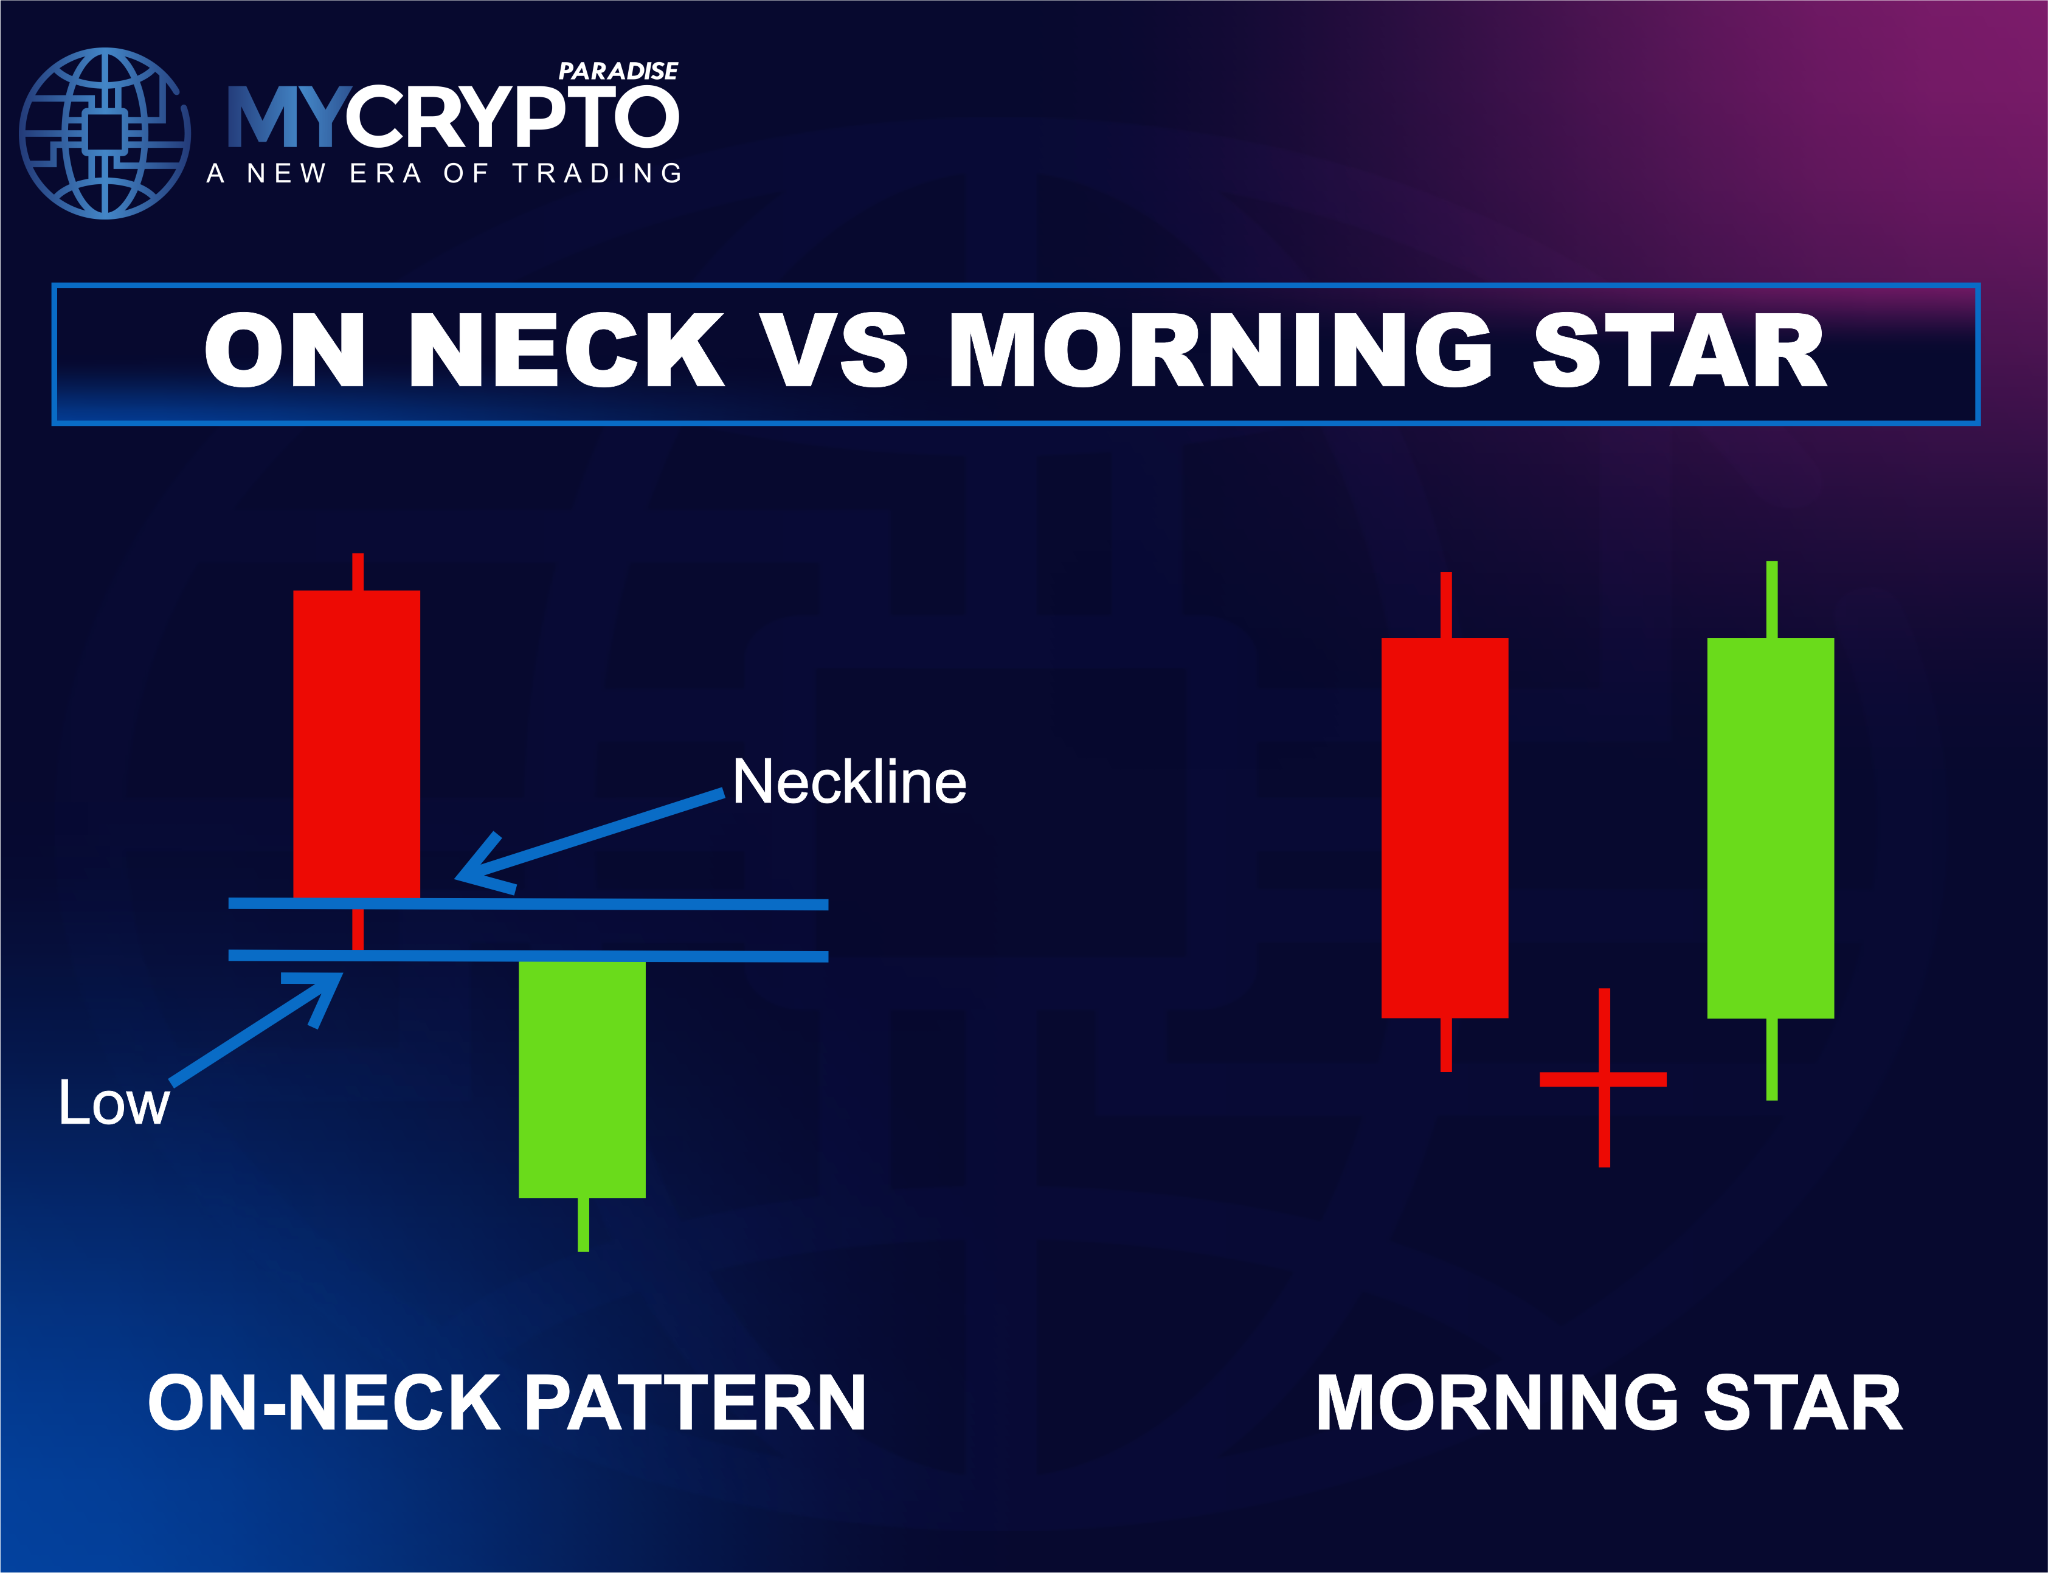
On-Neck versus Morning Star
The Morning Star is a three-candle bullish reversal that hands control to buyers. The On-Neck uses two candles and offers no strong bullish signal.
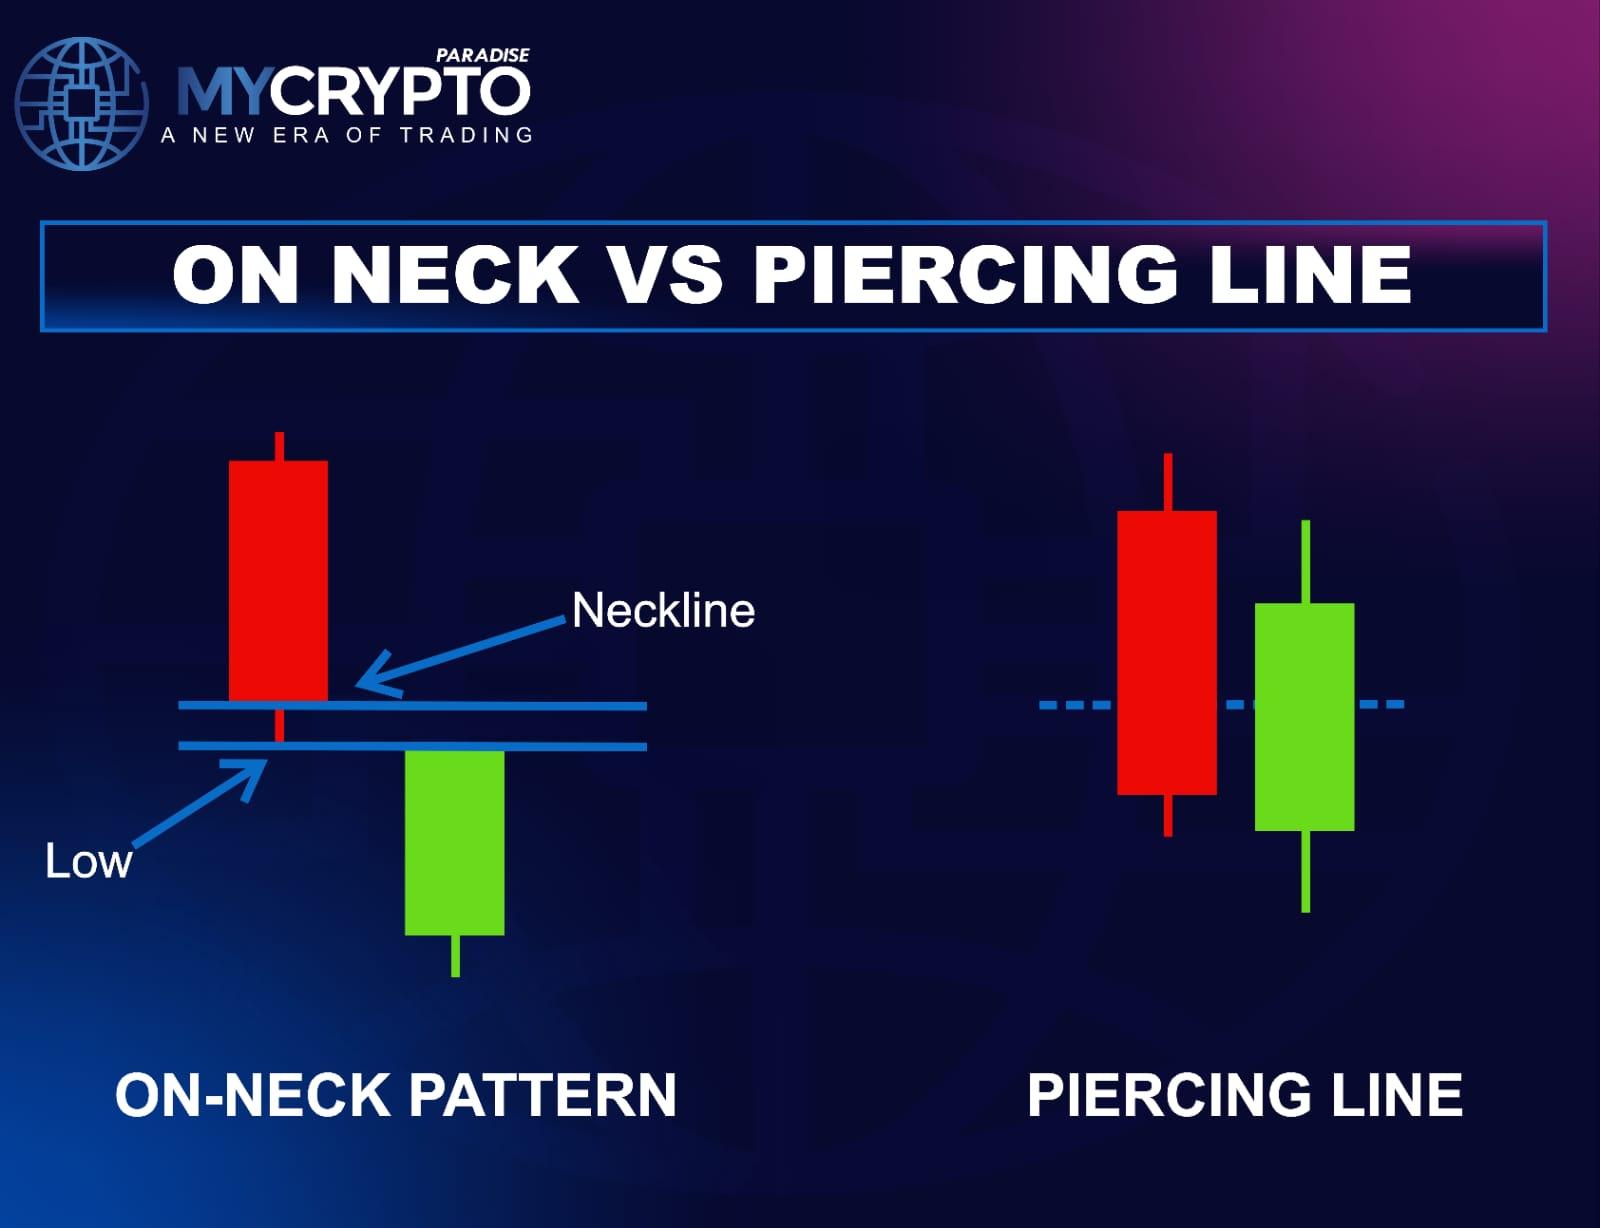
On-Neck versus Piercing Line
The piercing line pattern closes above the midpoint of the first candle, a bullish reversal. The On-Neck closes near the low, reinforcing the downtrend.
Practice this
Open a daily chart of Bitcoin or a major altcoin in a clear downtrend. Mark broken support and any supply zones. Then scan for two-candle sequences where a small bounce dies at the prior low.
Log each example without trading it. Note the volume, the close, and what price did next. This builds pattern recognition before real risk.
The bottom line
The On-Neck pattern is a failed recovery inside a downtrend. Sellers already showed control, and the weak close proves buyers cannot respond. Read alongside structure, liquidity and volume, it flags likely continuation.
MyCryptoParadise is a professional crypto signals and trading-education service, operating since 2016. Our free lessons teach the forces behind each candle, so you can trade with a plan instead of guesswork.
FAQs
What is the On-Neck pattern?
It is a two-candle bearish continuation pattern in a downtrend. A strong bearish candle is followed by a small bullish candle that closes near the first candle's low, showing buyers stayed weak.
Is the On-Neck pattern bullish or bearish?
It is bearish. Buyers attempt a recovery but stay too weak to reverse the trend. In an established downtrend, it warns that sellers are likely to regain control and push price lower.
Does the On-Neck pattern signal a reversal?
No. It is a continuation pattern, not a reversal. The small bounce shows buyers failed, so the existing downtrend often resumes after a brief pause.
Which timeframe works best?
It can appear on any timeframe. Signals on the 4-hour, daily and weekly charts usually carry more weight, since they reflect broader participation. Lower-timeframe patterns work best when they align with a higher-timeframe downtrend.
What confirms an On-Neck pattern?
Look for a break below the pattern's low, rising selling volume, or rejection from broken support. A lower-timeframe Break of Structure or a new lower high adds further confirmation before you enter.
Crypto trading involves substantial risk and is not suitable for everyone. Nothing here is financial advice; it is education only. Never risk more than you can afford to lose.














Join the discussion
No comments yet. Members, share how you are reading this.