


Listen: the breakdown
Developing story update (September 15, 2026, 02:16 UTC):
Update: Coinbase CEO Brian Armstrong has publicly floated a $400,000 long-term Bitcoin target. It is a high-level directional view, not a timeline or a guarantee, and it sits well above where price is trading now.
For traders the read is unchanged on lower timeframes. Bitcoin is still pinned between roughly $76,000 support and the $82,000 rejection zone, and a headline target this far out does nothing to resolve that range. Based on our sources, smart money tends to use exactly these kinds of bullish retail narratives as liquidity to distribute into, so treat the number as sentiment, not a signal.
What to watch now: Whether Bitcoin can defend $76,000 and reclaim $80,400, or loses $75,000 toward a deeper flush.
Developing story update (September 15, 2026, 00:03 UTC):
Update: Coinbase CEO Brian Armstrong has publicly said that $400,000 is within reach for Bitcoin over the longer term. It is a directional call, not a timeline or a guarantee, and it does not change the near-term structure the market is trading right now.
For traders, the practical read is unchanged. Bitcoin is still holding the $76,000 to $80,400 range and defending the $75,000 support area, and a high-profile long-term target does not resolve the immediate consolidation. Treat the headline as sentiment, and keep watching whether $75,000 holds and whether the range high near $80,400 caps rallies.
What to watch now: Whether $75,000 support holds and $80,400 caps rallies, with the CEO price call treated as sentiment only.
Developing story update (September 14, 2026, 23:41 UTC):
Based on our sources, Bitcoin demonstrated a notable decoupling from traditional risk assets on September 14, rising while US tech and AI equities experienced a sell-off. This suggests a potential shift in market dynamics, warranting close observation for sustained independent movement.
Additionally, $75,000 has been identified as a critical new support level, following a week of extreme volatility that included a significant $3,000 intraday price swing after the CPI data release. Traders should monitor this level for potential consolidation or further price action.
What to watch now: Watch for sustained decoupling from tech equities and the $75,000 support level.
Developing story update (September 14, 2026, 22:37 UTC):
Our latest check confirms Bitcoin experienced a notable $3,000 intraday price swing immediately following the recent CPI data release. This specific market reaction provides a clear, quantifiable example of Bitcoin’s heightened sensitivity to macroeconomic indicators.
This volatility suggests that external economic data, rather than internal crypto narratives, remains a primary driver for short-term price action. Traders should factor in this direct correlation when assessing immediate market movements.
We continue to monitor how Bitcoin navigates key support levels, particularly around the $76,600 area, as macro data continues to shape market sentiment and potential distribution patterns.
What to watch now: Monitor Bitcoin's reaction to upcoming macroeconomic data releases for continued volatility and sensitivity.
Developing story update (September 14, 2026, 22:14 UTC):
While Bitcoin continues its range-bound trading, new insights confirm the $76,600 price area has held as support on every close since Thursday, reinforcing the current consolidation phase.
Looking ahead, $75,000 has been identified as a critical support level to monitor. Additionally, Coinbase CEO Brian Armstrong has publicly stated that a $400,000 Bitcoin price is within reach, offering a long-term bullish perspective amidst the short-term sideways action.
What to watch now: Monitor the $75,000 support level for further consolidation or potential breakdown.
Developing story update (September 14, 2026, 21:32 UTC):
Our sources confirm Bitcoin failed to defend a key support level during Sunday’s weekly close, settling near $76,800. This technical breakdown suggests a weakening structure within the established range.
This development aligns with our smart money thesis of distribution at higher levels, preceding a potential deeper correction. Traders should monitor for continued weakness, particularly if $76,000 is breached, as smart money may be positioning for reaccumulation at significantly lower prices.
What to watch now: Watch for continued weakness, especially if Bitcoin breaks below $76,000, as smart money may be targeting lower reaccumulation zones.
Developing story update (September 14, 2026, 19:41 UTC):
Bitcoin’s price action has shown a notable shift, failing to defend the key $75,000 support level during Sunday’s weekly close. This follows a period where the $76,600 price area had consistently held on daily closes since last Thursday, indicating a potential weakening of immediate support.
Adding to the market narrative, Coinbase CEO Brian Armstrong recently stated that a $400,000 Bitcoin price is within reach. While this is a long-term outlook, it provides a bullish counterpoint to the recent technical breakdown.
Traders should monitor how Bitcoin reacts to this new support failure, particularly around the $75,000 mark, as well as the broader market’s response to prominent bullish predictions amidst current consolidation.
What to watch now: Watch for Bitcoin's reaction to the $75,000 level after Sunday's weekly close failure and how market sentiment balances against bullish CEO predictions.
Developing story update (September 14, 2026, 19:19 UTC):
Our latest intelligence confirms Bitcoin experienced a notable $3,000 intraday price swing last week, directly following the release of the CPI data. This volatility underscores the market’s heightened sensitivity to macroeconomic indicators, despite the recent range-bound trading.
What to watch now: Traders should continue to monitor upcoming macroeconomic data releases for potential short-term volatility triggers.
Developing story update (September 14, 2026, 18:35 UTC):
Bitcoin’s price failed to defend a key support level during Sunday’s weekly close, ending around $76,800. This marks a slight dip below the previously observed $76,000-$80,400 range.
This signals increased technical weakness. Traders should note this failure to hold support, as it could precede further downside movement in the short term.
We are now closely watching the $75,000 level as the next critical support.
What to watch now: Monitor Bitcoin's ability to reclaim $77,000 and the $75,000 support level for further downside confirmation.
Developing story update (September 14, 2026, 17:29 UTC):
Update: Coinbase CEO Brian Armstrong has publicly said $400,000 is within reach for Bitcoin, adding a high-profile bullish voice to the longer-term debate. Traders should treat this as a directional opinion, not a timeline, and note the gap between that target and current spot near $78,900.
Nothing in the short-term structure has changed on the back of the comment. Bitcoin is still churning in the same multi-week band, and the failure to hold key support at the recent weekly close keeps the near-term picture cautious. Our read stays the same: smart money looks to be distributing into resistance around $79,000 to $82,000, so a bullish long-range call does not remove the risk of a deeper flush toward reaccumulation zones first.
What to watch now: Whether the $400,000 headline sparks any real spot demand, or price keeps rejecting resistance around $79,000 to $82,000.
Developing story update (September 14, 2026, 16:24 UTC):
Update: Coinbase CEO Brian Armstrong has publicly said $400,000 is within reach for Bitcoin, adding a prominent long-term bull case to a week that otherwise stayed range-bound between roughly $76,000 and $82,000. Treat this as a directional opinion from a major industry figure, not a timeline or a guarantee.
For traders the practical read is unchanged in the near term. Price is still chopping under resistance, with $75,000 now flagged as the key support to watch and the $79,000 to $82,000 zone acting as the ceiling. A long-term target does nothing to resolve that range until one side breaks with volume.
What to watch now: Whether BTC defends $75,000 support or loses it, and if a close back above $82,000 confirms a breakout from the multi-week range.
Developing story update (September 14, 2026, 15:41 UTC):
Our latest analysis indicates new, specific technical levels for Bitcoin. A confirmed fall below $76,040 could see prices target the $75,000-$74,000 range, reinforcing the current bearish bias on higher timeframes.
Bitcoin’s price closed Sunday at $76,800, providing a precise figure for the weekly close where it failed to defend key support. This specific data point refines our understanding of the market’s immediate reaction to resistance.
Furthermore, the Coinbase Premium is now confirmed to be negative, suggesting continued selling pressure from larger holders. This strengthens our previous assessment of smart money distribution in the current range.
What to watch now: Monitor the $76,040 support level; a break could signal a move towards $75,000-$74,000.
Developing story update (September 14, 2026, 13:50 UTC):
Our latest check confirms Bitcoin tagged $82,281 before closing Sunday around $76,800, providing more precise data on last week’s price action and rejection from the $82,000 level.
A notable new development is the negative Coinbase Premium, indicating a potential shift in institutional sentiment or reduced buying pressure from larger players on the platform.
What to watch now: Monitor institutional sentiment as reflected by Coinbase Premium and Bitcoin's ability to reclaim and hold above $80,000.
Market briefing: Bitcoin spent the week trapped between 76,000 and 80,400, closing near 77,200 after a rejection at 82,000. It trades near 77,673 now, up 1.2 percent on the day, but the weekly tape still leans heavy.
- Bitcoin held a $76,000 to $80,400 range last week and closed near $77,200, down roughly 3 to 4 percent.
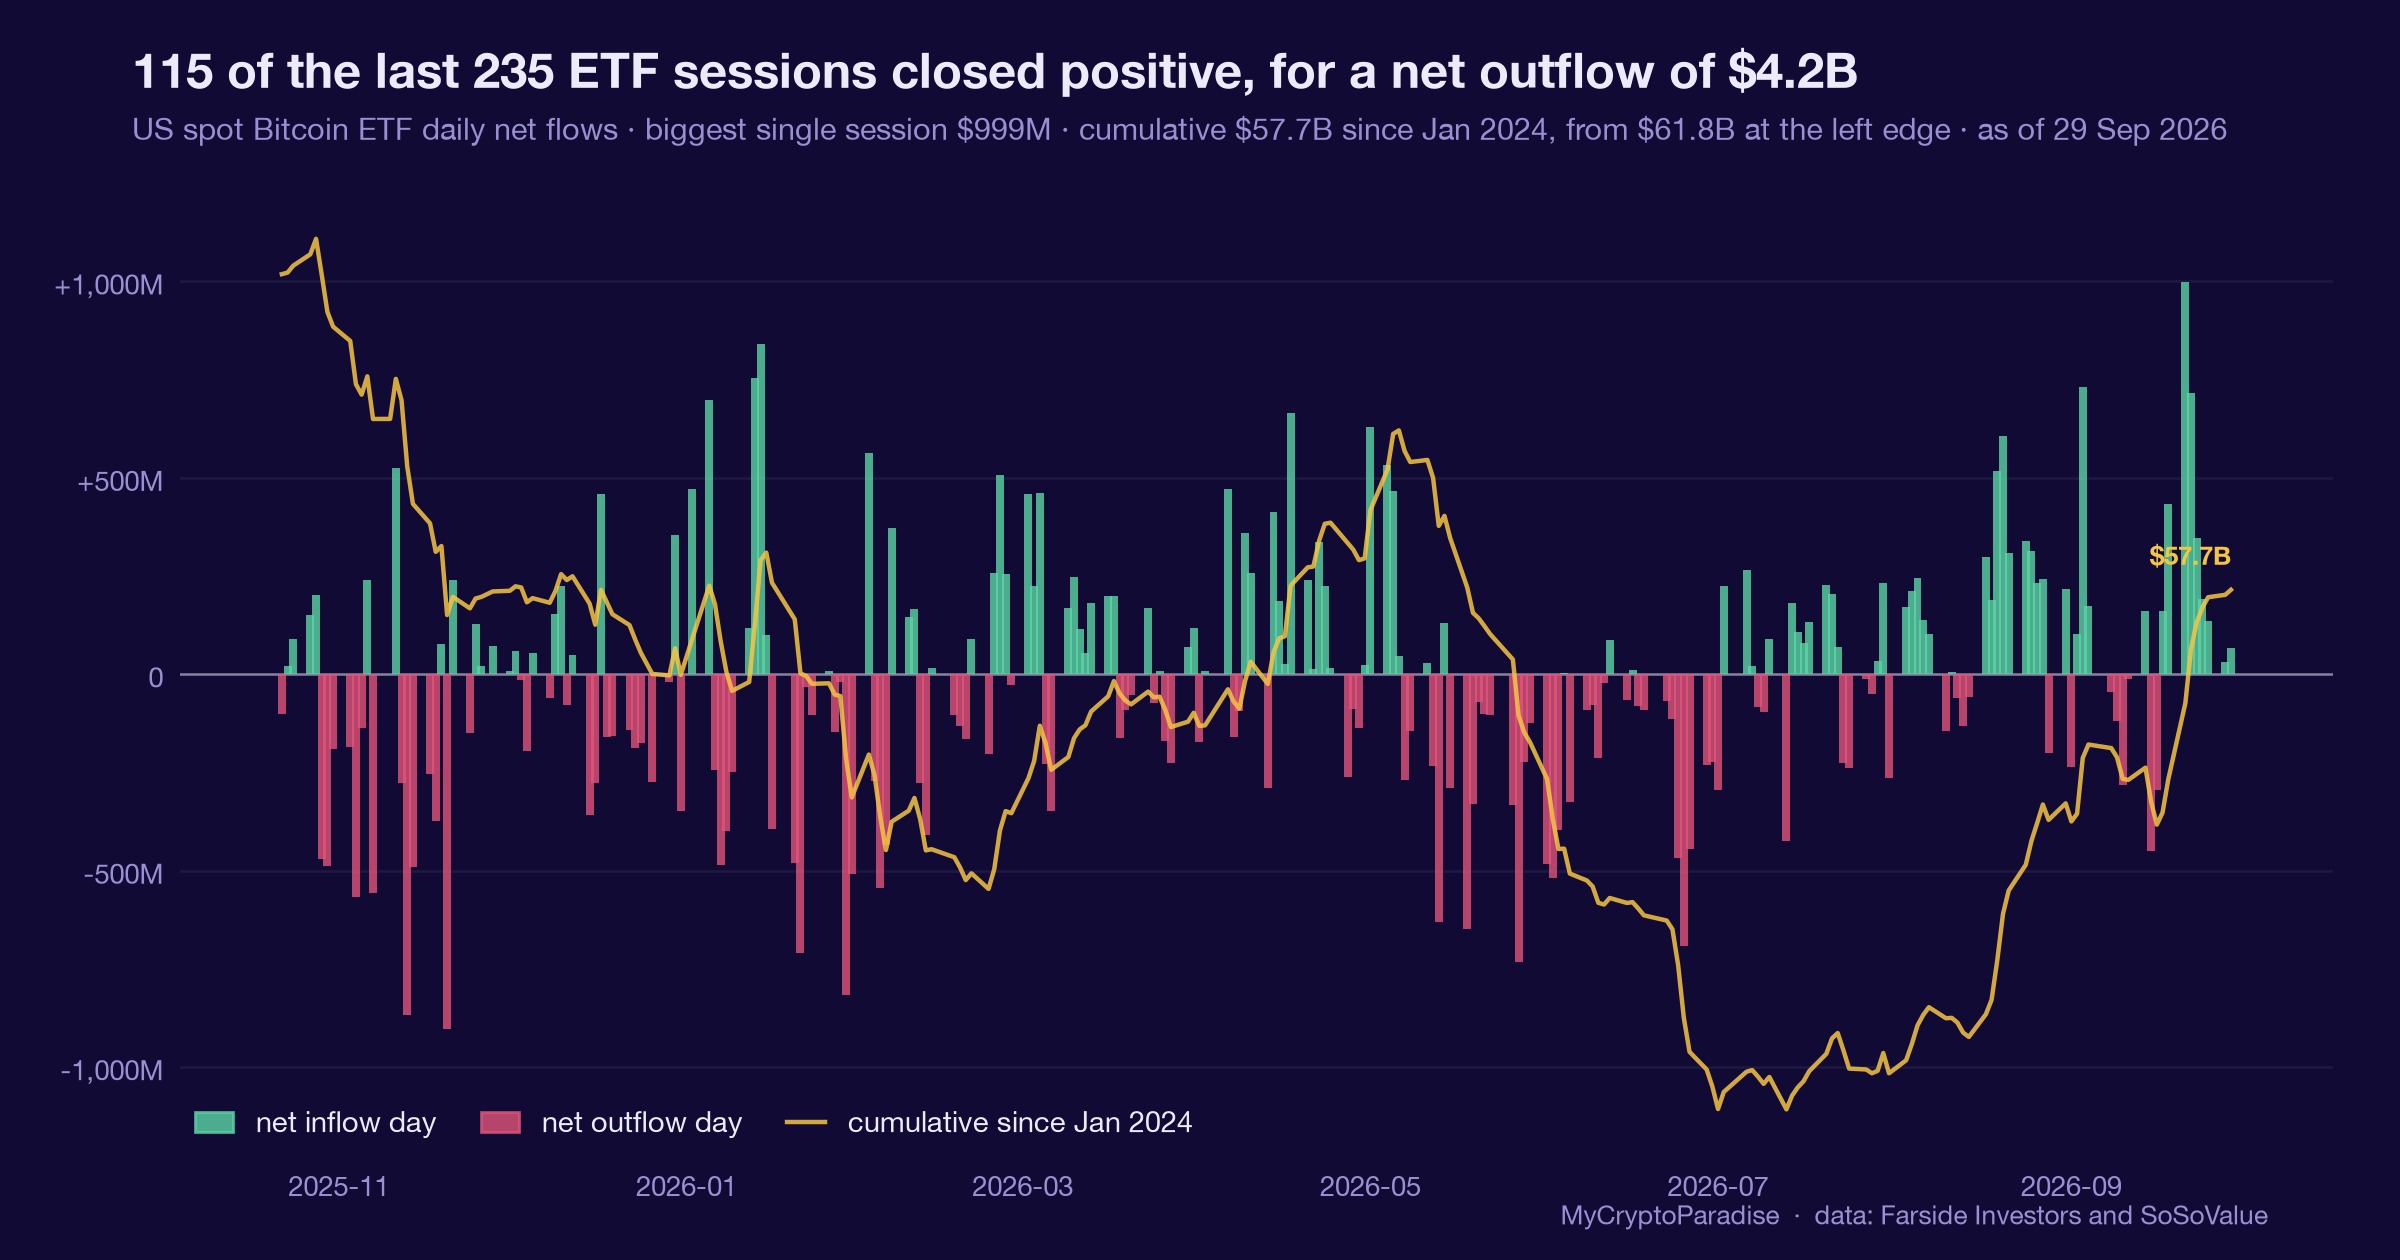
- A clean rejection at $82,000 and near $500M in ETF outflows point to distribution, not accumulation.
- On September 14 Bitcoin rose while US tech and AI equities fell, a rare short-term decoupling.
Bitcoin spent the week stuck in a $76K to $80K range, rejected at $82,000, yet it climbed while AI stocks bled on September 14. Is this strength or a setup for lower prices?
Bitcoin spent the last week going almost nowhere, and that stillness is the story. Price stayed boxed between $76,000 and $80,400, then closed near $77,200, down roughly 3 to 4 percent from the open. As of this writing it trades near $77,673, up about 1.2 percent on the day. A quiet tape, but not a calm one.
The week had two clear moments. First, a $3,000 intraday swing around the latest inflation print, a reminder that Bitcoin now trades like a leveraged bet on macro data. Second, a clean rejection at the $82,000 level, the ceiling buyers could not break.
Then came the odd part. On September 14, Bitcoin rose while US tech and AI equities fell. A rare decoupling from the risk-asset crowd it usually shadows.
That single green day is fuelling a familiar hope: that Bitcoin has finally found its own legs. Every cycle produces a moment where someone declares crypto immune to stocks. It rarely lasts a full week.
Underneath, the structure looks heavier than the headline suggests. Buyers kept failing at resistance, the weekly candle closed red, and exchange-traded fund outflows crept toward $500M. That combination, gains that will not stick plus money quietly leaving, is what waning demand looks like before a range breaks the wrong way.
Macro data still drives every Bitcoin candle
The real driver here is not one headline but the macro backdrop compressing Bitcoin into a range. Inflation data, a looming rate decision, and rising oil have kept risk assets on edge. Bitcoin sits directly in that current, reacting to every print rather than leading.
That $3,000 intraday swing around the inflation release tells you how tight positioning has become. When a single data point moves price that far in hours, it means leverage is stacked and conviction is thin. Traders are reacting, not investing.
The transmission chain is simple. Macro uncertainty raises the cost of holding risk. Higher perceived risk pulls liquidity toward cash and short-dated safety. Thinner liquidity makes Bitcoin's ceiling at $82,000 harder to break and its range easier to defend from above.
This is why the September 14 decoupling matters less than it looks. Bitcoin outrunning falling AI stocks for one day is not independence. It is noise inside a range while the larger tide, tightening liquidity into a rate decision, still runs against it.
So the structural read is this: until macro conditions ease, rallies meet sellers and dips meet nervous buyers. A market that cannot hold $82,000 in that environment is not coiling for a breakout. It is being slowly relieved of coins by those who bought lower, one failed push at a time.
Rejection near $82K pressures the whole risk stack
Start with Bitcoin, because everything else takes its cue from it. The failure at $82,000 and the drift back toward $77,000 set the tone for the entire crypto complex. When the leader cannot hold its ceiling, capital stops chasing and starts protecting.
Open interest, the total value of outstanding derivatives positions, tends to build under a stubborn ceiling like this. Longs pile in expecting the breakout, which stacks stop-losses just below the range. That fuel does not vanish. It waits to be hit.
That is the liquidity trap in a range-bound week. The obvious stops sit under $76,000. A push into that pocket would cascade through leveraged longs and hand cheaper coins to whoever is patient. Bearish news near support often does exactly that.
Ethereum inherits this pressure with a delay and amplifies it. ETH usually lags Bitcoin's weakness, then falls harder once BTC confirms a break. A leader stuck in a range keeps ETH capped just the same.
Altcoins sit at the far end of the whip. They rally hardest on green days and bleed fastest on red ones, so a $500M drift out of Bitcoin funds drains the speculative edge first. In a tape like this, the smaller the coin, the sharper the swing. Retail feels that most, because retail owns the tail.
The next daily candle decides the range
The single most important signal now is the next daily candle. A bearish engulfing print, where the day fully wraps and closes below the prior one, would confirm the recent shooting-star tops and tilt the odds toward a range break lower. That is the confirmation the bearish case needs.
Invalidation is just as clear, and traders should respect it. A decisive reclaim of the $82,000 to $88,000 zone, held as support rather than tapped and rejected, would break the distribution read. That would argue buyers are back in control and the range resolves higher.
Watch the ETF flows too. If outflows keep grinding toward and past $500M, that is real money voting with its feet, and it rarely reverses in a single session. A sudden flip to steady inflows would be the early tell that fear is exhausting.
Keep an eye on the equity link as well. If Bitcoin's September 14 decoupling holds and it keeps rising while AI stocks fall, that is genuinely new information. If it snaps back to tracking stocks within days, the decoupling was just range noise dressed up as a regime change.
Finally, watch behaviour at $76,000. A clean flush that reclaims fast smells like a liquidity grab. A slow bleed that stays broken is trend. The difference between those two is the difference between a shakeout and a real leg down.
Reading the range through smart money hands
The ParadiseTeam reads this week as textbook distribution, not a base. Price kept failing at $82,000, the top of the $82,000 to $88,000 resistance zone, exactly where larger hands have been offloading. The stall near $79,000, a prior distribution shelf and the 0.618 retracement, fits the same picture.
Tie that to the current $77,673 print. Bitcoin is caught between a ceiling it cannot reclaim and a floor at $76,000 that looks increasingly fragile. The ParadiseTeam view is that a short-term bounce can still occur, potentially reaching for the 0.786 retracement, but into strength, not from it.
The recent daily shooting stars, one with a small body and a long wick, are the tell. A bearish engulfing candle stacked on top would be a strong confirmation that the final push is done.
Here is the who-does-what. Retail is fearful, shown by ETF outflows nearing $500M, and fear near a range low is when the crowd usually sells the bottom. Smart money reaccumulates lower, which is why the ParadiseTeam is watching the $61,000 zone, not chasing $82,000.
Risk note, plainly: this is a probabilistic read, not a certainty, and a firm $82,000 to $88,000 reclaim invalidates it. Define risk-to-reward, or R:R, before entering, and set a stop-loss, or SL, that respects the range. Let the daily close confirm before committing.
The read behind this: we framed this story through our own market analysis, Bitcoin ETF Outflows Near $500M: Crash Next?
Track it live: our live crypto funding rates and the Crypto Fear and Greed Index both update in real time, so you can watch this shift for yourself.
Related coverage
For exact entries, targets, and stop losses with full risk management, that is what ParadiseFamilyVIP is for. New to reading these moves? Start with our crypto trading strategies guide.
ParadiseTeam is monitoring the market situation closely, and we are taking these developments into consideration while building our trading tactics inside ParadiseFamilyVIP.
Crypto trading involves substantial risk. Prices are volatile and you can lose money. This article is educational and is not financial advice. Past performance does not guarantee future results.











Join the discussion 1
Man, that rejection at 82k really shows how strong the AI correlation is... I watch those charts like a hawk now. 🧐