


Listen: the breakdown
Market briefing: Bitcoin ETFs are pulling in cash again while BTC trades near $64,637, still 50% under its record. We read the inflow as absorption, not a breakout, with a long squeeze more likely than an immediate rip.
- Bitcoin ETF inflows have resumed while BTC holds near $64,637.
- Price still sits roughly 50% below its all-time record.
- We read the flow as smart money absorbing leveraged retail longs.
Bitcoin ETF inflows are back while BTC still trades 50% below its record. Bullish headline, stalled price. So who is really absorbing all that cash?
Bitcoin ETFs are drawing cash again. On paper, that is the clean bullish story every retail buyer wants.
Yet BTC trades near $64,637, up a modest 0.5% on the day and still around 50% below its all-time record. Fresh money is arriving. Price is barely moving.
That gap is the whole story. A market that absorbs steady inflows without breaking out is telling you something about who sits on the other side of the trade.
We covered spot inflows earlier today when $273M landed and Bitcoin quietly slipped. This is the same thread, one step further: the flow keeps coming, the record stays 50% away, and the structure has not changed.
Inflows are a demand signal, not a guarantee of higher prices. Someone still has to sell every coin those funds buy. When price stalls while cash pours in, that selling is being met, patiently, by size.
Retail reads the inflow headline and reaches for leverage. That is the reliable part of every cycle. The buy button feels safe when the news agrees with the position.
Structurally, this matters because it defines where the pressure sits. Long positions stacked into a stalling market are fuel, not strength. The Bitcoin ETF inflows are real, but the reaction to them is what we watch, and the reaction so far is silence.
Why steady inflows leave price stuck
The transmission mechanism runs through liquidity, not sentiment. Bitcoin ETF inflows convert cash into spot demand, which should tighten supply and lift price.
When it does not lift price, the supply is being provided elsewhere. Larger holders sell into the demand, absorbing the flow and capping the move.
This is how a bullish input produces a flat chart. The macro liquidity is arriving. It is simply being met by equal or greater supply at these levels.
Being 50% below the record matters here. It frames the whole setup as a market still climbing back, where every rally attempt meets holders who bought lower and are content to lighten up.
The knock-on effect lands on positioning. Steady inflows give retail a reason to chase, and leverage builds on the long side into a market that is not rewarding it.
That crowded long book becomes the real driver of the next move. Not the news, but the stops sitting beneath it.
So the mechanism is straightforward. Inflow creates confidence, confidence creates leverage, leverage creates liquidity below the price, and that liquidity is exactly what a market needs to fund its next flush. The bullish headline quietly builds the bearish trigger.
How the squeeze risk spreads across coins
BTC leads this, as always. If the long book flushes, Bitcoin moves first and sets the tone for everything beneath it.
The immediate liquidity sits just below the current price. A stalling market near $64,637 stacks stops under the recent range, and those stops are the fuel for a fast move down before any recovery.
ETH tends to amplify the move rather than resist it. In a leverage flush, Ether usually falls a touch harder than Bitcoin because its long positioning is thinner and quicker to unwind.
Alts sit at the far end of the whip. They are the most leveraged, the least liquid, and the first to gap when Bitcoin snaps a level.
That is the cascade we watch. A Bitcoin ETF inflow headline that fails to lift spot, a crowded long book, then a downside sweep that hits BTC, ETH and alts in that order.
The timing is not guaranteed. Absorption can persist longer than leveraged longs can stay solvent, and price can grind before it moves.
But the shape is familiar. Cash arrives, price stalls, retail leans long, and the market reaches for the liquidity below before it decides whether the record is worth chasing again.
What confirms the squeeze versus the breakout
The cleanest tell is how price behaves near resistance. The current market sits at a 0.618 retracement, with $64,900 the next immediate ceiling on the hourly.
If BTC keeps stalling under $64,900 while inflows continue, that is absorption confirming. Demand is arriving and being sold into, and the squeeze thesis stays alive.
Watch the short-timeframe momentum. Hourly indicators are already rolling over, and a bearish momentum cross there would strengthen the case for a flush before any real recovery.
Invalidation is just as concrete. A firm reclaim of $67,000 as support would tell us the absorption failed and buyers actually took control.
Until then, the support shelf is the map. The immediate band sits at $63,600 to $63,200, and the deeper, more interesting zone sits at $60,000 to $59,000.
That lower band is where we expect the squeeze to hunt liquidity. A sharp wick into it that snaps back would be the tell that the flush is done and accumulation is under way.
Funding rates matter too. If funding stays hot and longs stay crowded into a stalling price, the setup for a downside sweep only tightens.
So the question is not whether Bitcoin ETF inflows are bullish. It is whether price can convert them into a reclaim of $67,000, or whether it flushes the longs first and shops for coins near $59,000.
What the inflows signal for liquidity
The ParadiseTeam reads this Bitcoin ETF inflow as absorption, not ignition. Cash is arriving near $64,637, and the market is quietly meeting it rather than running.
Our near-term bias stays cautious. The story we care about is the crowded long book building into resistance, not the friendly headline on top of it.
Resistance is well defined. Price is pressing a 0.618 retracement, with $64,900 above it and $67,000 as the level that would genuinely change the picture on a clean reclaim.
Support is where the interest lies. We flag $63,600 to $63,200 as the immediate shelf and $60,000 to $59,000 as the zone worth respecting if the flush arrives.
Here is the mechanism in one line. Retail buys the inflow narrative with leverage, smart money absorbs it, and the stops beneath price become the target.
That is why we treat a sweep toward $59,000 as opportunity rather than disaster. A sharp move into that band that reclaims quickly would fit accumulation, not collapse.
The medium-term structure still points higher, with $79,000 the swing target once the leverage is cleared. But the sequence usually punishes the impatient long before it pays the patient buyer.
None of this is certainty, only probability. We stay risk-first, let the market show its hand at resistance, and watch whether the inflows lift price or simply feed the squeeze.
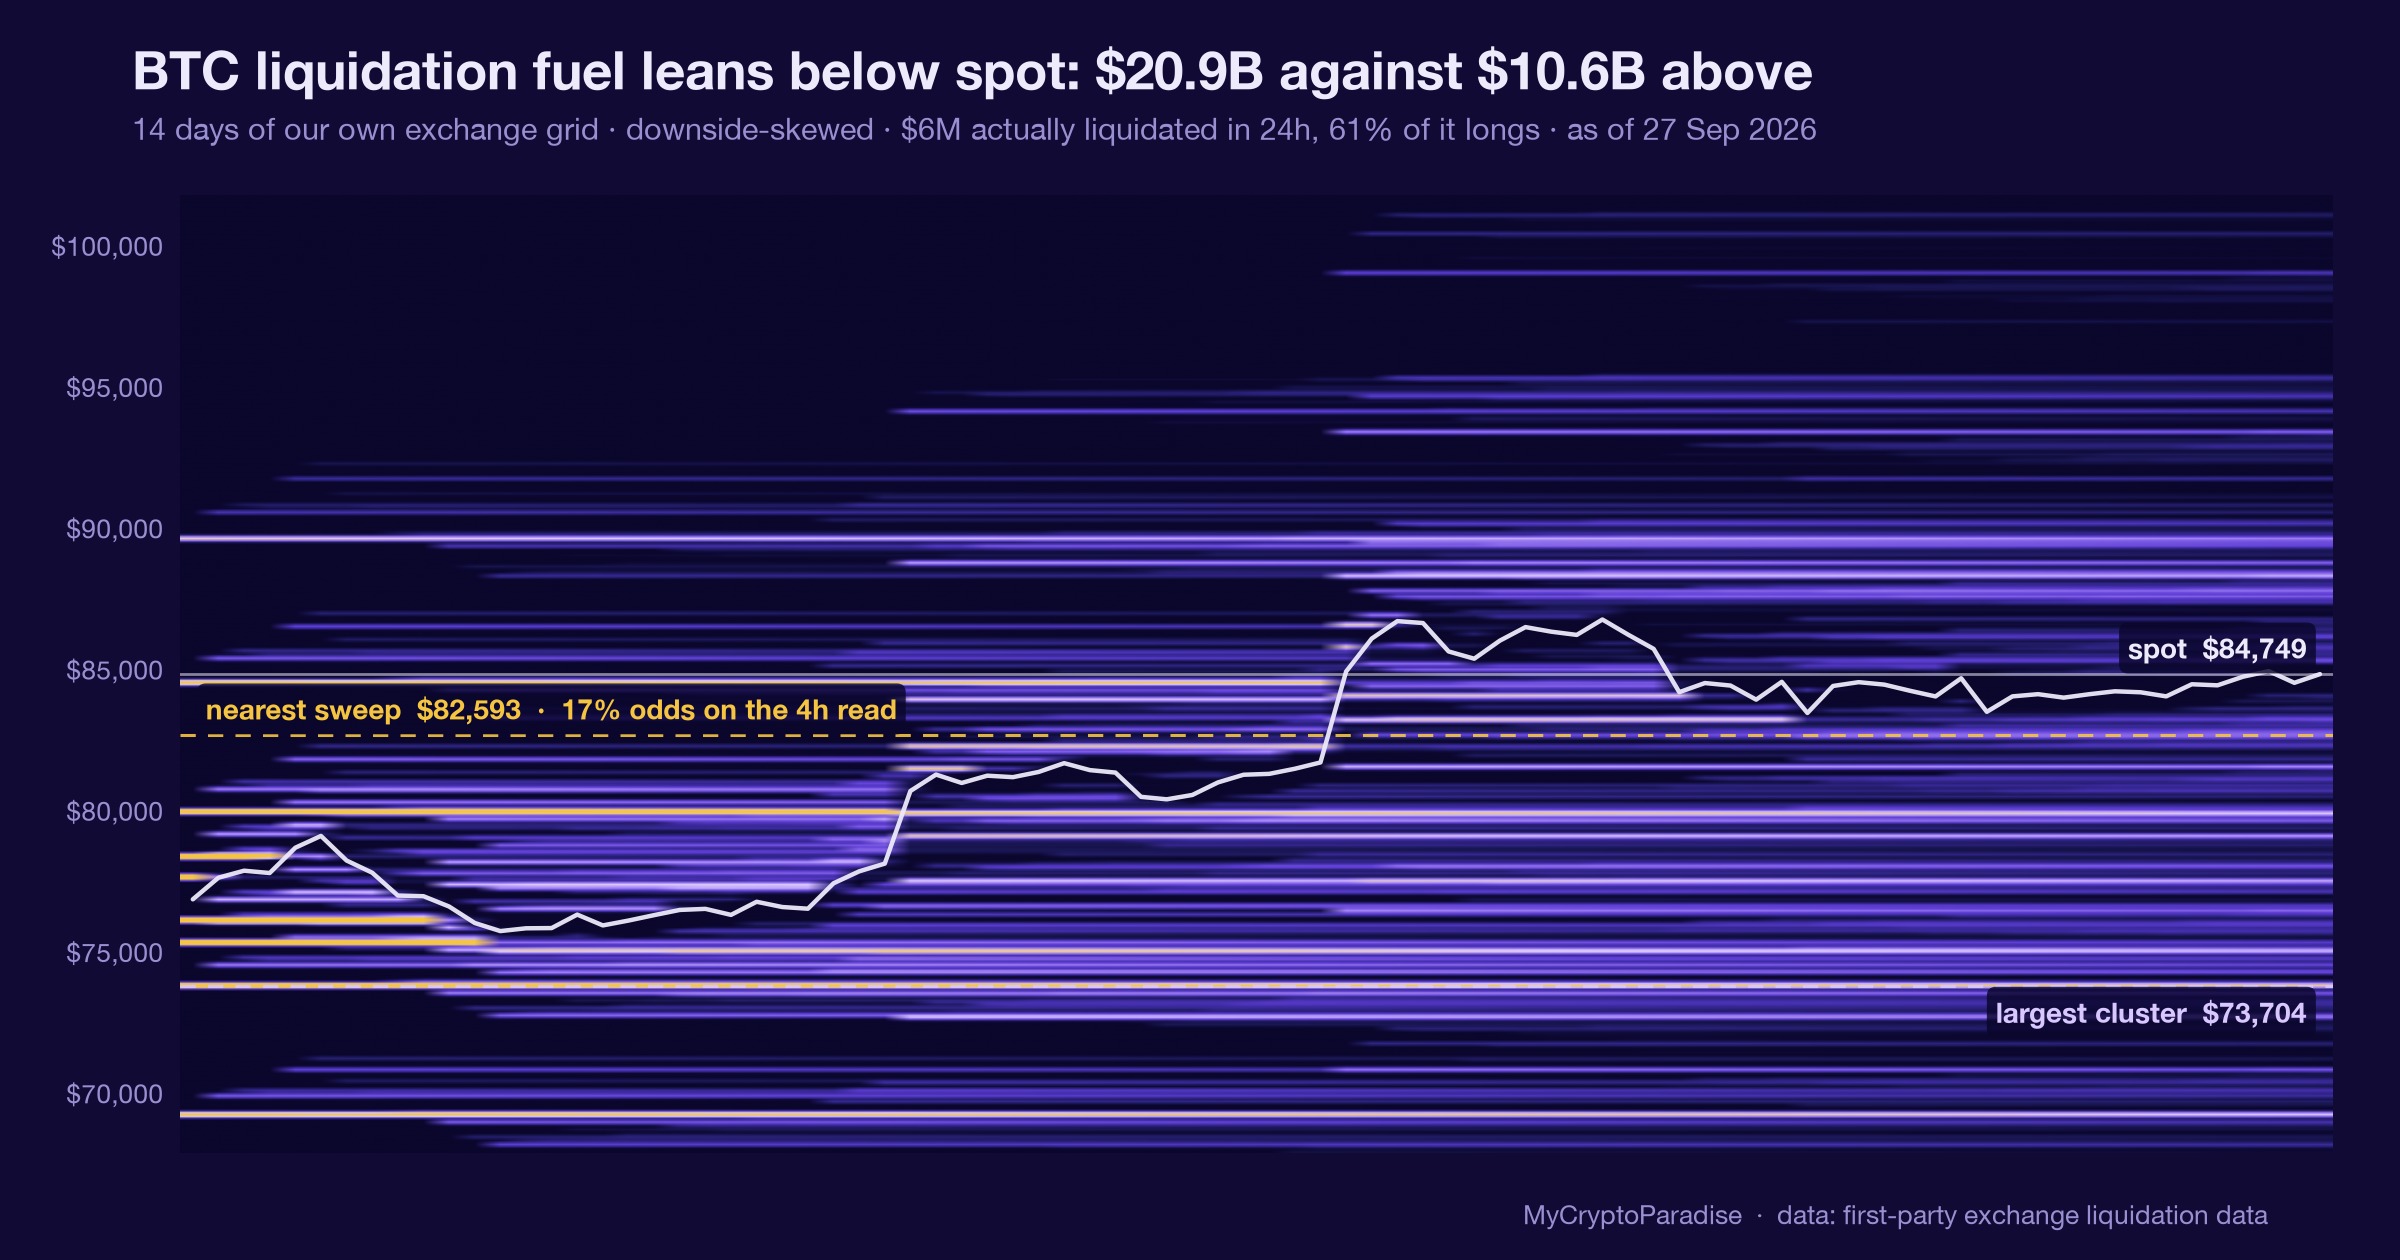
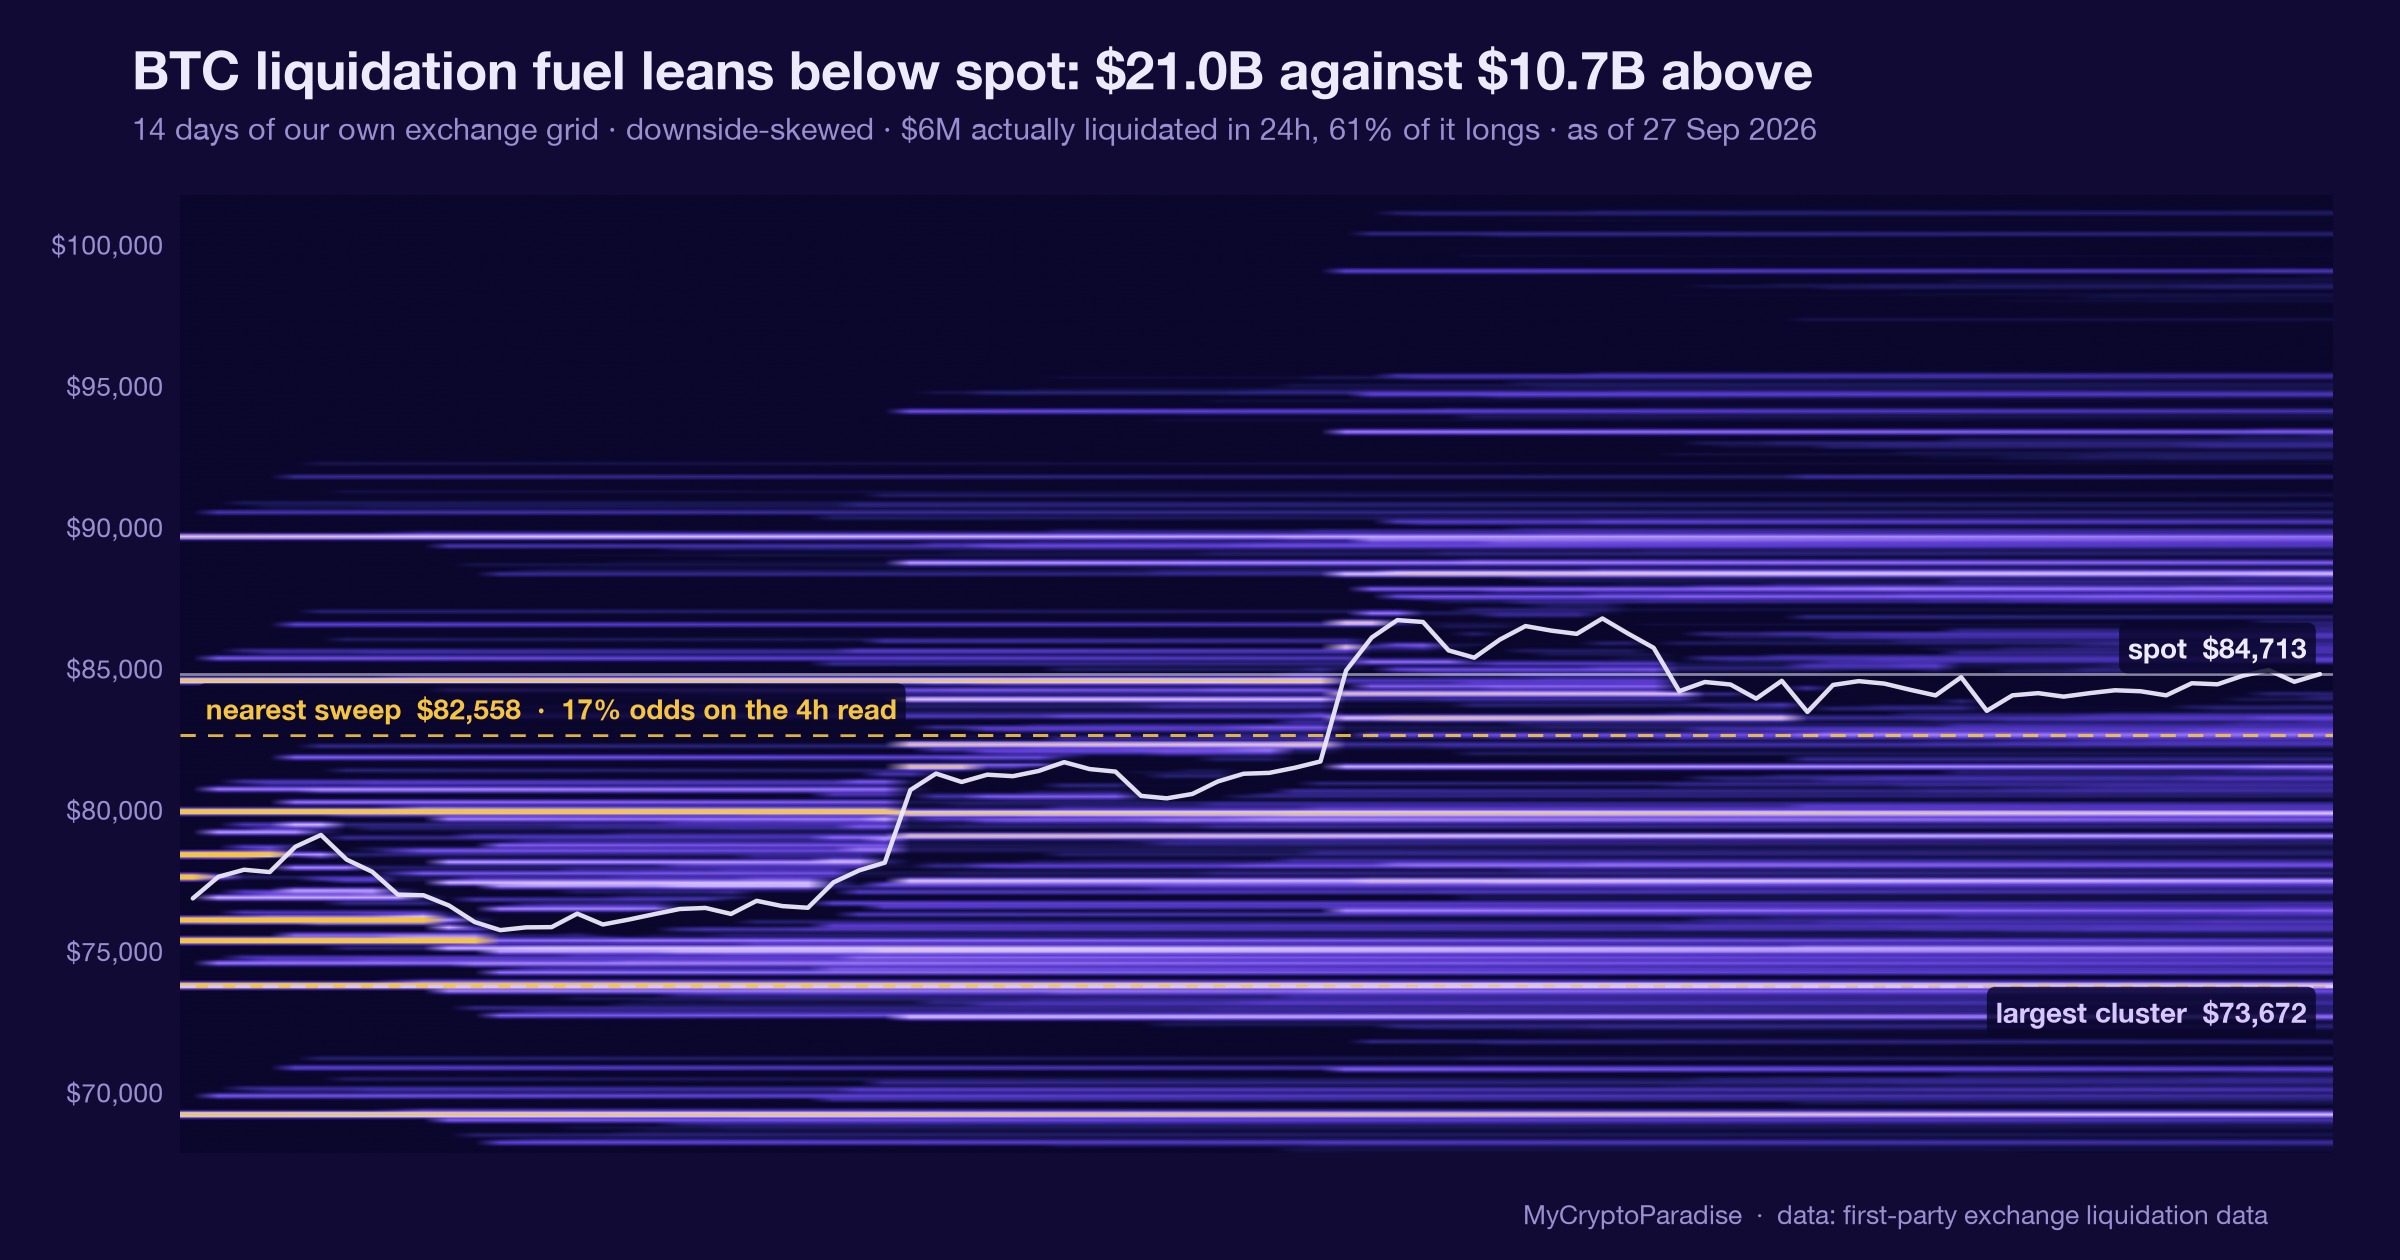
Track it live: our live crypto funding rates and the crypto liquidation heatmap both update in real time, so you can watch this shift for yourself.
Related coverage
For exact entries, targets, and stop losses with full risk management, that is what ParadiseFamilyVIP is for. New to reading these moves? Start with our crypto trading strategies guide.
ParadiseTeam is monitoring the market situation closely, and we are taking these developments into consideration while building our trading tactics inside ParadiseFamilyVIP.
Crypto trading involves substantial risk. Prices are volatile and you can lose money. This article is educational and is not financial advice. Past performance does not guarantee future results.
Does BTC flush toward $60k first, or reclaim $67k before any deeper dip?
Follow this topic: Bitcoin ETF news












Join the discussion
No comments yet. Members, share how you are reading this.