


Listen: the breakdown
Market briefing: U.S. spot ETFs just pulled in $273 million, yet BTC sits near $64,212 and drifts lower on the day. When good news fails to lift price, someone is selling into the buyers.
- U.S. listed spot ETFs recorded $273M in fresh inflows.
- BTC trades near $64,212, down 0.6% on the day despite the bid.
- Price stalling on bullish news often marks smart money distribution, not fuel.
Source: U.S. SEC EDGAR
Spot ETF inflows just hit $273M, a clean bullish headline. So why did Bitcoin drift lower instead of ripping higher on the news?
U.S. listed spot ETFs recorded $273 million in fresh inflows. On paper, that is exactly the kind of institutional bid crypto traders wait for.
Yet Bitcoin sat near $64,212, down about 0.6% over 24 hours. Ethereum barely moved, holding around $1,866. The buyers showed up. The price did not follow.
That gap is the whole story. Inflows measure demand arriving through the traditional finance door. Price measures what happens after that demand meets everyone already positioned.
When a genuinely bullish figure lands and the tape shrugs, it tells you supply is meeting it quietly. Someone is happy to hand coins to the new money without moving the price up.
This is the eternal comedy of a bullish headline. Retail reads $273 million and reaches for the buy button, usually with leverage attached. The number feels like permission.
Structurally, steady ETF inflows remain a long-term positive. They bolt traditional capital onto the crypto rails and thicken the liquidity underneath every chart.
But a positive driver and a positive week are not the same thing. The immediate read here is not the inflow itself. It is the market's flat response to it.
That flat response, with fresh institutional money entering and price still slipping, is the detail worth sitting with before you chase the story.
Why steady inflows still meet quiet selling
The transmission from ETF inflows to price runs through liquidity, not sentiment. That distinction matters this week.
Inflows create a persistent, mechanical bid. Each dollar into a spot ETF must be matched by real Bitcoin bought and held. That is genuine structural demand.
But demand only lifts price when supply is scarce at current levels. Right now, supply appears willing. Coins are available near $64,000 without a fight.
That willingness is the tell. Someone is meeting a strong institutional bid without needing higher prices to sell. In market structure terms, that looks like absorption.
Absorption is smart money taking the other side of enthusiastic buying and parking size against it. The inflow is real, the adoption is real, and the price still stalls.
The macro logic stays bullish over months. More traditional capital enters, liquidity deepens, and the asset class matures. None of that is in doubt.
The near-term logic is different. A market that cannot rally on good news is telling you the marginal buyer is already leaning long and leveraged.
That is the setup for pain, not for continuation. When new money arrives and price refuses to reward it, the imbalance usually resolves lower first, flushing crowded longs before any sustained leg higher.
How the stall flows into BTC ETH and alts
Start with Bitcoin, because everything downstream keys off it. BTC near $64,212 is slipping while inflows rise, a divergence that rarely favors chasers.
If smart money is absorbing here, the mechanical next step is a shakeout. Crowded longs sit stacked just below price, and their stops are liquidity.
A move down into the $63,600 to $63,200 zone would tap the nearest cluster of pain. A deeper flush toward $60,000 to $59,000 would clear the rest.
That is not a forecast of collapse. It is how leverage gets reset before a trend can continue with fewer passengers.
Ethereum inherits Bitcoin's tape almost one for one. At roughly $1,866 and flat on the day, ETH shows no independent strength to buck a BTC squeeze.
If BTC hunts stops, ETH follows, usually a touch harder because its bid is thinner. A Bitcoin flush drags it down by correlation, not by any fresh ETH news.
Altcoins amplify the whole move. They rally more when BTC runs and bleed faster when BTC dips, because their liquidity is shallowest.
So the honest map is this. A bullish inflow headline can still precede a broad, short-term drawdown across BTC, ETH, and alts if the market uses the good news to trap the late longs.
What confirms the squeeze versus a real breakout
The cleanest confirmation is behavioral. Watch whether Bitcoin keeps failing to rally on obviously good news like these inflows.
A market that cannot go up on a $273 million bid is a market with a supply problem near current price. Continued heaviness confirms the absorption read.
Watch funding rates and open interest together. If OI (open interest, the total value of live futures contracts) climbs while price stalls, longs are crowding into a wall.
Rising funding alongside a flat tape means traders are paying up to stay long into resistance. That is fuel for a squeeze, not for a breakout.
On the downside, a sweep of $63,600 to $63,200 that snaps back quickly would confirm a stop hunt rather than a trend change. Reclaiming price fast is the tell.
A deeper tap of $60,000 to $59,000 that holds and reverses would be the higher-probability reset. That zone is where the crowded longs finally give up.
Invalidation of the squeeze thesis is equally clear. If BTC reclaims $64,900 and then $67,000 with real volume and cooling funding, the absorption read weakens.
Strength that comes with falling leverage, not rising leverage, is the honest bullish signal. Until then, treat every green candle on this news with the skepticism a stalling market has already earned.
What the flat tape signals for positioning
The ParadiseTeam reads this inflow through one question: why is price down on good news? At $64,212, BTC is trading near a decision zone, not a launchpad.
Our bias stays short-term cautious. The near-term picture points to one more long squeeze before any medium-term push higher, and this $273 million headline fits that script cleanly.
The mechanism is retail leverage meeting institutional supply. New buyers press long on the ETF number while size is quietly absorbed against them. That imbalance usually resolves lower first.
On levels, the ParadiseTeam is watching $63,600 to $63,200 as the immediate magnet for stops. A deeper flush into $60,000 to $59,000 would be the higher-probability reset zone.
Those are the levels where panicking retail typically sells, and where patient capital typically accumulates. This inflow does not change that map. It arguably reinforces it, because the bid failed to lift price.
Structurally, the medium-term picture is not bearish. A daily-timeframe bullish setup remains in play, with $67,000 and then $79,000 as levels of interest after a shakeout.
So the honest framing is sequencing, not direction forever. Near term, the ParadiseTeam expects the market to trap the eager longs this headline invited.
Who benefits? Whoever waits. The inflow is bullish plumbing for later, but the immediate risk sits with anyone chasing the news with size.
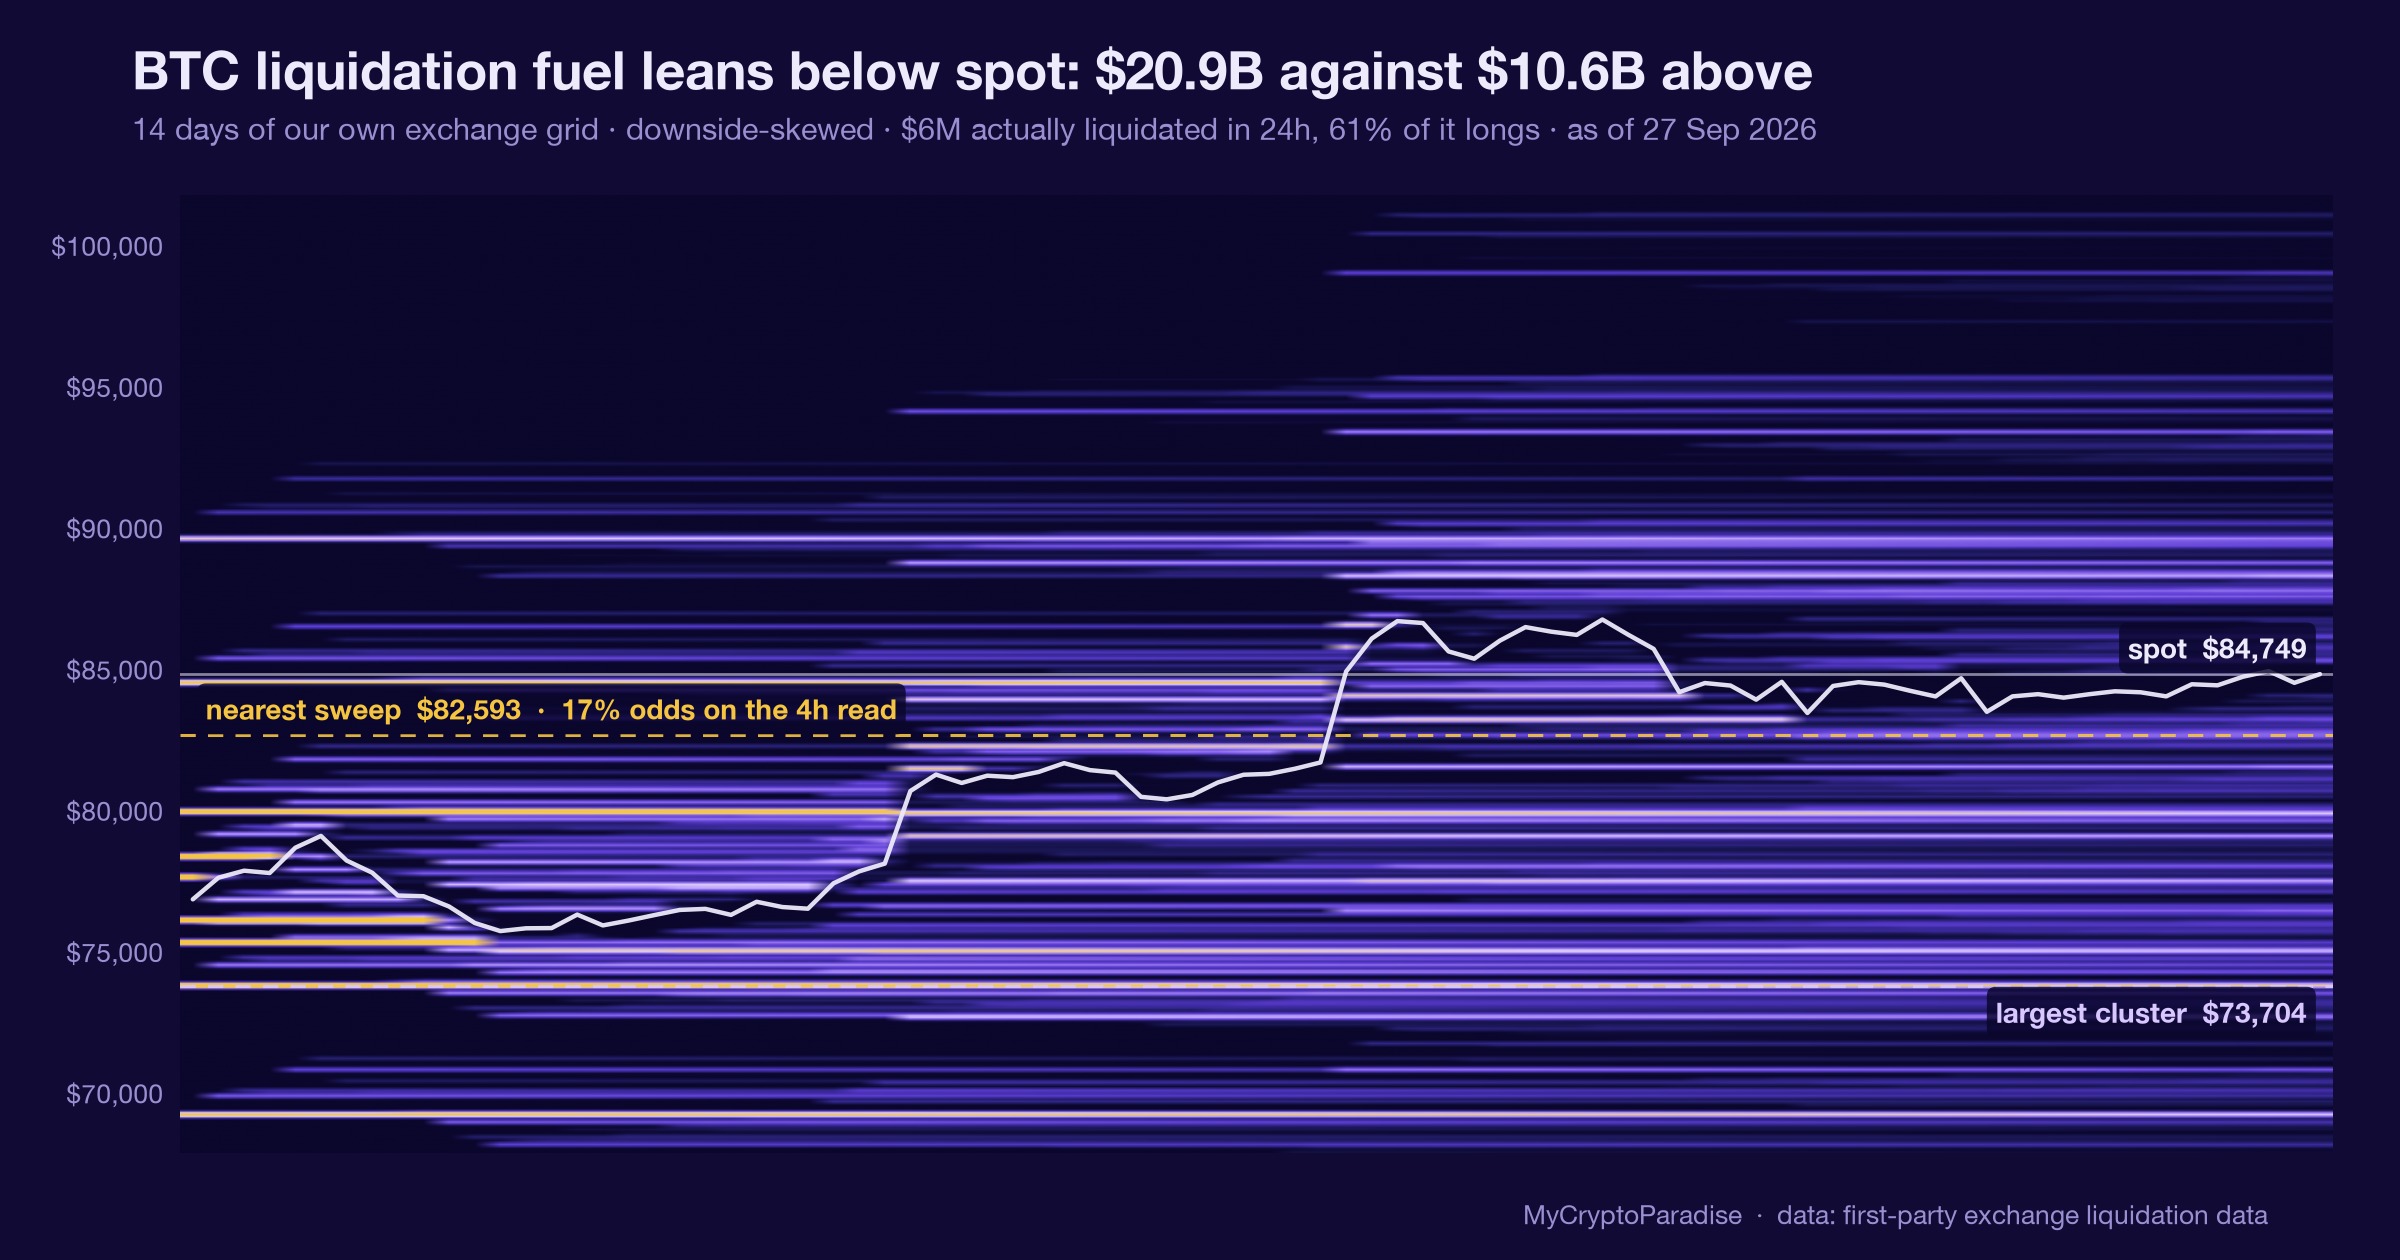
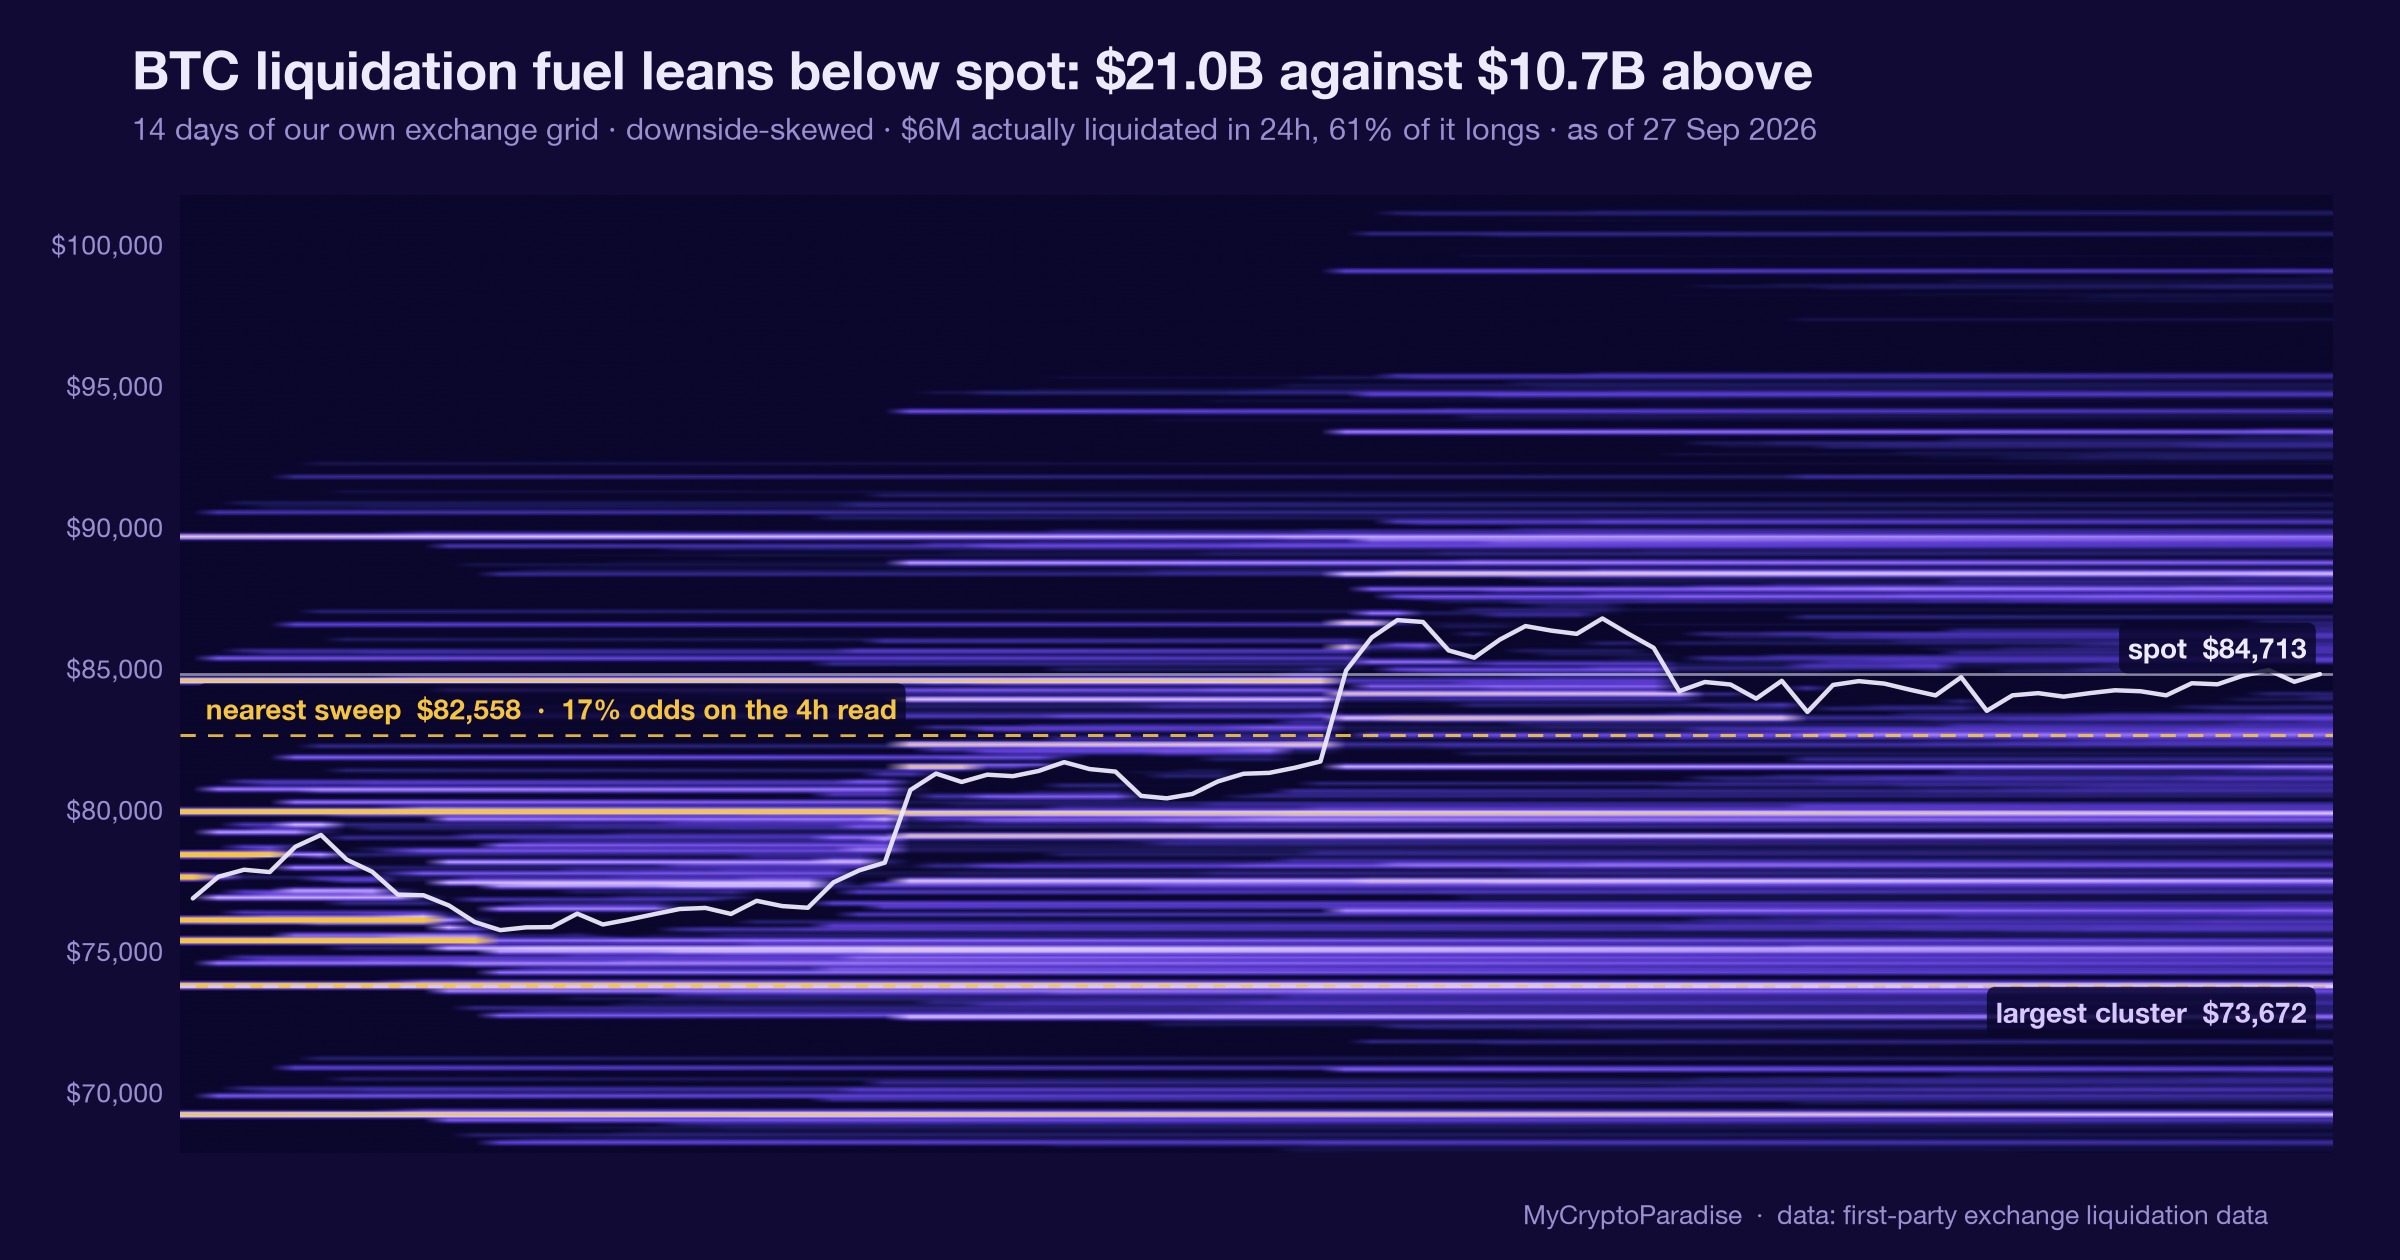
Track it live: our live crypto funding rates and the crypto liquidation heatmap both update in real time, so you can watch this shift for yourself.
Related coverage
For exact entries, targets, and stop losses with full risk management, that is what ParadiseFamilyVIP is for. New to reading these moves? Start with our crypto trading strategies guide.
ParadiseTeam is monitoring the market situation closely, and we are taking these developments into consideration while building our trading tactics inside ParadiseFamilyVIP.
Crypto trading involves substantial risk. Prices are volatile and you can lose money. This article is educational and is not financial advice. Past performance does not guarantee future results.












Join the discussion
No comments yet. Members, share how you are reading this.