


Listen: the breakdown
Developing story update (September 15, 2026, 05:54 UTC):
U.S. spot Bitcoin ETFs recorded $160 million in net inflows on Sept. 14, according to SoSoValue, with BlackRock’s IBIT contributing $134 million and accounting for most of the day’s inflows. Spot Ether ETFs also posted $121 million in net inflows, led by BlackRock’s ETHA with $80.50 million.
Market briefing: Spot Bitcoin ETFs pulled $160 million on Monday, breaking a four-day outflow streak, while ether ETFs added $121 million. Yet Bitcoin held near $77,569 and barely moved, so we read the inflow as fuel for a bounce, not a trend change.
- Spot Bitcoin ETFs took $160 million in net inflows on Monday, September 14, ending four straight days of outflows.
- Those four sessions from September 8 to 11 had shed roughly $463 million, with BlackRock's fund leading Monday's turn at $134 million.
- Spot Ether ETFs added $121 million the same day, yet BTC held near $77,569 and ETH slipped under one percent.
Spot Bitcoin and ether ETF inflows returned on Monday after four days of outflows. But price barely moved as the money came back. Is this a real turn or a trap?
Spot Bitcoin ETFs took in $160 million on Monday. That single day broke a four-session losing streak. Over September 8 through 11, the same funds bled roughly $463 million. So Monday's inflow refills barely a third of what left.
Spot Ether ETFs joined the turn. They posted $121 million in net inflows on the same day. BlackRock's Bitcoin fund led the group with $134 million, its largest single-day intake of the run.
The monthly picture stays modest. As of Friday, September 12, Bitcoin ETFs held about $307.3 million in net inflows for September. One good day does not rebuild a trend.
Bitcoin traded near $77,569 as the inflows printed, almost flat on the day. Ether sat close to $2,493, down under one percent. Price did not celebrate the money coming in.
That gap matters. Money returned, but price did not follow with conviction. When fresh demand meets a flat tape, someone is selling into it. The question is who.
Retail spent last week leaving. The $463 million exit reads like fear, not strategy. Now a smaller crowd steps back in near the same levels where higher-timeframe supply has been sitting. That is the pattern we track most closely.
A small inflow against a bigger bleed
ETF flows are the cleanest read on institutional appetite we have. Each dollar in or out settles against spot Bitcoin. So the number is not sentiment, it is delivered demand or delivered supply.
Monday's $160 million is real buying. But context decides its weight. A single green day inside a $463 million weekly bleed is a pause, not a pivot. The plumbing refilled a little; it did not reverse.
Here is the transmission that matters. ETF inflows inject short-term liquidity into the market. That liquidity can lift price briefly and pull nervous buyers off the sidelines. Retail sees green and assumes the bottom is in.
Yet the macro conditions underneath have not changed. The weekly and daily structure still points lower on our read. A one-day flow does not rewrite a multi-week trend.
This is where the distance between a headline and the tape shows. The screen says money is coming back. The chart says price is barely moving. Those two facts rarely agree for long.
We treat this as a liquidity event, not a demand shift. Inflows give the market fuel for a short-term bounce. They do not remove the overhead supply sitting near recent distribution levels.
For traders, the lesson is simple. Do not read one inflow day as safety. Read it as fuel that can burn in either direction, depending on who controls the levels above.
Where fresh ETF money reaches BTC and alts
Bitcoin absorbs ETF flows first. These funds hold spot BTC, so demand and supply hit Bitcoin directly before anything else. Monday's $160 million touched BTC, then rippled outward.
The ripple was weak. Bitcoin held near $77,569 and moved almost nothing on the day. When fresh money fails to move price, sellers are meeting every bid. That is the tell.
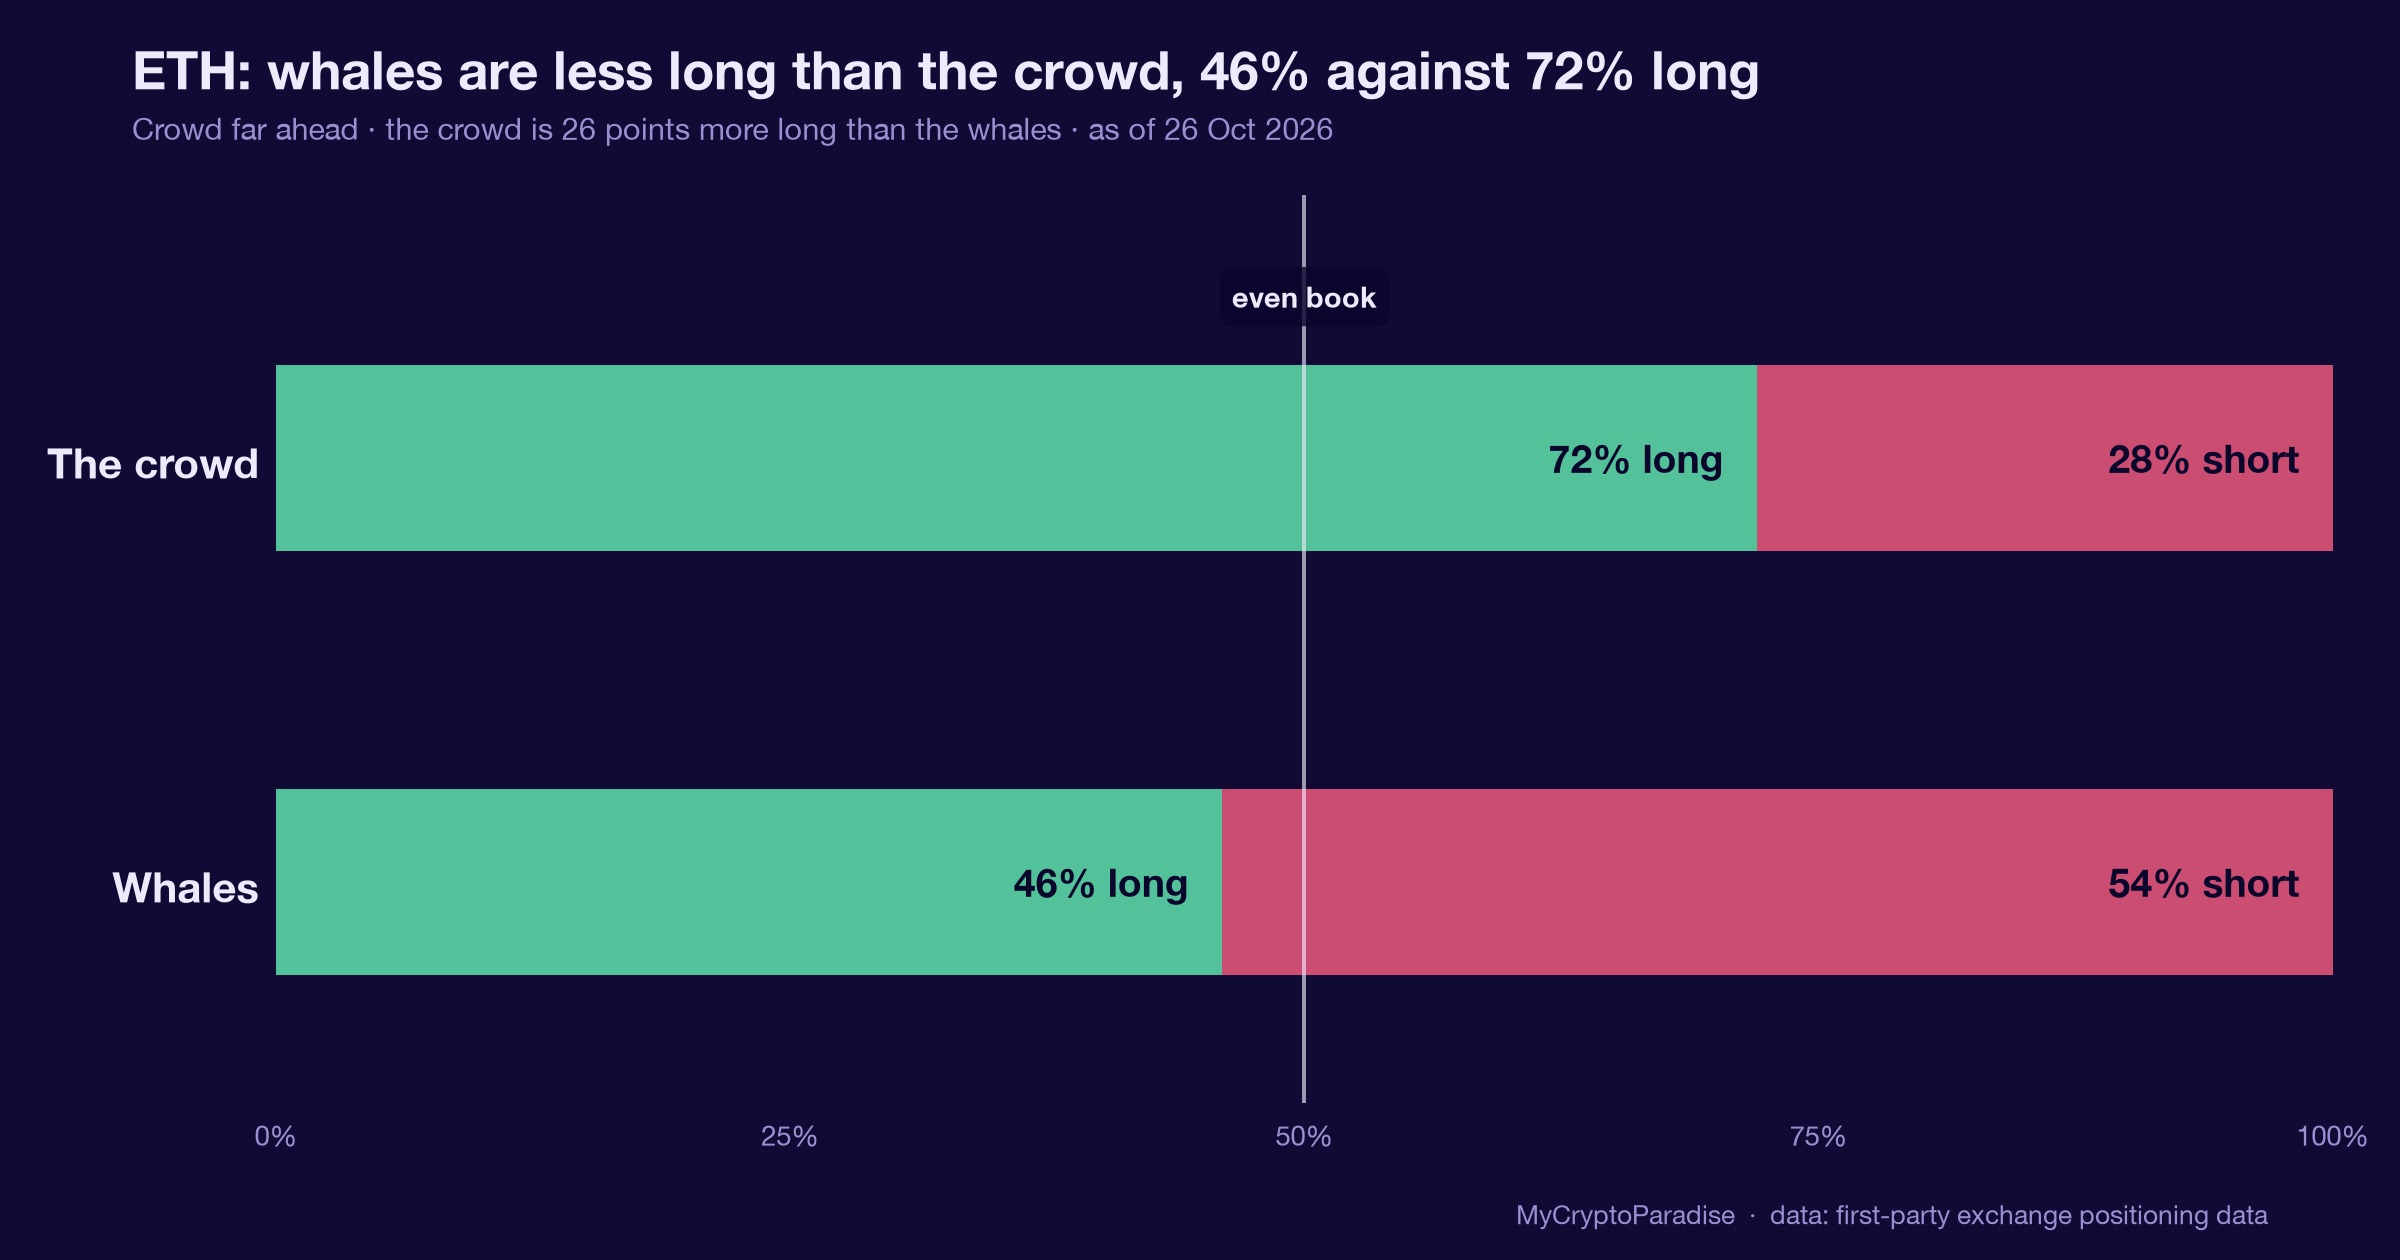
Ether came next in line. Spot Ether ETFs pulled $121 million, yet ETH still slipped under one percent to about $2,493. A green flow day paired with a red price day is a warning, not a green light.
Alts sit at the tail of this chain. They need Bitcoin strength and healthy risk appetite to run. Neither is confirmed here. So any alt bounce on this news borrows time it may not keep.
Liquidity like this tends to concentrate near obvious levels. Buyers cluster where charts look safe. Those same clusters are where resting sell orders wait. Larger players know exactly where retail parks.
The cascade, then, is muted by design. A real inflow met a flat market, which means the supply overhead is doing its job. Money entered and simply changed hands.
We would want to see BTC push and hold above nearby resistance before trusting any downstream alt move. Until then, treat the bounce as fragile and exchange-dependent.
The daily candle that could break the bounce
The next daily candle carries the most weight. We are watching for a bearish engulfing pattern to form near current levels. That would confirm sellers still own the higher timeframe.
Confirmation of the bounce looks different. Bitcoin would need to reclaim the $82,000 to $88,000 resistance zone and hold it as support. That flip, on the weekly, would force us to rethink the bearish structure.
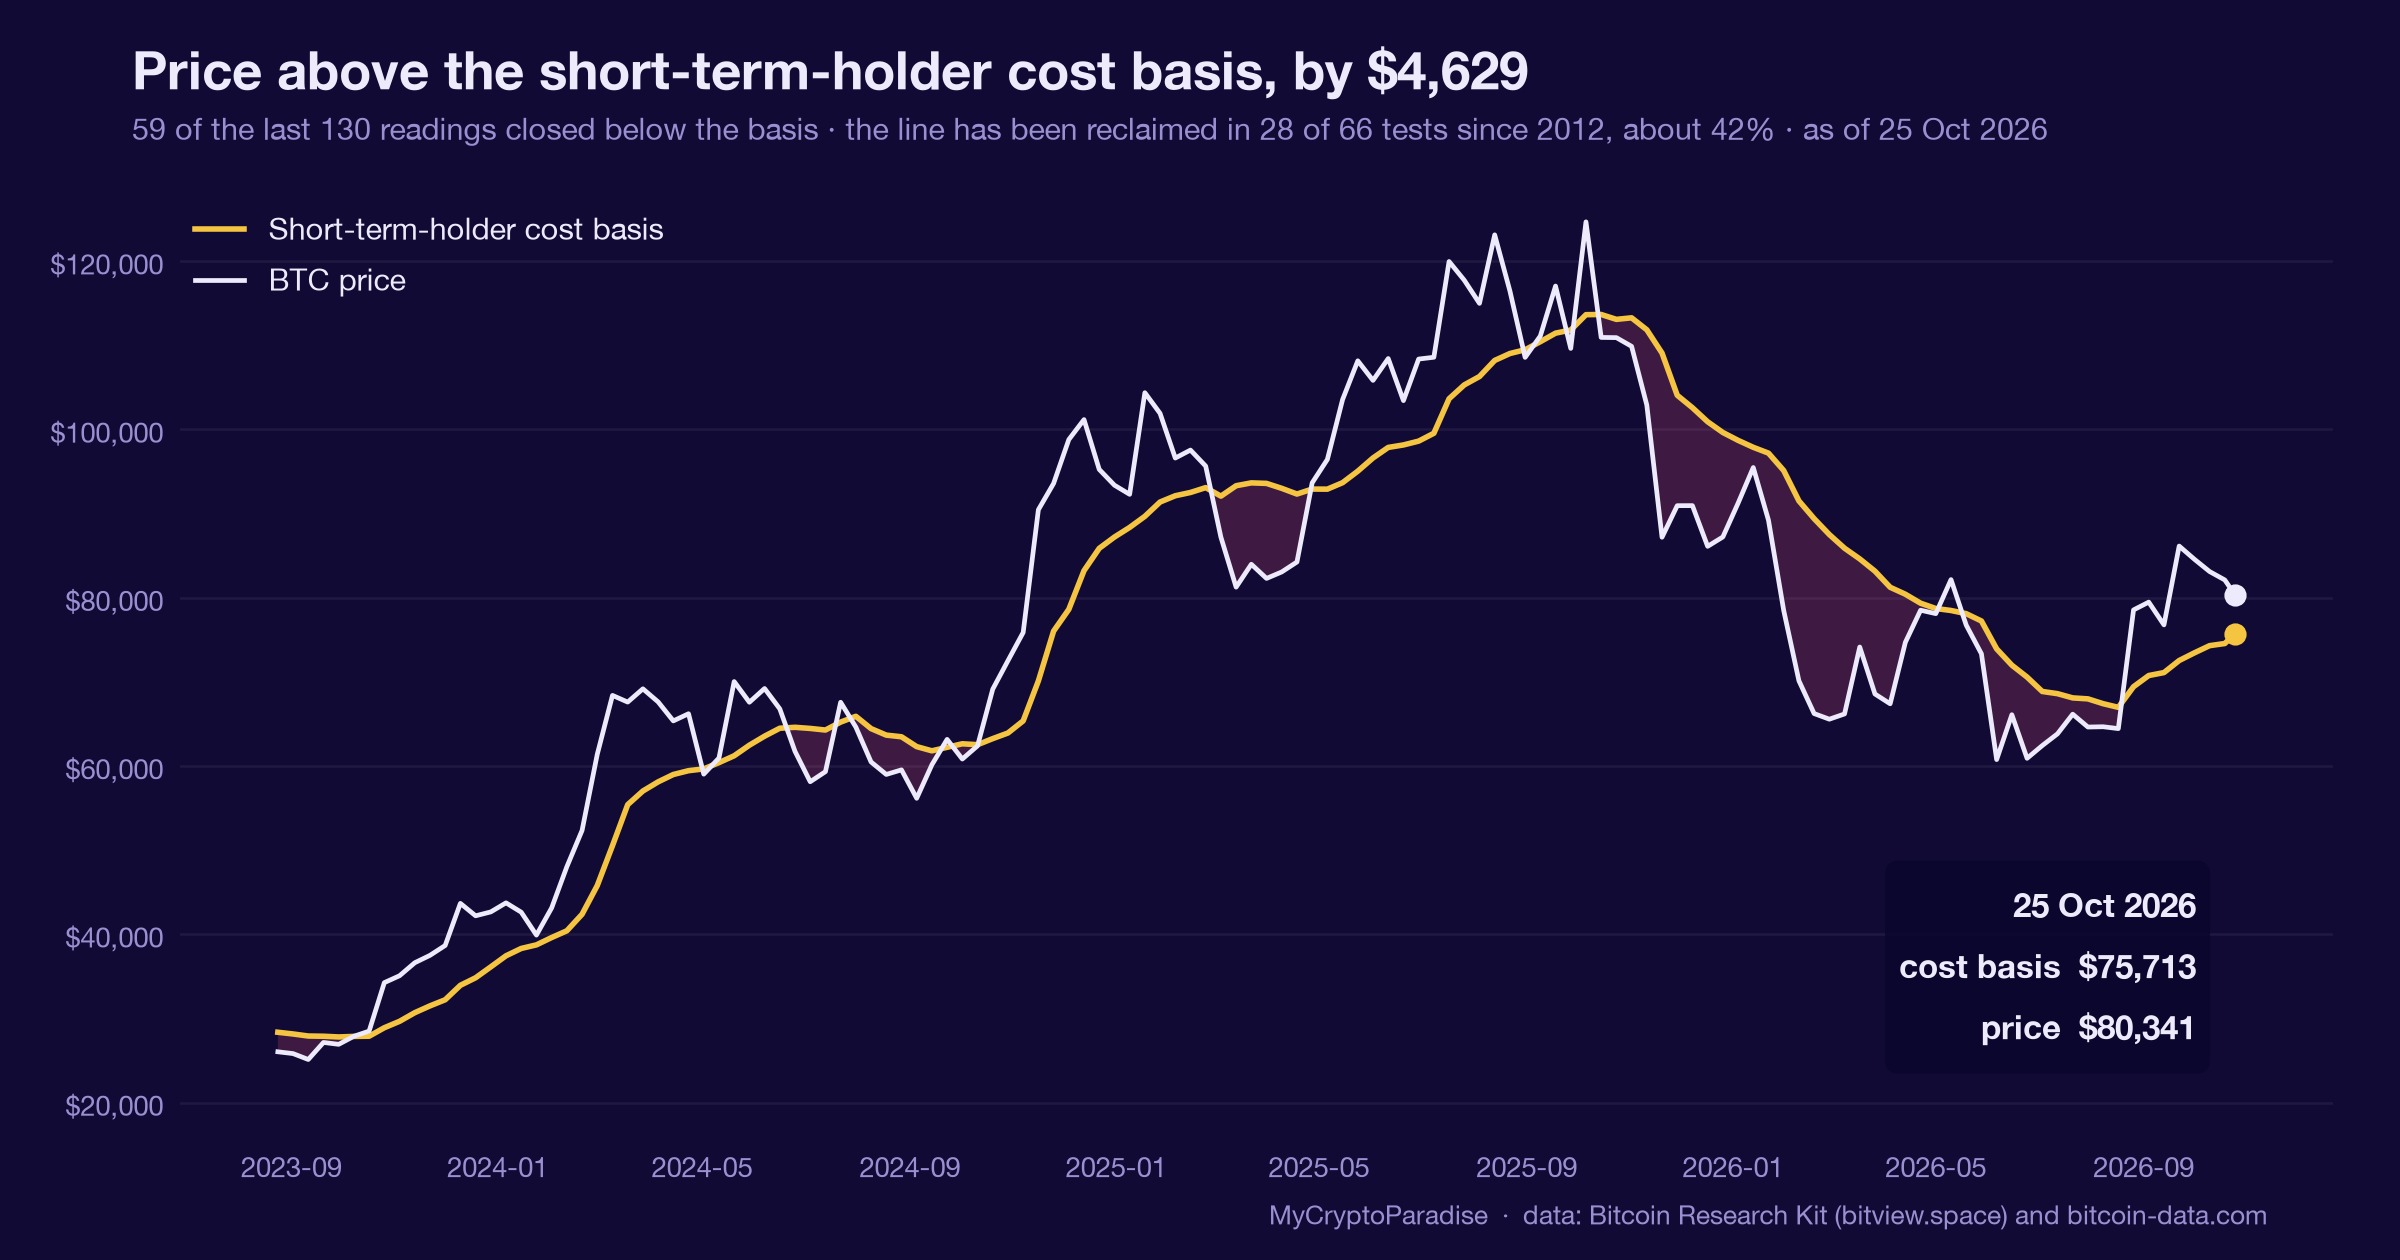
Short of that, watch $79,000. It marks a prior distribution zone and the 0.618 Fibonacci retracement level, which is where a common bounce often stalls. Price rejecting there keeps the bearish case intact.
On the downside, $76,000 is the reclaim target if a bearish engulfing confirms. Losing it cleanly points toward the $61,000 and $58,000 supports we have flagged for weeks.
Flows themselves are a second signal. If inflows continue for several sessions and outpace the recent $463 million exit, the demand story strengthens. One day does not; a full week might.
Divergence is the quiet tell. Recent daily candles printed shooting star shapes, small bodies with long upper wicks. Those mark supply overwhelming demand at the highs.
Invalidation is honest and clear. A clean weekly reclaim above resistance ends our bearish read. Until price proves that, we treat this inflow day as a bounce inside a larger downtrend, not the start of a new leg up.
Renewed inflows read against the $79k zone
$160 million arriving while price stays flat is exactly what the ParadiseTeam expected near these levels. Inflows returned, but they landed under the $79,000 distribution zone, not above it.
The ParadiseTeam reads this as a liquidity injection feeding a possible final short-term bounce. Larger players distributed heavily near $79,000 and are now waiting for confirmation. Renewed retail buying simply gives that distribution more demand to sell into.
With BTC near $77,569, the room to the $79,000 rejection zone is thin. A push toward the 0.786 Fibonacci retracement level would fit a final bounce before the higher timeframe resolves lower.
Who benefits here matters. Retail that fled last week and now chases green risks buying into overhead supply. Money that sold higher gets a second window near resistance.
Stops tell the story. Late longs will place stop-loss orders (SL) just under recent lows. That pool below invites a flush if $76,000 fails to hold on a reclaim attempt.
The ParadiseTeam would trust a bullish shift only on a clean weekly reclaim of the $82,000 to $88,000 band. Absent that, this inflow is fuel for a bounce, not proof of a bottom.
Risk-to-reward (R:R) favors patience. The stronger edge sits lower, near the $61,000 reaccumulation zone the ParadiseTeam has flagged, not at resistance on a single day of flows.
The read behind this: we framed this story through our own market analysis, Bitcoin ETF Outflows Near $500M: Crash Next?
Track it live: our live crypto funding rates and the crypto liquidation heatmap both update in real time, so you can watch this shift for yourself.
Related coverage
For exact entries, targets, and stop losses with full risk management, that is what ParadiseFamilyVIP is for. New to reading these moves? Start with our crypto trading strategies guide.
ParadiseTeam is monitoring the market situation closely, and we are taking these developments into consideration while building our trading tactics inside ParadiseFamilyVIP.
Crypto trading involves substantial risk. Prices are volatile and you can lose money. This article is educational and is not financial advice. Past performance does not guarantee future results.
Is Monday's ETF inflow a real turn or a final bounce before lower?
How 23 Paradisers are calling it
The first call is still open
Free account, no password. Members just sign in.
Follow this topic: Ethereum ETF news












Join the discussion
No comments yet. Members, share how you are reading this.