

Listen: the breakdown
Developing story update (September 14, 2026, 23:42 UTC):
Our latest check confirms the US 10-year Treasury yield, after hitting an intraday high of 5.012% on Monday, ultimately closed the day at 4.96%. This slight pullback from the peak indicates some stabilization, but the overall elevated level remains a key macro indicator.
The context of rising oil prices continues to fuel inflation concerns, maintaining pressure on traditional markets and, by extension, risk assets like crypto. This sustained high yield environment reinforces the attractiveness of safer investments.
For crypto traders, this means the macro headwind persists. While Bitcoin and Ethereum show minor short-term gains, the underlying pressure from high yields suggests caution is warranted, aligning with our long-term bearish outlook.
What to watch now: Monitor for continued volatility in Treasury yields and their impact on risk asset sentiment ahead of the Federal Reserve's rate decision.
Developing story update (September 14, 2026, 23:19 UTC):
Market participants should note that diesel prices have now reached an all-time high. This development further intensifies the inflation concerns previously highlighted by rising Brent crude prices.
This additional inflationary pressure could reinforce the Federal Reserve’s hawkish stance, potentially impacting future rate decisions and the broader risk asset landscape, including crypto.
What to watch now: Monitor the impact of sustained high energy prices, particularly diesel, on broader inflation metrics and the Federal Reserve's upcoming statements.
Developing story update (September 14, 2026, 21:53 UTC):
Our latest check confirms the U.S. 10-year Treasury yield peaked at 5.012% on Monday, maintaining its highest intraday level since 2007. This persistent pressure on yields is now explicitly linked to a hot inflation report released last Friday, which further solidified market expectations for a Federal Reserve rate hike.
The probability of a Fed rate hike this Wednesday remains high at 88%, driven by these inflation concerns. While the 10-year yield briefly touched 5% in 2023, the current sustained breach reinforces the tightening financial conditions.
For crypto traders, this macro backdrop continues to signal headwinds. Higher yields and persistent inflation concerns increase the cost of capital, potentially diverting liquidity from speculative assets like Bitcoin and Ethereum. Monitor the Fed’s decision closely for further market direction.
What to watch now: The Federal Reserve's rate decision on Wednesday, especially in light of the recent inflation report.
Developing story update (September 14, 2026, 21:29 UTC):
Our sources confirm that the U.S. 10-year Treasury yield, which recently hit 5.012%, serves as a crucial benchmark for various financial instruments including mortgages, corporate bonds, and other loans.
This means the 5% level is not just a historical high, but a critical threshold for the broader U.S. economy and financial markets, amplifying the impact of the current macro environment.
Traders should note this reinforces the significance of rising capital costs and potential headwinds for risk assets, aligning with a cautious outlook.
What to watch now: Monitor how the benchmark 10-year yield impacts lending rates and broader market liquidity.
Developing story update (September 14, 2026, 20:46 UTC):
Our latest check confirms that inflation concerns are intensifying, with diesel prices now reaching an all-time high. This development further fuels the narrative of rising costs impacting the broader economy.
Market expectations for a Federal Reserve rate hike have also solidified, with probabilities now at 88%. This increased likelihood of tighter monetary policy could continue to weigh on risk assets, including cryptocurrencies, as traditional yields become more attractive.
What to watch now: Traders should closely monitor the Federal Reserve's upcoming rate decision for further market direction.
Developing story update (September 14, 2026, 19:20 UTC):
The U.S. 10-year Treasury yield, which hit 5.012% on Monday, not only marked its highest intraday level since 2007 but also surpassed its peak from October 2023. This additional context underscores the sustained upward pressure on yields.
For traders, this reinforces the bearish long-term macro outlook, as higher yields increase the cost of capital and reduce the relative attractiveness of speculative assets like crypto. While short-term crypto price action may vary, the continued strength in Treasury yields suggests underlying headwinds for risk assets.
What to watch now: Traders should continue to monitor the Federal Reserve's stance on interest rates and any further developments in oil prices and bond market sentiment.
Developing story update (September 14, 2026, 18:34 UTC):
The U.S. 10-year Treasury yield’s recent surge to 5.012% on Monday, the highest intraday level since 2007, gains further context. Our sources confirm the yield briefly touched the 5% mark in 2023, indicating this critical level has been tested before.
This benchmark rate’s movement is crucial for traders, as it directly influences a broad spectrum of other interest rates, including mortgages, corporate bonds, and various loans. Its sustained elevation signals tightening liquidity across the financial system, a key factor for risk asset valuations.
What to watch now: Monitor the 10-year Treasury yield's sustained levels above 5% and its impact on broader lending rates and risk asset valuations.
Developing story update (September 14, 2026, 17:52 UTC):
Update: the oil move behind this bond selloff now has a specific driver. Based on our sources, the surge in crude followed the closure of a Saudi pipeline, adding a supply-side leg to the inflation story that pushed the 10-year yield to its highest intraday level since 2007.
The 10-year yield has since pulled back after touching the 5% threshold, an early sign that the initial spike may have been partly a knee-jerk reaction rather than a clean repricing. Traders should watch whether yields hold below 5% or retest it, since that level remains the reference point for risk appetite across crypto and equities into the Federal Reserve decision.
What to watch now: Whether the 10-year yield holds below 5% or retests it, and if the Saudi pipeline stays closed.
Market briefing: The U.S. 10-year Treasury yield touched 5.012% on Monday, its highest intraday level since 2007, as an oil surge revived inflation fears. Bitcoin still edged up near $78,749, but tighter money rarely rewards risk for long.
- The U.S. 10-year Treasury yield hit an intraday 5.012% on Monday, its highest since 2007.
- An oil surge, with Brent near $110 a barrel, revived inflation fears and fed a bond sell-off.
- BTC held green near $78,749 and ETH near $2,525, yet the price sits inside a distribution zone.
Source: U.S. Department of the Treasury
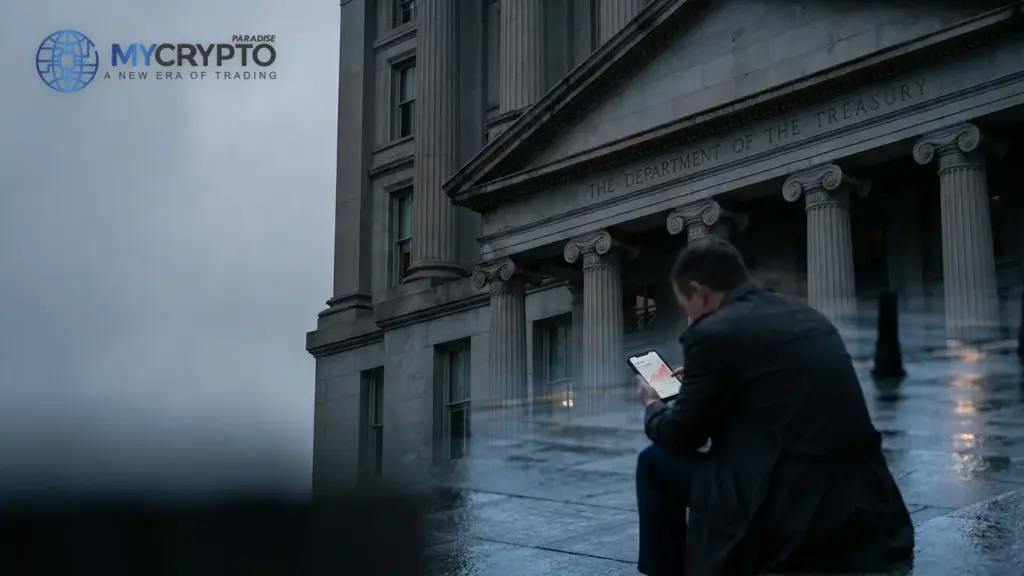
The 10-year Treasury yield just touched 5.012%, its highest since 2007. Tighter money usually starves risk assets. So why is Bitcoin still ticking green near $79,000?
The U.S. 10-year Treasury yield climbed to an intraday 5.012% on Monday. That is its highest level since 2007 by one measure, or since October 2023 by another. Either way, the message is the same: the cost of money is rising fast, and the bond market is not being quiet about it.
The trigger was oil. Brent crude at one point approached $110 a barrel, and that revived the one fear central banks least want back on the table: inflation. Higher energy prices feed into everything, so investors kept selling bonds and pushing yields up.
That matters far beyond the bond pit. The 10-year yield is the benchmark that prices mortgages, corporate debt, and a long list of loans across the economy. When it rises, borrowing gets more expensive everywhere at once.
Markets are now positioning for the Federal Reserve to raise interest rates again. A hike is increasingly priced in, which tells you the crowd expects the squeeze to continue rather than ease. And yet crypto looked calm. Bitcoin traded near $78,749, up about 1.9% on the day, with Ethereum near $2,525. A green tape into a macro headwind is the kind of thing that feels reassuring and rarely is.
Higher borrowing costs squeeze speculative money
A 5.012% 10-year yield reprices the entire cost of capital. When the risk-free benchmark pays more, every riskier asset has to compete harder for the same dollar. Crypto sits at the far end of that risk curve, so it feels the pull first.
The transmission runs through liquidity. Rising yields pull capital toward bonds and cash, where the return now looks respectable. Speculative assets rely on excess liquidity sloshing around looking for a home. Tighten that flow, and the marginal buyer of BTC and ETH thins out.
Inflation is the accelerant here. The oil surge told markets the disinflation story is not finished, which is exactly the setup that keeps the Federal Reserve hawkish. A priced-in rate hike reinforces the same message from a second direction.
This is why the move deserves attention even on a green crypto day. The driver is not a crypto-specific event. It is the plumbing of global finance getting more expensive, and that plumbing sits underneath every risk trade.
History offers a dry reminder. Every cycle produces a chorus insisting crypto has decoupled from macro. Yields at multi-year highs tend to end that conversation quickly. The cost of money is the tide, and most assets swim in it whether they admit it or not.
Risk-off pressure hits BTC before alts
The liquidity cascade tends to move in a predictable order. Tighter conditions hit Bitcoin first because it is the deepest and most watched crypto market. When BTC wobbles under macro stress, everything downstream feels it.
Bitcoin near $78,749 is the reference point. A green print here looks constructive, but the level itself sits in a zone where sellers have been active. Strength into that kind of area is worth questioning, not celebrating.
Ethereum follows next. At around $2,525 and up only 0.7% on the day, ETH is lagging BTC's move rather than leading it. That relative weakness is the tell macro traders watch, because leadership usually fades from the top down when liquidity tightens.
Then come the alts. They are the highest-beta corner of the market, so they amplify both directions. If risk-off gathers pace, thin alt order books mean sharper drops and faster stop runs than the majors.
The uncomfortable part is timing. Bond yields can grind higher for weeks while crypto pretends not to notice, then reprice in a single session. A calm tape into rising yields is not proof of resilience. It is often just the lag before the cost of capital does its work, and that lag is where over-leveraged longs get comfortable.
Confirmation sits in the next daily candle
The cleanest confirmation of the bearish macro read is behavior at resistance. If Bitcoin stalls near $79,000 and rolls over, that fits a market distributing into strength while yields climb. A daily bearish engulfing candle after the recent shooting-star tops would harden that case considerably.
Invalidation looks different. A clear reclaim of the $82,000 to $88,000 zone as support would break the bearish structure and force a rethink. That would suggest crypto is genuinely shrugging off the yield shock rather than lagging it.
Watch the bond market as the leading input. If the 10-year yield keeps pressing higher and a Fed hike stays priced in, the macro headwind persists regardless of any short-term crypto bounce. A sharp reversal lower in yields would loosen the vice.
Oil is the upstream variable. Brent near $110 is what revived inflation fears in the first place. If crude cools, the inflation narrative softens and the pressure on yields can ease.
Inside crypto, keep an eye on whether the short-term bounce completes or extends. A push toward the 0.786 Fibonacci retracement, the level that measures how far price has retraced a prior move, would fit a final bounce before weakness. A decisive weekly close reclaiming higher levels would argue the opposite.
Distribution near resistance as yields climb
The ParadiseTeam reads this yield shock as macro confirmation of the higher-timeframe bearish view, not a reason to chase the green tape. BTC near $78,749 is pressing the $79,000 area, the same 0.618 Fibonacci retracement zone where selling has already appeared. Strength into that level, while the cost of capital rises, looks more like distribution into hopeful retail than fresh accumulation.
The structure supports caution. Recent shooting-star candles on the daily, especially one with a small body and a large wick, point to a market struggling higher. Confluence with a bearish engulfing candle would be a strong signal that the bounce is done.
On the ParadiseTeam map, $82,000 to $88,000 remains the strong resistance band that would need to flip to support before any bullish shift is credible. Until then, the bias stays down toward $76,000 as a reclaim target, with deeper reaccumulation interest sitting near $61,000.
Smart money has been distributing at these higher levels and waiting for more confirmations after redistributing near $79,000. Rising yields and a priced-in hike simply reinforce that patience.
None of this is certainty. It is probability. The ParadiseTeam treats the current move as a likely final bounce inside a tightening macro backdrop, and manages risk accordingly rather than assuming the green candle means the storm passed.
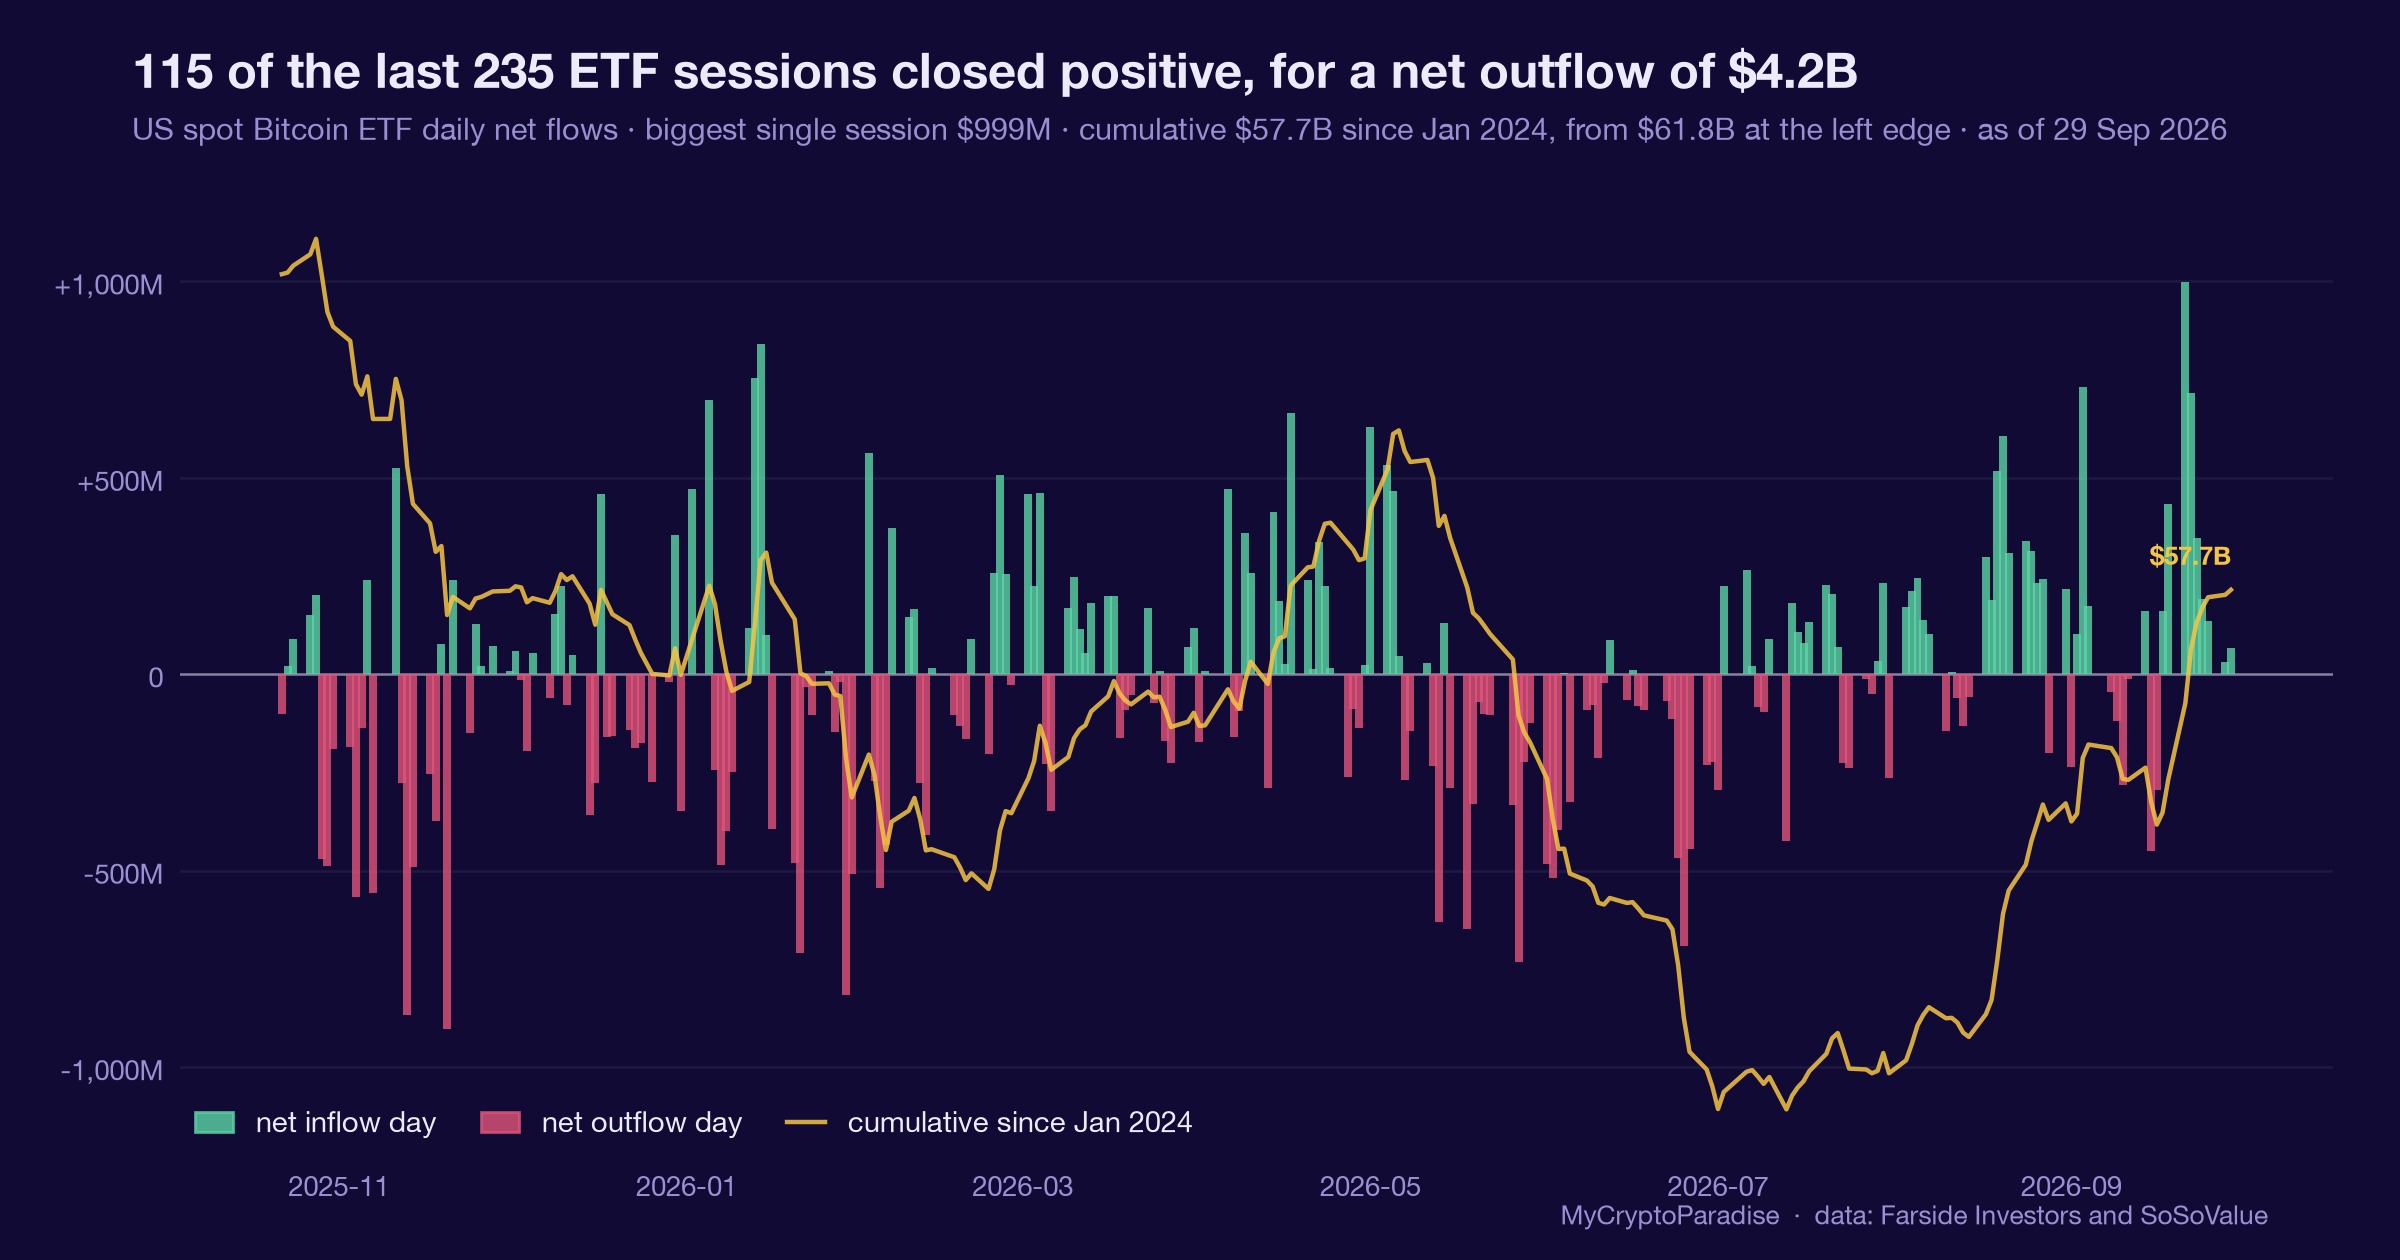
The read behind this: we framed this story through our own market analysis, Bitcoin ETF Outflows Near $500M: Crash Next?
Track it live: our live crypto funding rates and the Crypto Fear and Greed Index both update in real time, so you can watch this shift for yourself.
Related coverage
For exact entries, targets, and stop losses with full risk management, that is what ParadiseFamilyVIP is for. New to reading these moves? Start with our crypto trading strategies guide.
ParadiseTeam is monitoring the market situation closely, and we are taking these developments into consideration while building our trading tactics inside ParadiseFamilyVIP.
Crypto trading involves substantial risk. Prices are volatile and you can lose money. This article is educational and is not financial advice. Past performance does not guarantee future results.







Join the discussion
No comments yet. Members, share how you are reading this.