

In short: Simon says Bitcoin did not crash because Binance was hacked. Five months ago the ParadiseTeam mapped a move from $61,000 toward $79,000, then lower. Whales used the hack headline as exit liquidity after distributing near $121,000. Price found support around $64,000 with a bullish hammer, while the weekly bias stays bearish toward $44,000.
Why did Bitcoin really crash after the Binance hack?
Track it live: our live crypto funding rates updates in real time, so you can watch this shift for yourself.
According to Simon, the hack was a catalyst, not the cause. The ParadiseTeam projected the move from $61,000 to $79,000 and then lower about five months ago, long before any headline. News brings extra liquidity; it does not make the market.
Simon frames the market as a breathing organism and liquidity as its blood. Whales push news at liquidity pools to position against the crowd. The hack landed above the moving average trend line, right where retail buy orders sat, giving whales a distribution zone.
He compares the Binance event to the earlier Bybit and Coincheck hacks. Each struck near the same spot after a distribution period, and each time the bear trend resumed afterward.
What Bitcoin levels is the ParadiseTeam watching now?
Price is recovering above $64,000, the 0.786 Fibonacci level Simon calls the last important support. A bullish hammer candlestick formed there on the daily, and he notes the 0.618 at $69,000 gave no reaction on the way down.
Below sit $61,000 and the previous low at $58,000, with $44,000 marked as the major re-accumulation area. You can track these against the Bitcoin key levels page.
Above, Simon still points to his magical number at $79,000, the re-accumulation zones near $71,000, and the far macro target at $169,000 once re-accumulation completes.
How do whales use news and liquidity to move price?
Simon explains that whales are fewer than 20% of participants but control about 80% of the capital. They hunt liquidity so they can enter or exit without moving price against themselves.
He calls retail reactions emotional liquidity. An exciting headline on green candles creates buyers that let a whale sell into demand, which Simon labels exit liquidity. A frightening headline does the reverse for accumulation.
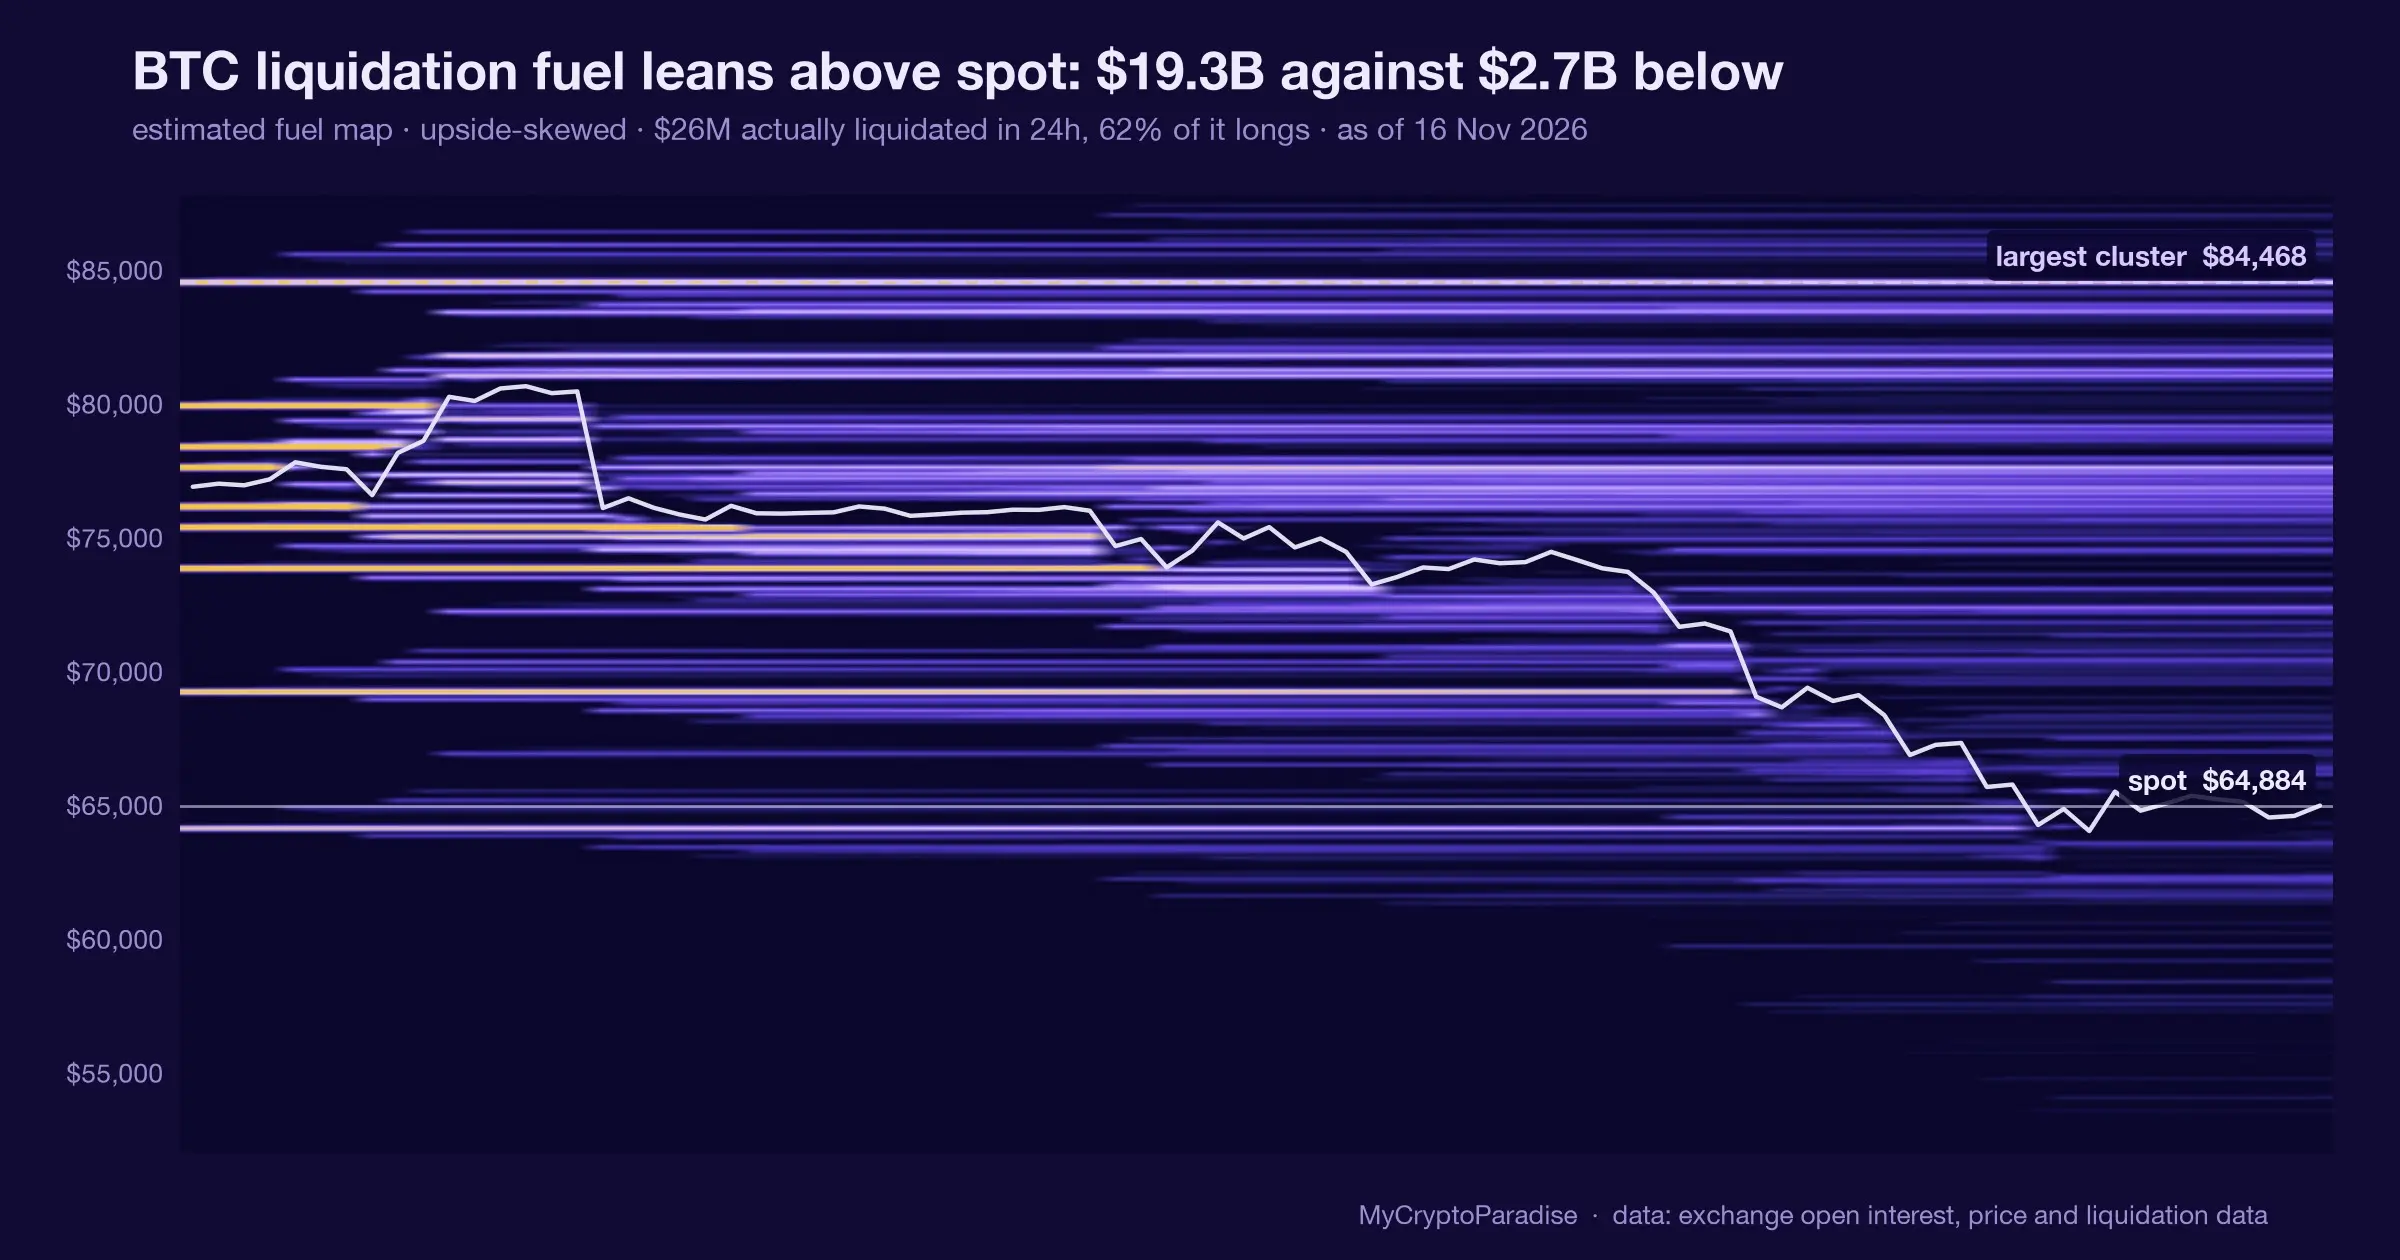
At the top, bullish influencer posts pushed retail into long positions. Market makers then drove below the liquidity pool, triggered liquidations, and that domino effect created the follow-through. See how positioning builds on the crypto funding board.
Is Simon still bearish on Bitcoin?
Yes, on the weaker time frames. Simon has called for $44,000 since $121,000 and still treats that area as the major re-accumulation zone before any new all-time high. The daily bounce does not change the larger structure.
He describes a recovery on a lower time frame sitting inside a larger decline. A rally and a later sell-off can belong to the same scenario across time frames.
The ParadiseTeam sits 80% USDT and 20% Bitcoin after distributing near $86,000 and $87,000. For context on sizing and risk, Simon leans on position sizing and capital preservation.
Frequently asked questions
Did the ParadiseTeam know Binance would be hacked?
No. Simon is clear there is no crystal ball and they did not know the hack would happen. The projection from $61,000 to $79,000 and lower was mapped five months earlier from price action, order flow and liquidity, not from predicting any specific headline or event.
What was Simon’s magical number for Bitcoin?
Simon’s magical number was $79,000. The ParadiseTeam re-accumulated at $61,000 and projected a push toward $79,000, then distributed there after confirmations that whales were selling. He treated the move above the previous high as corrective, driven by retail rather than real smart-money buying volume.
Where did Simon say Bitcoin found support?
Simon says Bitcoin found support around $64,000, the 0.786 Fibonacci level he called the last important support zone. Price printed a bullish hammer candlestick there with nice bullish volume and recovered above it, with support also retouched near $62,000 on lower time frames.
What is the ParadiseTeam’s next macro target?
Simon names $169,000 as the next macro target for the ParadiseTeam. However, he stresses it will not happen before a proper re-accumulation. On the weaker time frames he remains bearish and still calls for $44,000 as the major re-accumulation area first.
MyCryptoParadise has run a professional crypto signals and trading-education service since 2016, led by founder Simon Mach and the ParadiseTeam. Simon records these sessions three times a week, and every episode lands on the Bitcoin video analysis hub.
Video transcript
Auto-captioned from the video audio and lightly cleaned, so it can contain transcription errors; the video itself is the record. It is speech, not a written article; for the structured breakdown read the sections above.
If Bitcoin crashed because Binance got hacked, how is it possible that 5 months ago we already knew that Bitcoin with the highest probability would pump from $61,000 to around $79,000 and then crash again? We don't have a crystal ball, I tell you that, so how is the market really being moved?
Let's analyze. that are watching the first video of this week. We've pretty similar VIPs, we have closed our last Bitcoin short position. This was just a short -term swing trade. We have taken the last profit at $62,800 which was close to the low time frame bottom.
But as you can see, we are right now above that $64,000 that I have shown to you in the previous video, in the last one, right? right here, 64,000 dollars, that was the 0.786 Fibonacci choice meant level, that was the last important support zone given that the 0.618 at 69,000 dollars had no reaction whatsoever, so right now you can see we are already creating a bullish hammer candlestick pattern right here and
we are nicely recovering above it. This, however, is just from the daily time frame So we will be taking a look at it in a minute, but first we need to understand what's going on right now. We've put in a similar piece. We, as you know, we have been reaccumulating Bitcoin at 71, the last three accumulations at 71 and then 61,000 dollars, right?
This is the rotation that we are doing inside of our hard wallets between Bitcoin, USDT and PaxG, which is digital gold. And then, as you know, for a very long time, right? For a very long time, basically five months ago, we already had this kind of projection that from, we will dump to $61,000 and then we will start pushing towards $79,000 that was our magical number.
And then we will start pushing below the previous low. And as you can see, we are right now close to the previous low. The previous low was at $58,000. are we gonna dump below the previous low am I still in that bias that we will go towards 44,000 dollars before a new all -time high we will analyze that ladies and gentlemen but take a look at this so 79,000 dollars good hit
right here with parallelism VIPs we have used that after confirmations that the whales are already selling right to sell that portion that we have re -accumulated at $61,000 right so $79,000 but we have got one other quite aggressive re -accumulation at $79,000 and all of this buying back by the way is happening after we have been maxed out in Bitcoin only since 2023 right and as you know we have been we
have started we have wrote the whole bull trend and then we have started to distribute back to USDT if you are in these YouTube videos, you know, that here I'm doing this free market analysis for you, so I'm giving you often hints on what we are seeing in the market.
So at 109,000 dollars, however, even here on YouTube, I've been very clear that we are gonna see a big crash, right, and we have crashed. Here at 109,000 dollars, we have already started to distribute heavily, we have been taking our profits, We have started to sell our Bitcoin inside of our Hartwells.
That's our positioning strategy as we have been writing yesterday in our Paradise and we have the original free channel where we are updating our results So we have been already distributed right there. Ladies and gentlemen right there and then then what we have done afterwards The Bitcoin the Bitcoin crashed right here And then we have got this move above the previous high and we have used this We have used this as
another opportunity to distribute right here at exactly below 121,000 there's 90 % of our distribution was completed right and then as you can see the market started to crash in These videos on YouTube, you know that we have been calling Since 121 thousand dollars for the five waves towards 44 thousand there so we have turned extremely bearish right here people were calling us crazy they were the market they were like the
market is bullish what are you doing we are going to 200 300 500 000 dollars crypto moon car told me so we are going up how can you be bearish right here and i've told you i'm bearish right here because this move above the previous high is just a corrective mode wave structure and it's driven by not a real buying volume right it's not driven by smart money as this bull trend
right that we have confirmed right here in 2023 the bull trend that took us all the way towards that 109 000 dollars and was was happening for many years right so here we We have used this as another distribution opportunity with Para Semic VIPs in our positioning strategy, well, and then we have started to re -accumulate back, right?
As you know, the next target, macro target for us is $169,000, however, that will not happen until and before we are properly re -accumulated, right? So you understand that we are still bearish on the weaker time frame, we are still calling for the 44 000 dollars as we have done since 121 000 dollars this is will this will be our major re -accumulation area right but because the positioning strategy is quite
passive but we are still doing uh aggressive re -accumulations and distributions in it we started to re -accumulate here because it was a great opportunity we have basically already like um we have sold right here right so it was already much at much lower prices where we started to re -accumulate well and then we started to re -accumulate at $71,000 and $61,000 after multiple confirmations that the smart money are doing the
same thing right so $71,000 and $61,000 very important levels well and then because we have seen this nice move and you know that we have been expecting that that it's also why we have been re -accumulated right here and right here because we knew the market will be pushed higher with the highest probability.
Those re -accumulations were not the ones that we would hold all the way towards the new macro target $169,000. Both of these were aggressive market re -accumulations, right? So because we have got this move afterwards that we have been expecting, the $61,000, We have the re -accumulation at $61,000, we have distributed back at $79,000, and then because we have got this opportunity at $86,000, which was close to the top on the
lower time frames, we have pushed towards $87,000, we have done the last redistribution back to USDT right here. So not exactly perfect, but very close to top, right? So we have used this why because the same way we have recognized on the weekly time frame that this move is driven by retail and not a smart money and We have used therefore this nice push above the previous high as a distribution But
this was like much heavier right much heavier Bitcoin redistribution we have used the the same thing for 10 % of our Bitcoin right here and we have redistributed that back into USDT and we have used the re -accumulation that we have done at $71,000 for that so right now as you know we are back with partisan VIPs, 80 % USDT, 20 % Bitcoin okay we have taken our profits and what happened
afterwards after we have sold Bitcoin started to crash as we have been expecting five months ago. So how is that possible? Did we know did we did we know that Binance will be hacked right here? No, right? But as you know every Tuesday Thursday and Saturday for free I have kept you updated.
On daily basis Bitcoin is bullish. We are going to my magical number $79,000 and here most of the people were calling me crazy again. How can you be bullish we are bearish we are going lower much lower and I have told you look at this data I've told you all the on chain data everything that we have been watching and I've been telling you about the mindset of a professional trader as
well right how the professionals are doing that and right now as you can see then we were updating that over and over again and in the last video this was like six days ago one of the latest videos we have been taking a look at the two important support zones where on from the daily time frame perspective the Bitcoin will find the next important support right and as you know the last
possible support what was that 0.786 which is the level where we at right now 64000 dollars as you can see Bitcoin found a nice support there we have created a bullish hammer candlestick pattern right here this is bullish nice bullish volume but can we start recovering right now well we will talk about that but right now I also need to explain to you in order for us to understand and to answer
the question from the intro we first need to understand how the market works right and who is on the other side of your trade the market is made up of whales and retail smart money versus dump money or as I like to call them crypto noobs.
Professional traders are in the middle that's you and me. We are spying on the whales. Whales are usually rich individuals and when you are rich you have rich friends, right? People who often have insider information because they have connections. When you are poor you have poor friends and together you spend a lot of time on social media that makes you easier to manipulate.
Now whales make up less than 20 % of market participants but they control 80 % of the money circulating in the market. Retail on the other hand makes up 80 % of market participants but controls less than 20 % of the money. So when you look at the market think about more than how many people believe something think about how much capital is involved where it is positioned and what those participants
need to do next because when you are a whale entering or exiting a position without moving the market requires one thing liquidity let me give you an example Imagine you want to sell 100 million dollars worth of Bitcoin. Clicking the sell button is easy.
Finding enough buyers at the price you want that is the real challenge. The price you see on your screen does not mean you can sell your entire position at that price. If there are not enough buyers your orders start working through the available bids.
You sell some at one price, more at a lower price and more at an even lower price. You are pushing the market against yourself while you are still trying to exit. Now let's reverse it. Imagine you want to accumulate a huge Bitcoin position.
You need sellers. If there are not enough sellers at the price you want, your own buying starts pushing the price higher before you have finished building your position. That is why whales are always looking for the other side of their trade. And that is where news and emotions come in.
Whales use price action manipulation and news to bring extra liquidity into the market. We call this emotional liquidity. Because it usually comes from retail traders acting out of FOMO or greed. Imagine Bitcoin is already moving higher then an exciting headline appears, people see the green candles, read the headline and start thinking, well this is it I'm going to miss the move, they rush to buy, now imagine a whale has been waiting
for enough buying interest to sell a large position, right, this is the opportunity for the whale, those excited buyers give that seller an opportunity to distribute It's this exit liquidity, we call it exit liquidity. The buyers are thinking about how much higher the price could go.
The seller is thinking about how much of the position can be sold into that demand. They are looking at the same market but they have completely different plans. Now imagine the opposite. Price is falling, a frightening headline appears, traders become afraid and start rushing to sell.
Those are the retail traders, the crypto noobs. If a large participant is looking to accumulate, that selling can provide the other side of the position they want to build, right? So one participant's emotional reaction can become another participant's execution opportunity. That is why I want you to understand what the news does to people behavior and how that behavior turns into orders.
Think of the market as a living organism and liquidity as its blood, that blood needs to keep flowing. And just like having a living organism, the market needs to breathe. Sometimes it inhales, sometimes it exhales, and those breathing patterns are usually predictable. Picture a strong move, followed by a pause, then a pullback, then another expansion, right?
Inhale, exhale. During those phases, buying pressure changes, selling pressure changes, People enter positions, take profits, get stopped out or become eager to try it again. Sometimes a pullback is part of a continuing uptrend, sometimes a recovery is part of a larger downtrend. By understanding those patterns, reading the order throw and understanding where the liquidity is, we can predict what is most likely to happen next.
Wells are liquidity hunters. They look for places where liquidity is positioned in a way that allows them to accumulate or distribute without moving the market. But they also understand market cycles and have access to insider information. So they use the liquidity that is already there or created.
They push news, they manipulate price action, they generate an emotional reaction that brings more buying or selling into the market allowing them to position themselves against the crowd during the middle of a trend the crowd and the whales are often pushing in the same direction but at the tops and bottoms of trends there is always this divergence between whales and retail so imagine a market moving higher retail traders are becoming more
confident while a large seller is using that incoming buying to reduce exposure. Price can still be rising while those two groups are starting to do different things. Now imagine a market moving lower, retail traders are becoming more fearful while a large buyer is using that selling to build exposure.
That is the kind of divergence we always want to investigate, right? And it happens across different time frames whether we are looking at an ultra -high time frame, medium time frame, or a trend on a lower time frame. For example, you can have a recovery on the four -hour chart inside a larger decline on the daily chart.
That recovery can offer an opportunity to ride the market higher, while the bigger structure still leaves room for another decline afterwards. Understanding the relationship between those time frames helps you see how a rally and a later sell -off can belong to the same scenario.
This is where professional traders come in. We act like spies watching the whales, we study the footprints, where orders actually trade, how much buying or selling pressure appears and how price responds to that pressure. When buyers become more aggressive, does the price move keeps moving higher?
When sellers become more aggressive, does the price keep moving lower those are the questions all right that we need to always always ask where does a move start losing a momentum where is activity increasing how does the small smaller trend fit into the larger one those are the questions okay we then connect the price action the order flow the liquidity and the different time frames to build our view of what is
most likely to happen next that brings brings us back to the question from the intro. So a move from $61,000 towards $79,000, followed by another decline can be understood as a sequence within a larger market structure, really can develop, attract buying and create an opportunity for distribution.
The market can then become vulnerable to another move lower, right? So that gives us a scenario to study before the next headline arrives. The news can then bring another wave of emotional activity into conditions that were already developing. And that is why we study how the market is positioned before everyone starts reacting.
By spying on the whales, we can join them and ride the waves with them. And that is why I record these analysis videos for you for free. This is not a trading signals, it is free market analysis and I want you to understand the reasoning behind the analysis.
I want you to recognize the relationship between price, liquidity, emotions and positioning. That is also why we have the MCP free insight tools on our website MyCryptoParadise.com. So I want your thinking to be sharp so you can start looking at the market as a spy watching the whales.
In other words as a professional trader. That's at the higher prices right after we have pushed to that $79,000 we understood this is just an exile of the market because it was a reactionary wave structure right that was the C pattern so then we were starting to look what is happening with the momentum right so we understand that when you are when the when the organism the market is starting to get
out of the breath it's visible on the momentum right so then when we have created another higher high we have seen on the MACD histogram creating a lower high the momentum was already declining right and on the RSI it was perfectly spotted multiple times on our AI RSI intelligence that if you are in the cheap membership PRO Paradiser because we have created a cheap membership PRO Paradiser against the expensive membership parties
on VIP where we are sharing our personal trade setups with clear entry and exit targets we have this cheap membership PRO Paradiser because you get there our intelligence so you can start getting much better much greater edge against other traders because in PRO Paradiser you're getting the same tools and the same insights we use that help us to develop our decision making, right?
So RSI showed us three on every single high or high, right? We have got bearish divergence and a very clear one, right? So the bell started to ring heavily right here. after we have broke the $79,000 we were questioning, right? Is it real move?
Is it bullish? Is it bearish? So we started to look at more data. So we knew on the cumulative volume delta on the spot as I've shared with you in the previous videos, the smart money wasn't accumulating, right? They were still distributing. They were using it as a distribution all of this price action.
And on the momentum, we have already started to see that the market is losing breath right so here on this higher high exaggerated bearish divergence three red dots this was a big alarm okay and it kept me really distributed uh and i'm mostly calling in partisan eap those positioning uh strategy calls all right so that taught me i've done the right thing to call and sold 10 right here and so we
are like trading with a lot of money, right? So we have needed a lot, a lot of money, I mean, liquidity on the other side to be able to distribute the heavy volume we have been selling right here and we have got it from the retail and it kept me in the bearish bias and then on the other high, right, then because I have understood the whales are actually using that and
I've selling opportunity, another one. We have distributed silently with ParadiseFamilyVIP members another 10 % right at 86, right below 86,000 dollars. So take a look at the momentum. Then another higher high right here, and that was my confirmation, classic bearish divergence. So the price started to push higher, but it was the same thing as on the weekly timeframe back in 2025 this higher high above this higher high wasn't real by impression
it wasn't created by the smart money right it was just this emotional fear of missing out push by retail and then on the other higher high smaller higher high somebody calls it equal high but actually on some exchanges we have pushed slightly higher there was a week higher exaggerated bearish divergence all right so very strong signal and then we have pushed below the moving average RSI trend line with the RSI line
so that also helped me to stay bearish and distribute even more use this push above that $79,000 as a kept you bearish, right? So I'm very happy for that right now, ladies and gentlemen. We need to also understand how is it possible. We have also taken a look like how is it possible that we have been able to do this move.
First of all, what I have told you, trading participants are coming back to the market, right? So why? Well, a lot of people thought that the prices are going to go higher but it's not only that it's also market cycles economy starts to get better we are in a quarter four like because it's freezing outside usually depends where you live right but in most countries it's wintertime so you're at home people
are more on their computer so they start to they start to they start to trade again right so more trading participants that means more possible liquidations which is amazing so then the smart money they need to however position the retail at some direction right and they needed to right here at the top position to retail into long positions right so there was a great campaign with crypto Twitter influencers that everything is
bullish right at these prices so they've already created the bullish sentiment and then once the Binance hack happened right and we were talking about that in the previous previous video previous videos we have and I don't know why why nobody else was looking at this nobody else was compared nobody else were comparing the the Binance hack with the buy bit and coin check and empty gog sacks right the empty cooks is
a little bit different, but by with a coin check, very similar to the by Anzac. And we have been like looking at it together, right? In the previous video, this was recorded two weeks ago, and we were looking exactly at the times where the biped hack happened, right?
The biped hack, and then where the coin check hack happened. And the similarities between the by Anzac. every single time they have pushed the hack news right when Bitcoin was close to the moving average trend line right after some distribution period so this was the ending diagonal distribution period this was again a final fifth wave distribution period and let's take a look at the coin check and also the buy Binance hack
happened when the price was was close at the moving average trend line and this is important because below every single time below us there was a buying liquidity this is important and take a look at the Conchak Conchak hack right here I think it was right here right it was right here in 2019 not 2018 26th of January 26th of January 2018 where is it got it right here 20s of January
around here again exactly above the moving average trend line after after ladies, gentlemen, parodysers afterward after distribution period right this take a look at this distribution period okay so and we have been taking a look at the similarities right so because it was pushed the the heck news right above the liquidity pool above the moving average trend line naturally right where the prices immediately didn't go lower and a lot of people
thought that it's because there is a lot of that there is a lot of real buy in demand right but it was always created that liquidity pool by a retail right because they thought they were previously manipulated that the market is gonna go higher so they have started to put buy orders at some supports and this was the most important support zone right so once the hack happened right almost no reaction
at all at the day event right so minus 7 % from coin check minus 3 from buy bit minus 4 from Binance right but then it started to accelerate and every single time the bear trend resumed after coin check hack and then we have got it after the buy -bid hack we have got afterwards a big bigger crash much bigger crash as well right and right now after buy -in and zack
the same thing happened right so I've got here the update at the time of the event around minus 4 minus 3 and right now we are already at much lower prices, right? So the similarities were absolutely, it was clear that they are doing it exactly at the liquidity pools.
So afterwards what happened the market didn't crash after Binance hack, it was just a small dump dump, right? Because there was a buying liquidity below us. So retail got again extremely bullish, right? They have created this kind of campaign around market crypto Twitter influencers CZ right soon created this post that he later Deleted by the way, so he created this post soon green numbers, right?
The Binance Act happened, right? Everything nothing nothing crashed, right? However, who distributed who actually used that liquidity pool the whales and we were looking at it, right? The whales used the final liquidity pool, right, every single time as a distribution zone. So there was a buying liquidity below us, well sold, the buying liquidity was absorbed by retail, right, and then they tried to, well actually they were successful, they didn't just try
to, but they have been successful in making retail create long positions with all of the bullish posts, right, so If you take a look at this thing, he deleted the post, which is just, I don't know, extremely funny. Another guy right here, a lot of views he got right that the market is going to go higher.
Michael Saylor, of course, we are buying again, right? So he showed that he's buying. Then fear during an early bull market is a gift. I'm telling you, everybody thought that this is already beginning of bull market. that I've told you every single time, this is just a reactionary way, right?
We are still in a bear market. And in case you're wondering if you're in a bear market, we have never seen fear in a bear market unless new lows are being made. And we have exactly talked about it, right? The market was fearful.
In the previous videos, we've been taking a look at the fear and greed index, right? So market was fearful, but nobody was actually acting on it from retail. So it's one thing to be fearful and actually start to create short positions and one other thing is being fearful and actually try to catch the bottom which was the case that the retail was doing right so majority of the people after those bullish
posts they started to create long positions right so as we know long positions created market participants were back getting back right because quarter four global economy is getting better so for us this is beautiful town because we just need to trade a part of participants so we can again start recognizing the patterns better so from a professional trading perspective price down price up doesn't matter when we have a lot of liquidity
and a lot of market participants in the in the market it's like again playing a poker not only against other professional poker players but also against the drunk tourists right so the drunk tourists are coming back I've told you this is the beginning of a great times again because market participants are getting back and as I have told you in the previous video 2027 is going to be the best year in
the past three years later and so I'm very excited about that well just to finish that very quickly so basically they've the not only they were buying the retail but also created the long positions after that campaign and once you create a long position you have liquidations below you right and once the market makers started to push below the liquidity pool right below that moving a very strange line then they started
to liquidate those long positions and when you have a long position you need to sell the contracts back and it created this domino effect and finally we have got a follow through and beautiful move down so that's how it happened and right now we are back at our support at that was touched at around sixty two thousand dollars ladies and gentlemen now as I've told you people including CZ basically crypto Twitter
influencers are blaming the the crash on Binance hack and other unimportant stuff all right so the news one more time there are catalysts they create the extra liquidity they are not making the market all right so right now they are trying to blame they are trying to create this kind of smoke mirror right the same way the Nvidia thing it's not about the the child the Chinese guy like cheating on his
wife right that's again just something so you can just point your finger at it the Nvidia shares are dropping and the market is going down because he was doing the illegal stuff of having these kind of deals with the Chinese companies and selling the chips to China, right?
And also it's not just about that the market would go any way down because it's just about the order flow, the liquidity and market cycles. As I've told you, the market is a breathing organism, right? So all of these events, all of the news, they're just catalysts.
they are not making the market alright and then the crypto to influencers the smart money they are pushing these kind of news and events to create the liquidity and then so you can also be able to point your finger at something okay that's why it's happening right that's why it's and it's this kind of television like television tells lies to your vision.
So ladies and gentlemen, this is just a quick update in the next video. In the next video, we will take a look what with the highest probability the market will do next. Okay. So with parallelism VIPs we are already preparing for the next big move and I will keep you updated on Thursday also with the market analysis if you are not in production with VIP I will also keep you updated with
the with these free market analysis about what we are looking at from the lower time frame perspective like daily four hour one hour 15 minutes time frame we will maybe go through 15 minutes time frame as well very important stuff is road no happening.
So next video on Thursday until then take care and trade safe. Cheers!
Educational content, not financial advice. Crypto trading carries substantial risk; you can lose your capital. Past performance does not guarantee future results.










Join the discussion
No comments yet. Members, share how you are reading this.