


Listen: the breakdown
Market briefing: Bitcoin was trading near $80,416, down about 0.7% on the day, while the liquidation heatmap showed dense short clusters between $83,000 and $86,000. We read any bounce into that zone as distribution, not the start of a trend.
- $306 million liquidated in 24 hours, with 86,953 traders wiped out and shorts taking most of the pain.
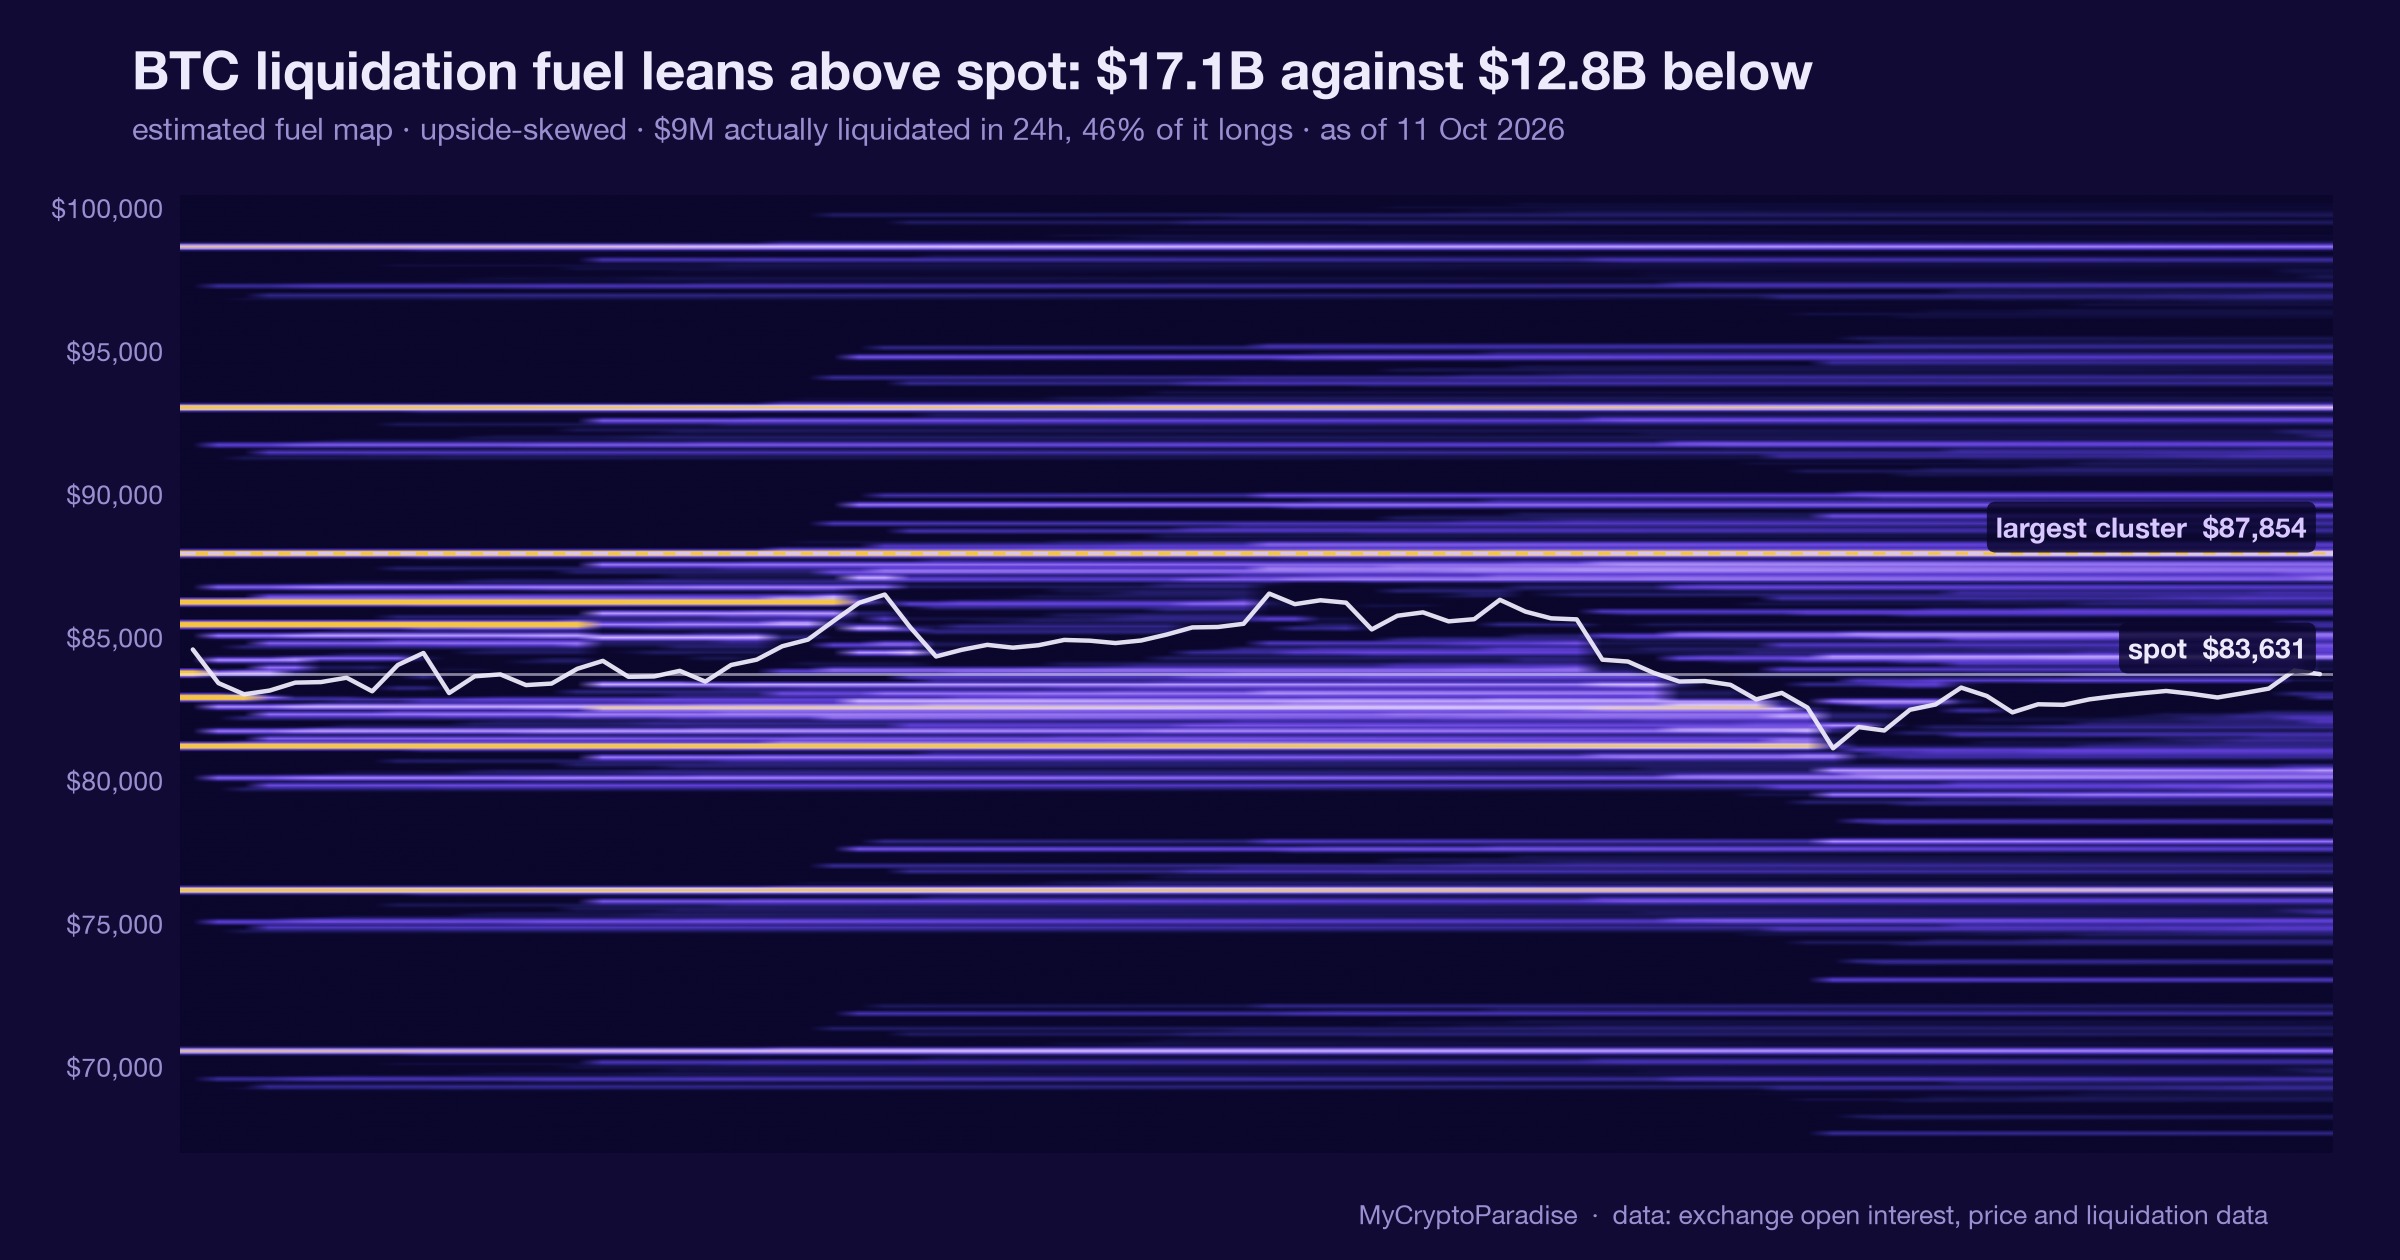
- Dense short liquidation clusters sit between $83,000 and $86,000, just above the current price.
- A bounce to clear those shorts is likely, but our read sees it as distribution, not a fresh trend.
The 24 hour liquidation heatmap shows shorts stacked between $83,000 and $86,000, right above price. Retail calls it fuel for a rally. But who really collects when those shorts get cleared?
The 24 hour liquidation heatmap tells a simple story. Roughly $306 million in leveraged positions vanished across the network in a day. Around 86,953 traders were wiped out. Most of them were short.
Of the $276 million tracked in one window, $218 million were shorts. Only $58.24 million were longs. That ratio matters more than the total. It says the crowd got squeezed for betting against the move, not with it.
The map now shows dense short liquidation clusters between $83,000 and $86,000. Brighter zones mean more leveraged positions stacked there. Roughly $4.8 to $4.9 million in short liquidations sit just above the current price. BTC was trading near $80,416 as of the reading, down about 0.7% on the day.
There was also a single $127.82K long liquidation at $80,188.20. A reminder that both sides bleed when leverage runs hot.
Here is the part retail misreads. A wall of shorts above price looks like fuel for a rocket. And it can produce a bounce. But a bounce that clears trapped shorts is not the same as a trend. Someone still has to sell into that strength.
No single confirmed catalyst drove this, and that is our read, not a headline fact. What we can see is structure: crowded leverage, one-sided pain, and clusters that act like magnets. Price tends to hunt the money. The question is who collects it when it gets there.
Stacked shorts become someone else's exit liquidity
Leverage is the transmission belt here. When positions cluster, they stop being private bets and become shared liquidity. Every stop-loss (SL) is an order waiting to fire. Every liquidation is a forced trade someone else fills.
So the $83,000 to $86,000 short cluster is not just a chart feature. It is a pool of near-guaranteed buying, triggered automatically if price rises into it. Larger players can see the same map you can. They know exactly where the fuel sits.
This is why bearish structure and a short-term bounce can coexist. The bounce is mechanical. Shorts get stopped, their forced buying lifts price, and the move looks bullish for an hour. Meanwhile the bigger picture, crowded longs and positive funding, stays intact.
Open interest (OI) tells the wider story. High OI with one-sided pain means the crowd is heavily committed and thinly cushioned. A market that liquidated 86,953 people in a day is not calm. It is fragile.
The macro effect is simple. Fragile leverage amplifies both directions, but it punishes the crowd more than the patient. Retail supplies the liquidity. Someone larger decides when to take it.
How the squeeze ripples from BTC to alts
BTC leads this cascade, and everything downstream waits on it. A push toward the short cluster would clear positions between $83,000 and $86,000. That tends to produce a fast, thin bounce, not a durable trend.
Watch cumulative volume delta (CVD) during any such move. If price rises while CVD stalls or falls, buyers are not in control. That gap is the signature of distribution: someone selling spot into forced short-covering.
ETH usually exaggerates whatever BTC does. In a squeeze it can outrun BTC on the way up, then give it back faster. Leveraged ETH longs chasing the bounce are the most exposed if the move fails at resistance.
Alts sit last in the queue and feel it worst. They rally hardest on the relief bounce and bleed hardest on the reversal. A trader who buys the alt strength late is usually the exit liquidity for everyone earlier in the chain.
The single $127.82K long liquidation at $80,188.20 shows the other edge. Longs are not safe just because shorts are crowded. Both sides can be harvested in one session.
The honest summary is this: the map favours a bounce, then a fade. That is a probability, not a promise. Structure leans down once the easy shorts are gone.
What a real bounce must prove here
Confirmation and invalidation live at the same levels, so watch how price behaves, not just where it goes.
A tactical bounce toward $82,000, then the $82,400 to $84,200 band, would clear the densest shorts. If that push arrives on weak volume and fading CVD, it confirms the distribution read. Strength that cannot hold above resistance is the tell.
The bearish case invalidates if BTC reclaims and holds well above $84,200, with rising long-side open interest and real spot buying behind it. That would suggest genuine demand, not just short-covering. We would respect that, but we have not seen it yet.
On the downside, watch $75,500 first, then the prior local low near $74,900. A clean break below $74,900 opens room toward far lower support. That is the direction our wider read favours.
Funding rates are the quiet signal. If longs stay crowded and funding stays positive into any bounce, the crowd is still paying to be wrong. That rarely ends well for them.
Also watch time. Clusters that sit untested for long tend to get tested eventually. Price hunts liquidity. The map just tells you where the hunt is likely to lead.
Reading the cluster test through smart money
The ParadiseTeam reads this map through one lens: who is trapped, and who is feeding. Right now the trapped are short sellers stacked into $83,000 to $86,000, and the fuel is retail leverage.
Applied to today, BTC near $80,416 sits just below that cluster. A move up looks bullish on the surface. Our read is the opposite. Any push into $82,000, and especially the $82,400 to $84,200 band, is where we expect larger players to offload, not accumulate.
So we treat strength as suspect until proven otherwise. The bias stays bearish on the daily and weekly picture. The clusters offer a tactical bounce, but the medium-term path leans toward $75,500, then $74,900, and lower if that breaks.
Risk-to-reward (R:R) is the whole game here. Chasing a squeeze into resistance offers poor R:R for a late long. Waiting for the bounce to fail near known resistance offers a cleaner read for the patient.
Retail sentiment stays greedy while structure weakens. That divergence is our edge, not a coincidence. When the crowd is certain and funding is positive, the exit is usually crowded too.
None of this is a promise. It is a probability map. The ParadiseTeam plans for both the bounce and the fade, and lets price confirm which one is paying.
The read behind this: we framed this story through our own market analysis, Bitcoin Whale Sells $9M: Is a Drop Next?
Track it live: our live crypto funding rates and the crypto liquidation heatmap both update in real time, so you can watch this shift for yourself.
Related coverage
For exact entries, targets, and stop losses with full risk management, that is what ParadiseFamilyVIP is for. New to reading these moves? Start with our crypto trading strategies guide.
ParadiseTeam is monitoring the market situation closely, and we are taking these developments into consideration while building our trading tactics inside ParadiseFamilyVIP.
Crypto trading involves substantial risk. Prices are volatile and you can lose money. This article is educational and is not financial advice. Past performance does not guarantee future results.
Does BTC tag the 83K to 86K short cluster before breaking 74,900?
This is how 28 Paradisers are calling it. Tap your call.
No calls on this one yet. Tap yours to be the first.
Free account, no password. Members just sign in.
Follow this topic: Crypto liquidation news










Join the discussion 5
Ah, so the pressure builds again... like too much steam in the boiler... I just focus on my exits if we get that far.
but why call it "whale distribution" if its mostly just leveraged shorts getting wiped? I mean, real risk isnt something to brag about, is it?! sorry.
But calling it "whale distribution" when it's just people taking too much risk on leverage... that feels so wrong. It makes it sound almost… sophisticated. 🙁
A focus on the basis offers better signal for these patterns; that liquidation cluster did not end well for many, if memory serves.
Whale distribution, sure... sounds like a casino. Leverage just kills people, had a buddy... too fast for me to warn him.