


Chart Patterns Explained
In short
The Rectangle Pattern is a consolidation chart formation where price moves between horizontal support and resistance levels, representing a temporary market pause. This pattern can be bullish or bearish, depending on the direction of the eventual price breakout. Traders often wait for a confirmed breakout and retest before entering trades to mitigate false signals.
- The Rectangle Pattern is a consolidation chart formation where price moves between horizontal support and resistance levels. Rectangle Patterns can be bullish or bearish depending on the direction of the breakout. Crypto traders should wait for a confirmed breakout and retest before entering trades to reduce the risk of false signals.
- Volume analysis, market structure, liquidity behavior, and proper risk management significantly improve the reliability of Rectangle Pattern setups.
- While the pattern is highly effective, traders should combine it with technical analysis and broader market context for better decision-making.
The Rectangle Pattern is one of the most common and reliable chart formations in crypto trading. It represents a temporary pause in the market where buyers and sellers reach equilibrium before the next major move begins.
At MCP University FREE, this guide is part of our educational series designed to help crypto traders understand market structure, liquidity behavior, and professional trading strategies. By the end of this guide, you’ll know exactly how to identify, confirm, and trade both bullish and bearish Rectangle Patterns with confidence.
Introducing the Rectangle Pattern
The Rectangle Pattern is a consolidation chart formation that develops when the price moves between a horizontal resistance level and a horizontal support level. During this phase, buyers and sellers remain relatively balanced, preventing the market from establishing a clear trend.
As price repeatedly reacts to both boundaries, liquidity accumulates above resistance and below support. This consolidation reflects a temporary pause in market momentum as participants position themselves for the next major move. Eventually, either buyers or sellers gain control, leading to a breakout that often triggers a strong directional move.
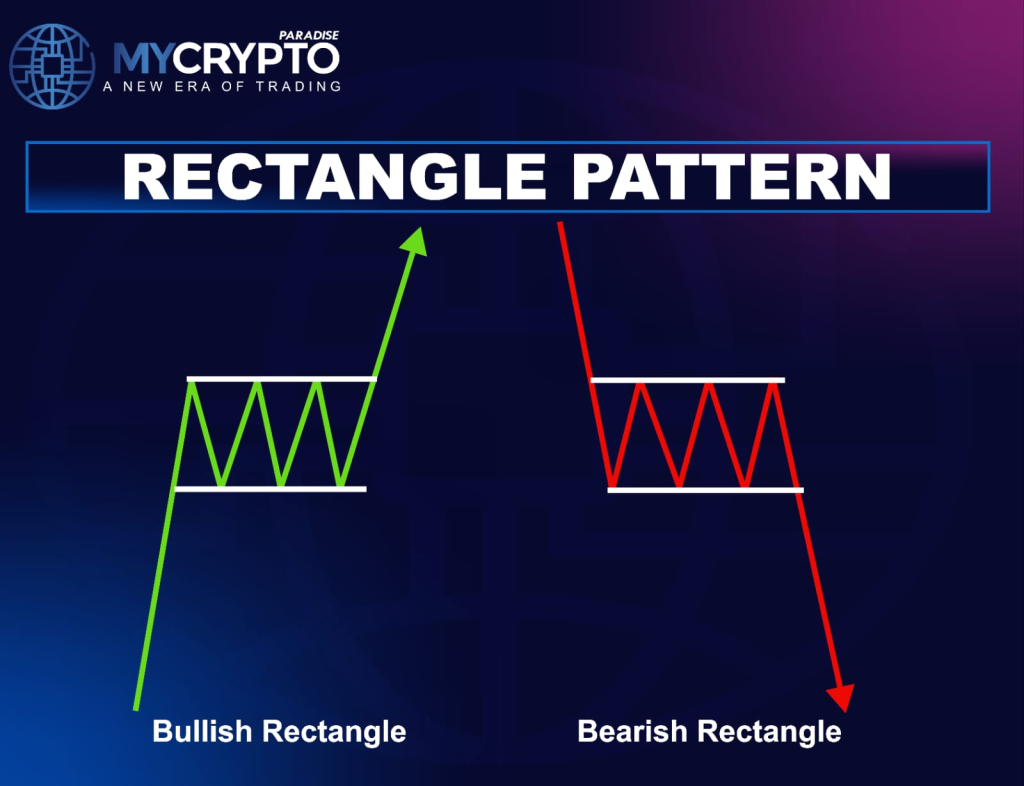
Unlike triangles, wedges, and pennants that form through converging trendlines, the Rectangle Pattern develops within parallel horizontal boundaries. This creates a box-shaped structure that represents market equilibrium before volatility expands. The pattern can appear in both uptrends and downtrends. Depending on the breakout direction and overall market context, it can signal either trend continuation or trend reversal.
Key Characteristics of the Rectangle Pattern
Horizontal Support and Resistance
The Rectangle Pattern is defined by two parallel horizontal lines. The upper boundary acts as resistance, where selling pressure repeatedly prevents further upside, while the lower boundary acts as support, where buying interest consistently absorbs selling pressure.
Sideways Consolidation
Price moves within a well-defined range without establishing a clear trend. This period of consolidation reflects a temporary equilibrium between buyers and sellers as the market pauses before its next significant move.
Multiple Boundary Tests
A valid Rectangle Pattern typically contains several reactions at both support and resistance. These repeated tests confirm the strength of the range and demonstrate that market participants recognize and respect these key levels.
Liquidity Accumulation
As the pattern develops, liquidity builds above resistance and below support. Stop-loss orders, breakout entries, and pending orders often cluster around these levels, creating liquidity pools that may be targeted before the eventual breakout.
Neutral Market Structure
Unlike ascending or descending triangles, the Rectangle Pattern does not carry an inherent bullish or bearish bias. The pattern remains neutral until the price decisively breaks above resistance or below support.
Volatility Expansion After Breakout
Volatility often contracts during the consolidation phase and expands significantly once a breakout occurs. As trapped crypto traders exit positions and new participants enter the market, the price can accelerate rapidly in the breakout direction.
How to Identify the Rectangle Pattern
Identifying a valid Rectangle Pattern requires traders to focus on market structure rather than predicting direction. The objective is to recognize a period of consolidation, confirm the range boundaries, and wait for a breakout that signals the next potential trend.
Step 1: Identify a Consolidation Range
Look for a period where the price stops trending and begins moving sideways. The market should trade within a defined range, showing neither strong bullish nor bearish momentum.
Step 2: Draw Horizontal Support and Resistance
Connect the major swing highs to establish resistance and the major swing lows to identify support. These levels should remain relatively horizontal, forming the characteristic box-shaped structure of the Rectangle Pattern.
Step 3: Confirm Multiple Touchpoints
A reliable pattern should contain at least two to three clear reactions at both support and resistance. Multiple touches confirm that market participants are actively defending the range boundaries.
Step 4: Analyze Volume Activity
Volume often declines as the consolidation develops, reflecting reduced conviction from both buyers and sellers. A noticeable increase in volume during the breakout can provide additional confirmation that a new directional move is beginning.
Step 5: Wait for Breakout Confirmation
Avoid anticipating the breakout while the price remains inside the range. Instead, wait for a decisive candle close above resistance or below support. For additional confirmation, many traders wait for a retest of the broken level before entering a position.
By following these steps, traders can accurately identify Rectangle Patterns and improve their ability to distinguish genuine breakout opportunities from false signals.
Bullish Rectangle Pattern Trading Strategy
After a strong upward move, the price often enters a consolidation phase, moving sideways between clearly defined support and resistance levels. This pause allows the market to absorb previous gains while buyers and sellers temporarily reach equilibrium.
As the range develops, buyers continue defending support and preventing deeper pullbacks, while sellers struggle to push the price below the lower boundary. This ongoing accumulation eventually leads to a breakout above resistance, signaling that buyers have regained control and that the broader uptrend may continue.
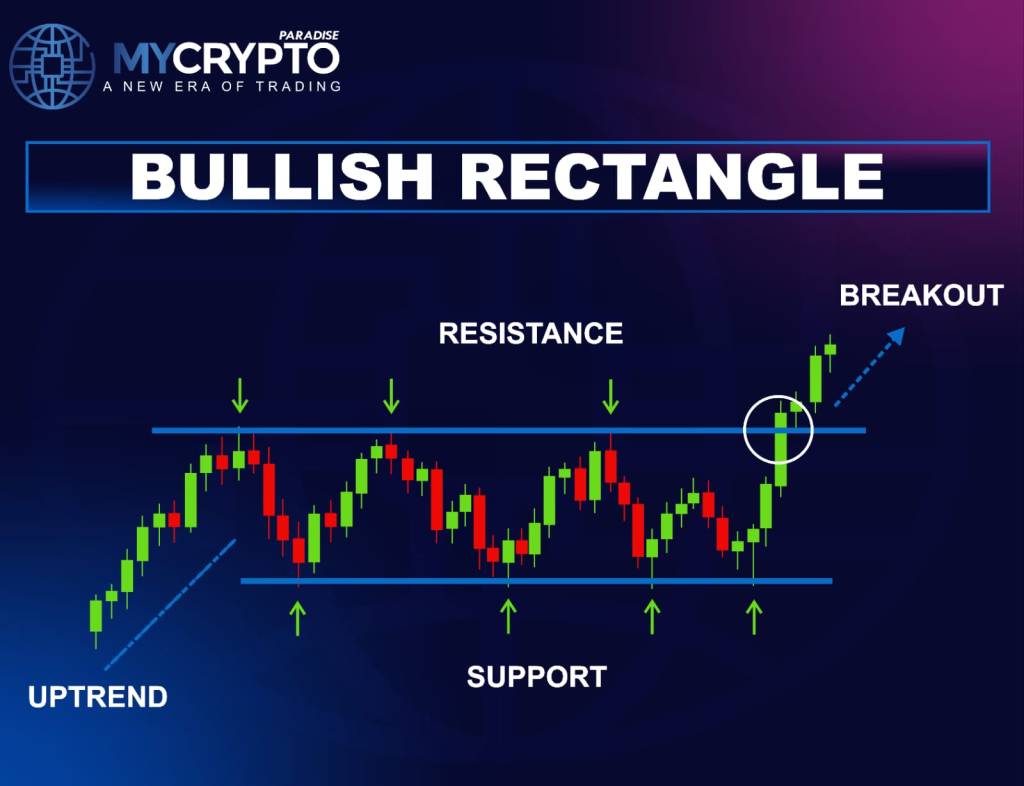
Many crypto traders wait for the price to close above resistance and retest the breakout level as new support before entering a long position. This retest helps confirm the breakout and reduces the risk of falling into a false move. Stop-loss orders are typically placed below the retest low, while profit targets can be estimated by measuring the height of the rectangle and projecting that distance upward from the breakout point.
Bearish Rectangle Pattern Trading Strategy
Price often enters a period of consolidation after a strong downtrend, moving sideways between a well-defined support and resistance level. During this phase, buyers attempt to defend support and slow the decline, while sellers continue to apply pressure near resistance, preventing a meaningful recovery.
As the range develops, selling pressure gradually strengthens until support eventually breaks. A confirmed close below the lower boundary of the rectangle signals that sellers have regained control and that the broader downtrend may continue.
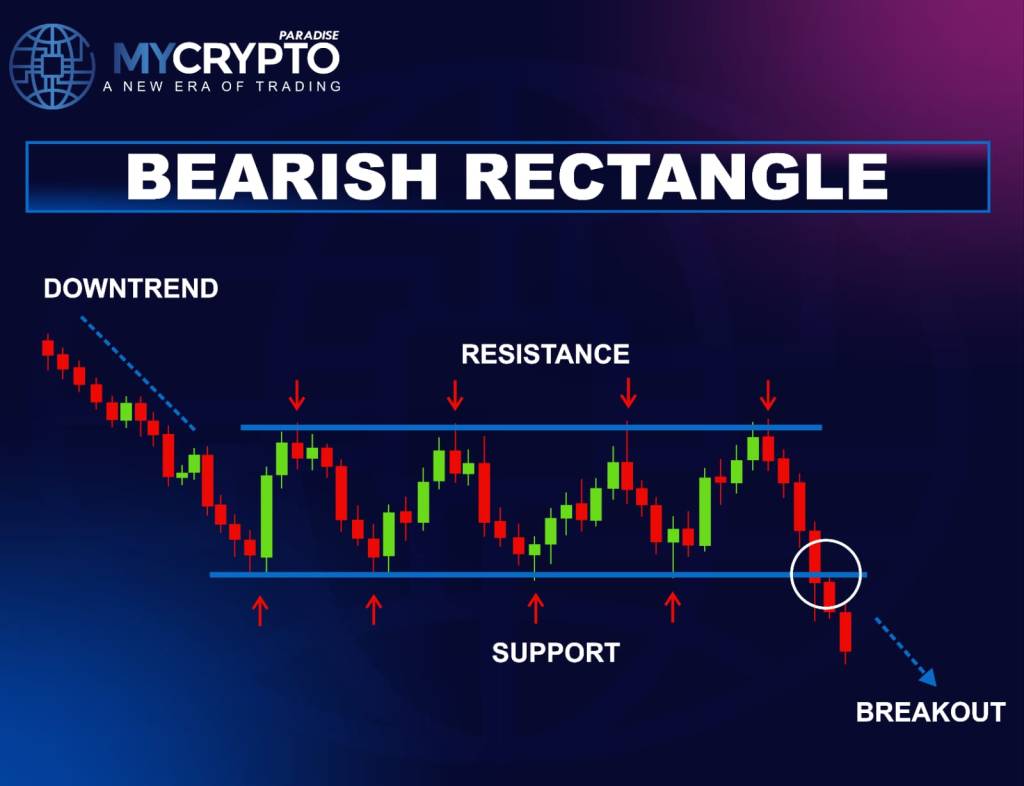
Many crypto traders wait for the price to retest the broken support level as new resistance before entering a short position. This retest helps confirm the breakdown and reduces the risk of entering a false breakout. Stop-loss orders are typically placed above the retest high, while profit targets can be estimated by measuring the height of the rectangle and projecting that distance downward from the breakout point.
How to Trade the Rectangle Pattern
Trading the Rectangle Pattern requires patience and discipline. Since the pattern itself is neutral, crypto traders should avoid predicting the breakout direction and instead wait for confirmation. The highest-probability setups occur when price breaks beyond the range boundaries and confirms the move through momentum, volume, or a successful retest.
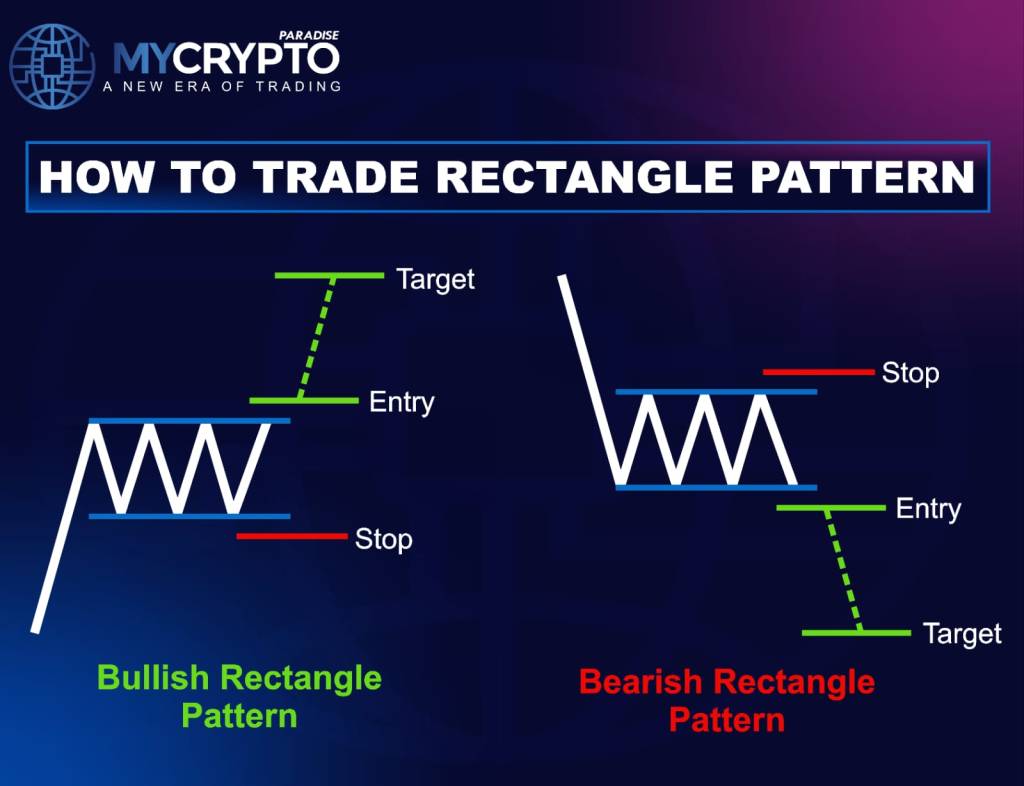
Entry
Wait for a decisive breakout and candle close outside the rectangle. Whether the breakout occurs above resistance or below support, avoid chasing the initial move. Instead, allow the market to retest the broken level and look for confirmation that it has flipped its role. Former resistance should act as support after a bullish breakout, while former support should act as resistance after a bearish breakout.
Stop-Loss Placement
Place the stop-loss beyond the retest level and outside the rectangle structure. For bullish breakouts, the stop-loss is typically placed below the retest low. For bearish breakouts, it is generally placed above the retest high. This approach protects against false breakouts while allowing sufficient room for normal price fluctuations.
Profit Target
A common method for setting profit targets is to measure the height of the rectangle and project that distance from the breakout point in the direction of the move. Traders may also use key support and resistance levels, Fibonacci extensions, liquidity zones, or higher-timeframe market structure to identify additional profit-taking areas.
Breakout Confirmation
Not every breakout leads to a sustained trend. To improve trade quality, look for supporting factors such as increased volume, strong momentum candles, favorable market structure, or alignment with the higher-timeframe trend. These confirmations can help distinguish genuine breakouts from false moves.
By focusing on breakout confirmation, retest validation, and disciplined risk management, traders can approach the Rectangle Pattern with greater confidence and significantly improve their consistency across both bullish and bearish market conditions.
How Reliable Is the Rectangle Pattern?
The Rectangle Pattern is considered one of the more reliable chart formations because it clearly defines support, resistance, entry points, and risk levels.
However, its reliability depends heavily on confirmation. Many false breakouts occur when traders enter too early or ignore volume and market context.
Reliability Factors
Rectangle Patterns often perform best when they develop after a strong trend and break in the direction of that trend.
Key Conditions That Boost Reliability
- The pattern forms after a strong bullish or bearish trend.
- Price reacts multiple times at support and resistance.
- Volume contracts during consolidation and expands during breakout.
- Liquidity sweeps occur before the breakout.
- Momentum indicators support the breakout direction.
- The breakout aligns with the higher timeframe trend.
When these factors align, the Rectangle Pattern becomes a powerful continuation or reversal setup capable of producing substantial moves.
Rectangle Pattern Win Probability
The Rectangle Pattern often leads to strong price movements once the consolidation phase ends. As price moves back and forth between support and resistance, buying and selling pressure gradually builds within the range. When one side finally gains control, the breakout can trigger a significant move in the direction of the trend.
In a bullish scenario, the price breaks above resistance and often advances by at least the height of the rectangle, with further gains possible if momentum remains strong. In a bearish scenario, the price breaks below support and can decline by a similar measured distance as sellers take control.
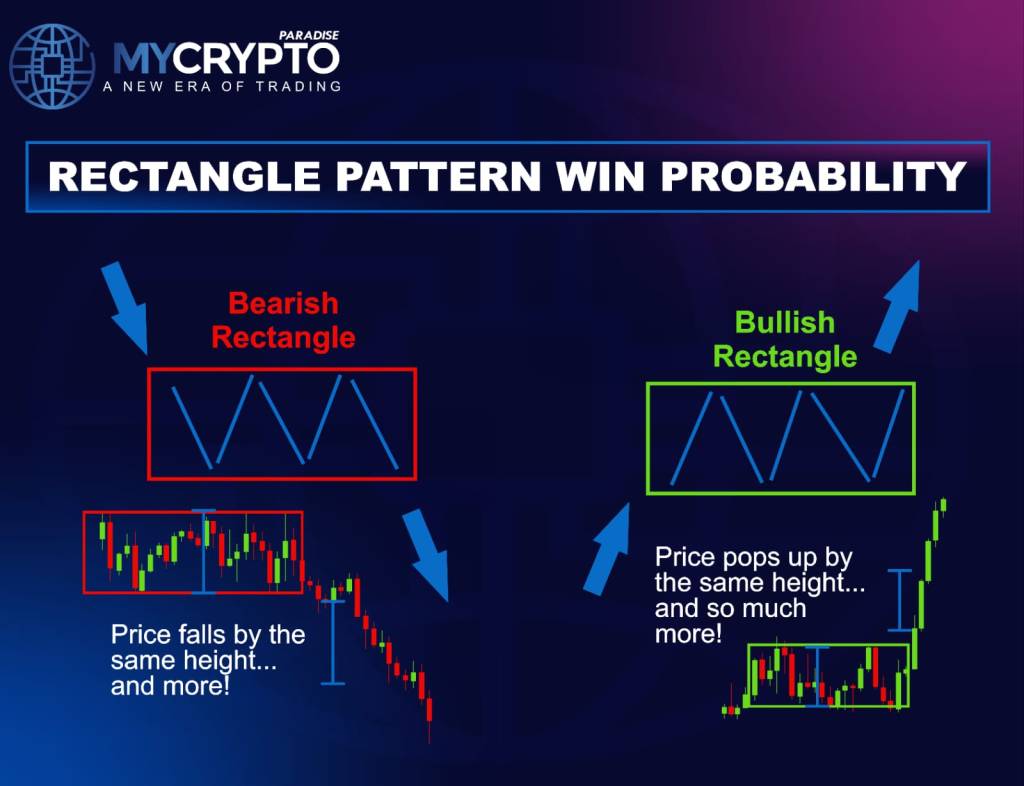
While the Rectangle Pattern can be highly effective,crypto traders should not rely on the pattern alone. The strongest setups are usually supported by increased volume, a confirmed breakout, and alignment with the higher-timeframe trend. Combining these factors with proper risk management can significantly improve the probability of a successful trade.
Common Mistakes Traders Make
While the Rectangle Pattern is relatively easy to identify, many traders reduce its effectiveness through poor execution. Avoiding the following mistakes can significantly improve trading results.
Trading Inside the Range
Entering trades before a confirmed breakout often leads to losses, as the price may continue consolidating within the rectangle for an extended period.
Entering Without Confirmation
Acting on a temporary move beyond support or resistance can result in false breakout traps. Always wait for a decisive close and additional confirmation when possible.
Ignoring Volume
A breakout without strong volume lacks conviction and is more likely to fail. Volume helps validate the strength of the move.
Poor Risk Management
Placing stop-losses too close to the breakout level can expose traders to liquidity sweeps and normal market volatility.
Ignoring Market Context
Trading against the higher-timeframe trend reduces the probability of success. Rectangle breakouts are generally more reliable when they align with the broader market direction.
Emotional Trading
Impatience and fear of missing out (FOMO) often lead to premature entries and poor decision-making. Successful traders remain patient and wait for confirmation before entering a position.
By avoiding these common mistakes, traders can improve discipline, manage risk more effectively, and increase the probability of successful Rectangle Pattern trades.
Rectangle Pattern vs Other Chart Patterns
Although the Rectangle Pattern shares similarities with other consolidation formations, its horizontal structure and neutral bias make it distinct. Understanding these differences can help traders improve pattern recognition and avoid misinterpreting market conditions.
Rectangle vs Symmetrical Triangle
A Symmetrical Triangle forms as price gradually contracts between converging trendlines, reflecting decreasing volatility and growing market indecision. In contrast, a Rectangle Pattern develops between horizontal support and resistance levels, where price consolidates within a fixed range before breaking out.
Rectangle vs Ascending Triangle
An Ascending Triangle has a bullish bias, characterized by a horizontal resistance level and rising support. This structure signals increasing buying pressure as buyers gradually push prices higher. A Rectangle Pattern, however, remains neutral throughout its formation, as both support and resistance stay relatively flat until a breakout determines the direction.
Rectangle vs Descending Triangle
A Descending Triangle carries a bearish bias, featuring a horizontal support level and declining resistance. This pattern reflects growing selling pressure and often precedes a downside breakout. By comparison, a Rectangle Pattern shows a more balanced struggle between buyers and sellers, with neither side gaining a clear advantage during consolidation.
Rectangle vs Channel Pattern
A Channel Pattern forms within two parallel trendlines that slope upward or downward, reflecting a controlled trend. An ascending channel indicates an uptrend, while a descending channel signals a downtrend. The Rectangle Pattern differs because its boundaries remain horizontal, representing a sideways market rather than a trending one.
By understanding the distinctions between the Rectangle Pattern and other chart formations, crypto traders can better identify market structure, assess directional bias, and select the most appropriate trading strategy for each setup.
Conclusion
The Rectangle Pattern is one of the most effective consolidation formations in technical analysis, providing crypto traders with a clear framework for identifying potential breakout opportunities. By highlighting periods of equilibrium between buyers and sellers, the pattern helps traders anticipate significant price movements while maintaining well-defined entry, stop-loss, and profit-target levels.
However, the pattern’s true value lies not in predicting direction but in waiting for confirmation. Successful traders focus on breakout validation, volume expansion, liquidity behavior, and overall market structure before committing to a position. When combined with disciplined risk management, the Rectangle Pattern can become a powerful tool for capturing both bullish and bearish market moves.
At ParadiseFamilyVIP🎖️, we help traders go beyond basic chart patterns by combining technical analysis, liquidity concepts, market sentiment, and institutional order flow insights. This comprehensive approach allows our members to identify high-probability setups and navigate the market with greater confidence.
👉 Join ParadiseFamilyVIP🎖️ today and start trading like a PRO. Membership slots are limited. Secure yours now or join the waiting list to stay ahead of the next major market move.
FAQs
What is a Rectangle Pattern in crypto trading?
A Rectangle Pattern is a consolidation chart formation where price moves between horizontal support and resistance levels before eventually breaking out in either direction.
Is a Rectangle Pattern bullish or bearish?
The Rectangle Pattern is neutral by nature. It becomes bullish when the price breaks above resistance and bearish when the price breaks below support.
Is the Rectangle Pattern reliable?
Yes, the Rectangle Pattern can be highly reliable when combined with breakout confirmation, volume analysis, market structure, and proper risk management.
What timeframe works best for Rectangle Patterns?
Rectangle Patterns can appear on any timeframe, but higher timeframes, such as the 4-hour, daily, and weekly charts, generally provide stronger and more reliable signals.
How can traders avoid false breakouts?
Traders should wait for a confirmed breakout, strong volume participation, and ideally a retest of the broken level before entering a position.
What is the profit target for a Rectangle Pattern?
A common method is to measure the height of the rectangle and project that distance from the breakout point. Additional targets may be based on support and resistance levels, liquidity zones, or Fibonacci extensions.
What is different here
Most guides stop at the theory. The MyCryptoParadise team shares the live trades, and the reasoning behind each one, inside ParadiseFamilyVIP. Everything here is education, not financial advice.
Crypto trading involves substantial risk and is not suitable for everyone. Nothing here is financial advice; it is education only. Never risk more than you can afford to lose.


Join the discussion
No comments yet. Pro Paradiser members, share how you are reading this.