


Technical Analysis Patterns
In short
A rectangle pattern in crypto trading forms when an asset's price trades sideways between two horizontal levels of support and resistance. This pattern indicates market indecision and appears as a rectangle shape on a price chart. Traders identify these patterns to anticipate potential breakouts above resistance or below support, which can signal future price direction.
A rectangle pattern is one of the most common technical analysis patterns in crypto trading. A rectangle pattern is formed when the price of an asset trades in a range between two horizontal levels, creating a rectangle shape on a price chart. This pattern shows that the market is indecisive about the direction of the asset’s price.
Traders can use rectangle patterns to identify potential trading opportunities and make profitable trades. In this article, we will discuss advanced methods for trading rectangle patterns in the cryptocurrency market.
Identifying Rectangle Pattern
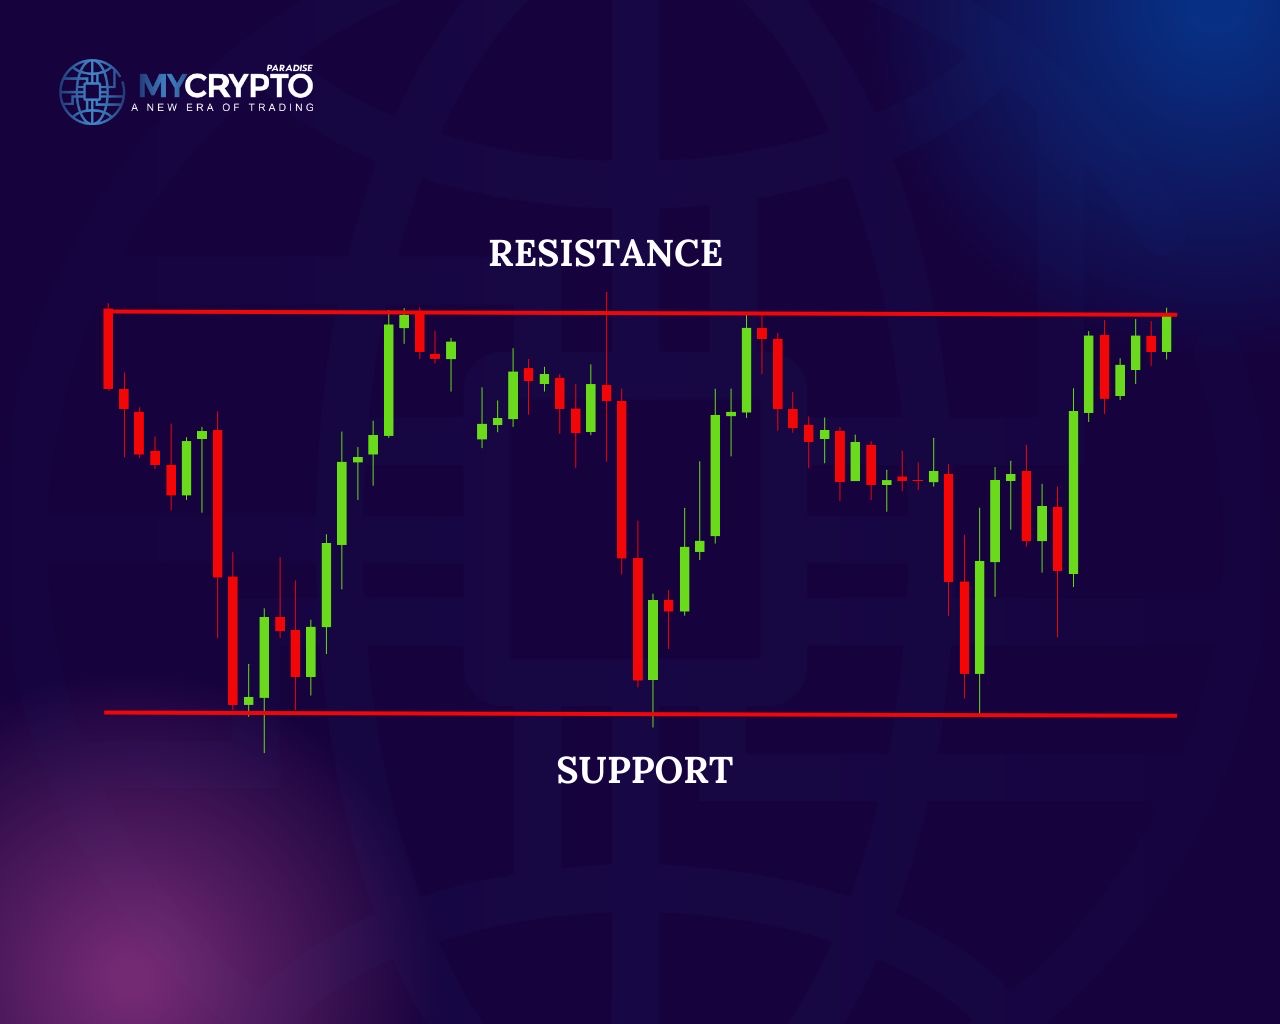
Before we delve into advanced technical analysis and trading strategies, it’s important to understand how to identify rectangle patterns. A rectangle pattern can be identified by drawing a horizontal line at the top and bottom of the range that the asset’s price is trading in. Once the lines are drawn, it creates a rectangle shape on the chart.
Traders should look for the rectangle pattern to last for at least four weeks and have at least two touches on each of the horizontal lines. The more touches on each line, the more significant the pattern becomes.
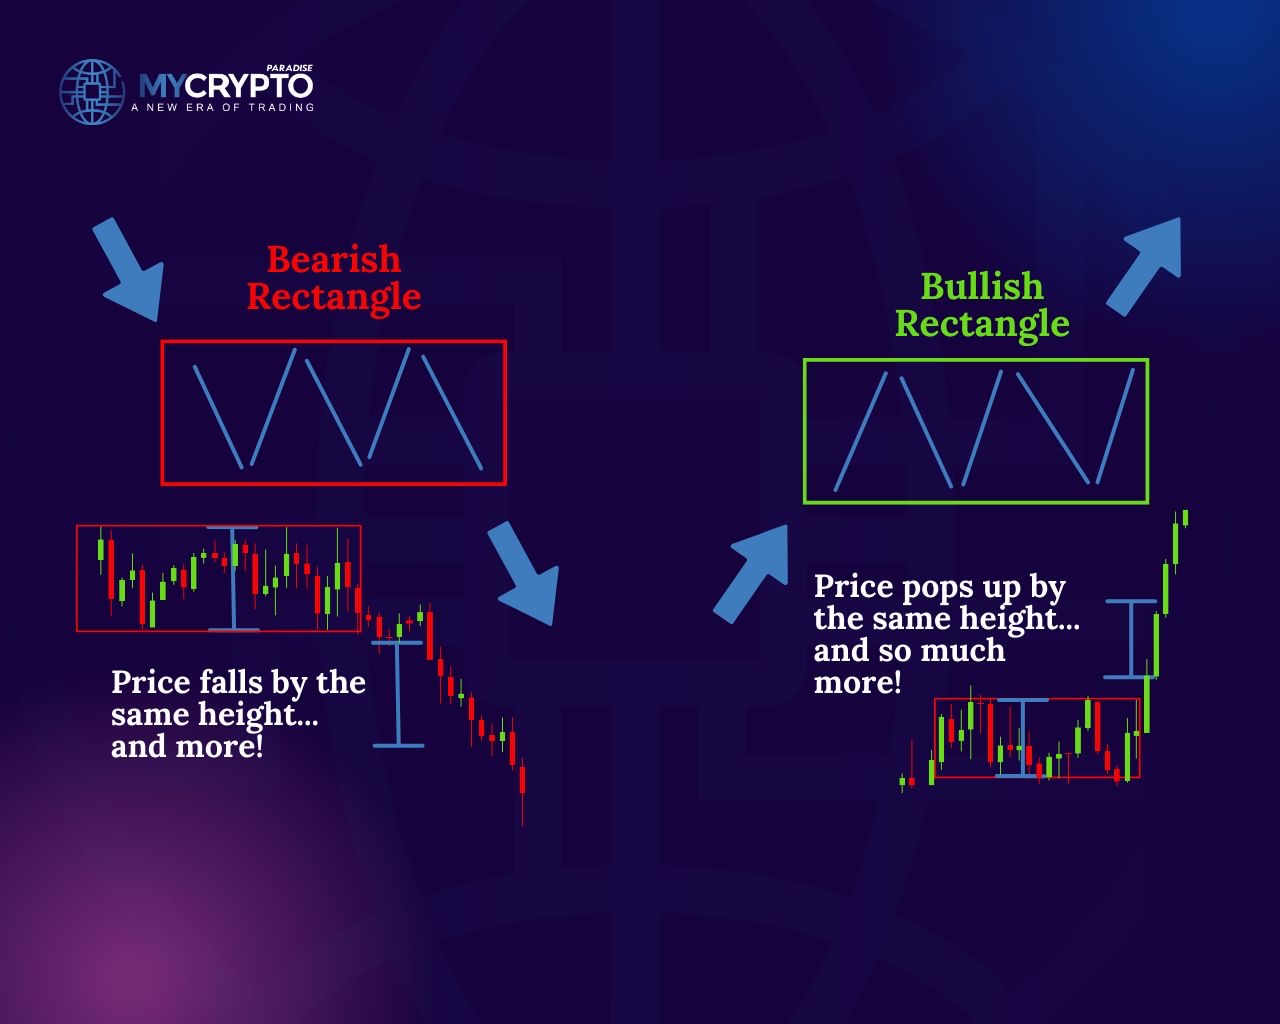
Bullish Rectangle Pattern
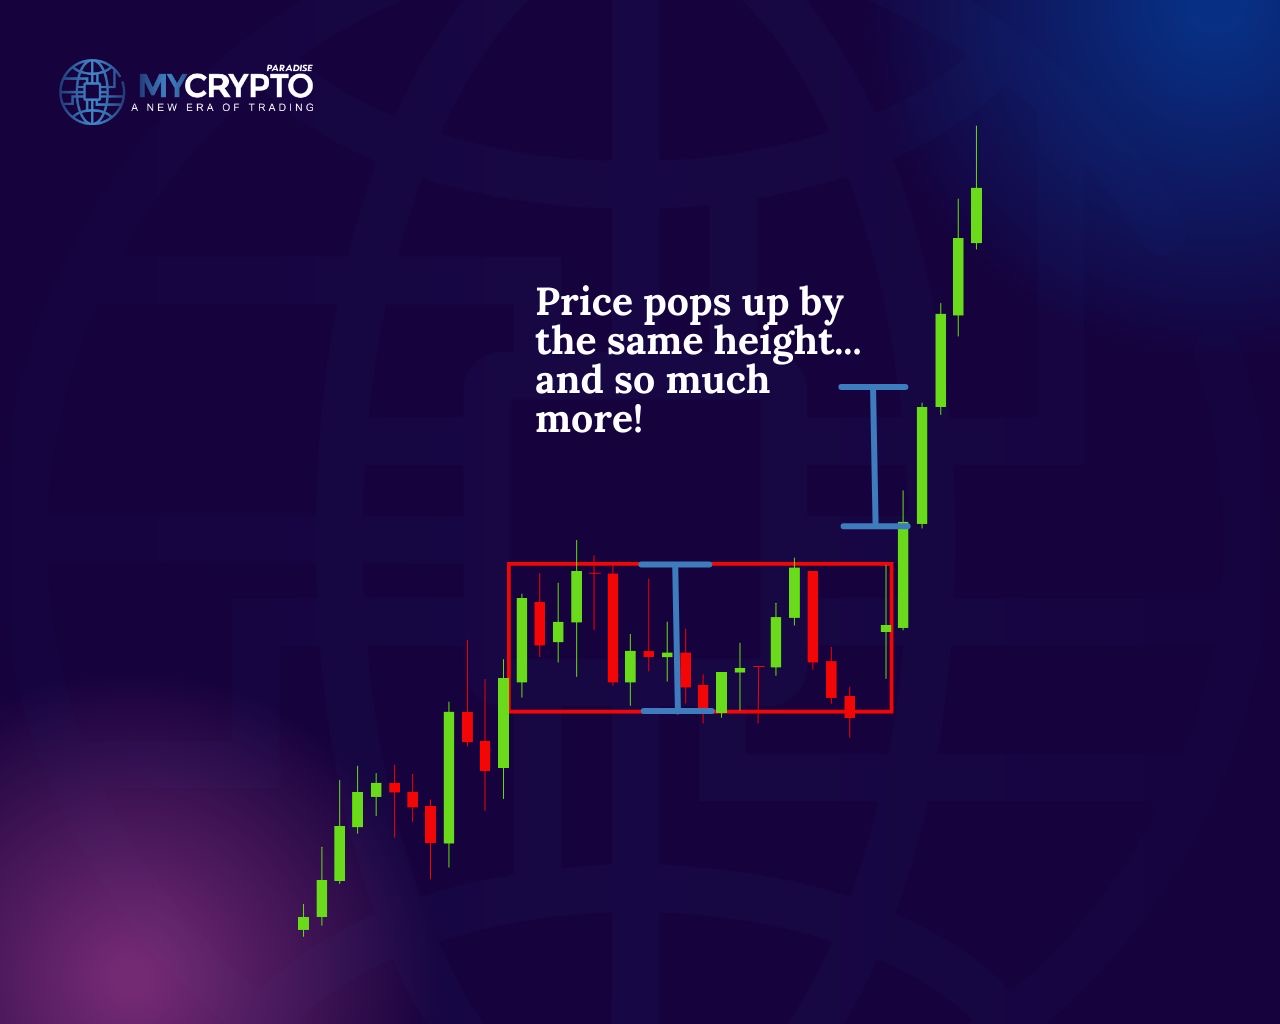
A bullish rectangle pattern is a pattern that occurs in an uptrend and indicates that the price of an asset is likely to continue to rise. Traders can use the following steps to trade a bullish rectangle pattern:
1. Wait for the price to break above the resistance level (upper horizontal line).
2. Enter a long position once the price breaks above the resistance level, with a stop-loss below the support level (lower horizontal line).
3. Take profit at the next significant resistance level or use a trailing stop-loss to capture further gains.
Bearish Rectangle Pattern
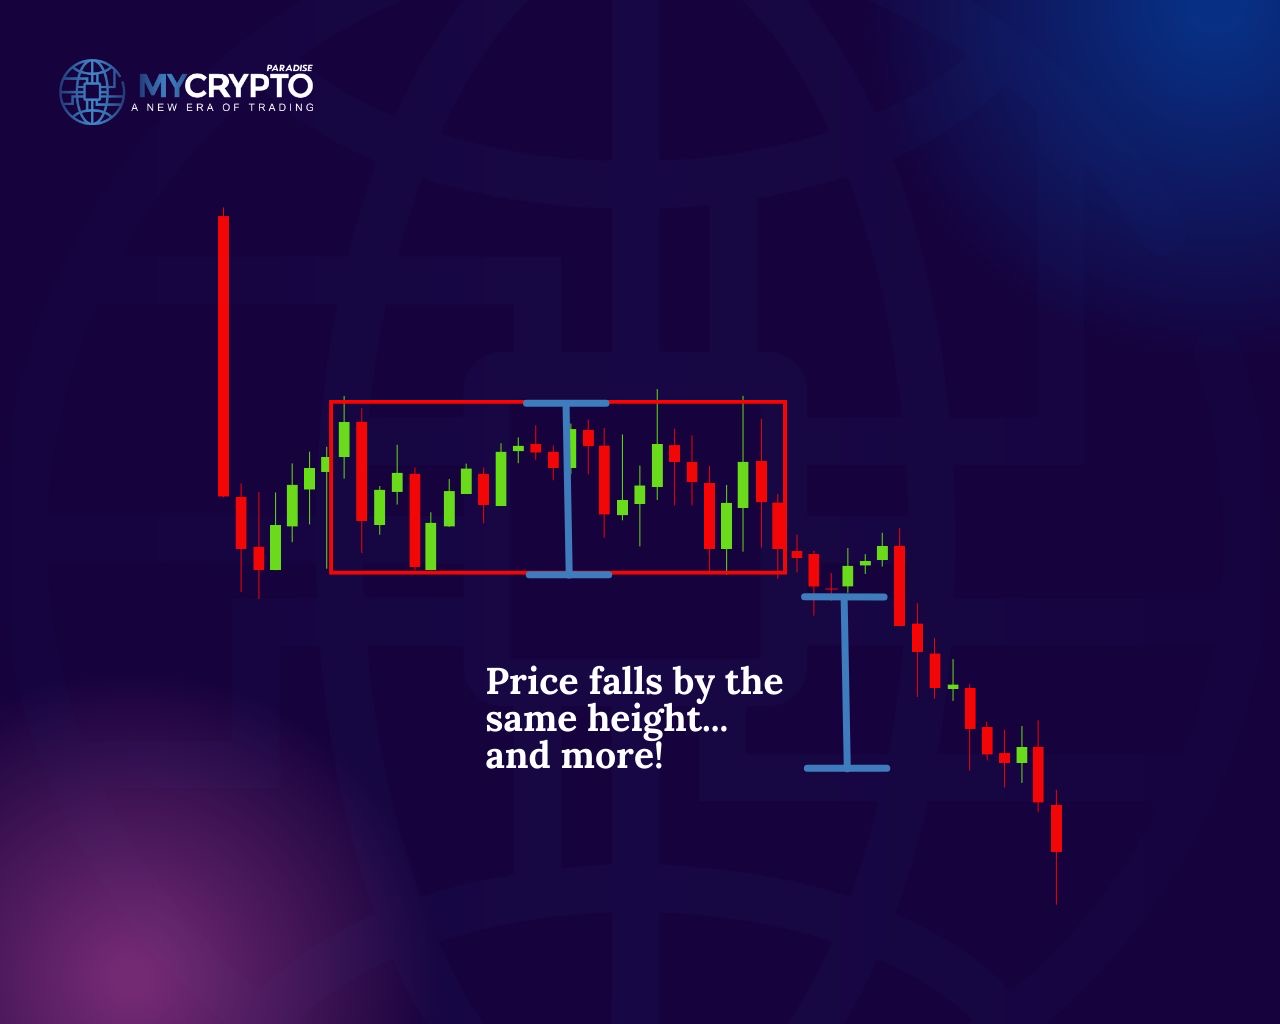
A bearish rectangle pattern is a pattern that occurs in a downtrend and indicates that the price of an asset is likely to continue to fall. Traders can use the following steps to trade a bearish rectangle pattern:
1. Wait for the price to break below the support level (lower horizontal line).
2. Enter a short position once the price breaks below the support level, with a stop-loss above the resistance level (upper horizontal line).
3. Take profit at the next significant support level or use a trailing stop-loss to capture further gains.
Trading Rectangle Pattern Breakouts
One of the most common trading strategies used with rectangle patterns is trading breakouts. Breakouts occur when the price of an asset breaks through the upper or lower horizontal line of the rectangle pattern. Traders can use the following steps to trade breakouts:
1. Wait for the price to break above the resistance level (upper horizontal line) or below the support level (lower horizontal line).
2. Enter a long position if the price breaks above the resistance level or enter a short position if the price breaks below the support level, with a stop-loss in place.
3. Take profit at the next significant level of resistance or support, or use a trailing stop-loss to capture further gains.
Trading Rectangle Pattern Pullbacks
Another trading strategy that crypto traders can use with rectangle patterns is trading pullbacks. A pullback occurs when the price of an asset retraces back to the breakout level after breaking through the horizontal line of the rectangle pattern. Traders can use the following steps to trade pullbacks:
1. Wait for the price to break above the resistance level (upper horizontal line) or below the support level (lower horizontal line).
2. Wait for a pullback to occur, where the price retraces back to the breakout level.
3. Enter a long position if the price retraces back to the breakout level after breaking above the resistance level, or enter a short position if the price retraces back to the breakout level after breaking below the support level, with a stop-loss in place.
4. Take profit at the next significant level of resistance or support, or use a trailing stop-loss to capture further gains.
How to Set Entry, Stop Loss and Take Profits While Trading Rectangle Patterns
 Determining good entry, stop loss, and take profit levels for trading rectangular patterns depends on various factors, such as the time frame of the pattern, the overall market conditions, and the trader’s risk tolerance and trading strategy. However, here are some general guidelines that traders can consider when trading rectangular patterns:
Entry
For a bullish rectangle pattern, traders can consider entering a long position once the price breaks above the resistance level with a buy order. For a bearish rectangle pattern, traders can consider entering a short position once the price breaks below the support level with a sell order. It’s important to wait for the price to break out of the pattern before entering a trade to avoid false breakouts.
Stop Loss
Stop-loss orders are critical for managing risk and protecting capital. For a long position, traders can consider placing a stop-loss order below the support level of the rectangle pattern. For a short position, traders can consider placing a stop-loss order above the resistance level of the pattern. Traders should always use a stop-loss order to limit their potential losses in case the price moves against their trade.
Take Profit
Traders can consider taking profit at the next significant resistance or support level, depending on their trading strategy and risk tolerance. They can also use trailing stop-loss orders to capture further gains if the price continues to move in their favour. Traders should avoid setting unrealistic profit targets and always consider market conditions, such as volatility and liquidity, when determining their take profit levels.
In summary, determining good entry, stop-loss, and take profit levels for trading rectangular patterns depends on various factors. Traders should always use proper risk management techniques, such as stop-loss orders, to protect their capital and consider other factors, such as market conditions and their trading strategy, when making their trades.
Probabilities that a Rectangle Pattern Signal will Result in Profits
The probability of a rectangle pattern going in your favor depends on various factors, such as the time frame of the pattern, the number of touches on the horizontal lines, and the overall market conditions. However, it’s important to note that technical analysis patterns, including rectangle patterns, are not 100% accurate and should be used in conjunction with other analysis tools and risk management techniques.
Generally, the more touches a rectangle pattern has on the horizontal lines, the higher the probability that the price will break out in your favour. If the pattern has only two touches on each line and lasts for a short period, such as a few days, the probability of the price breaking out in your favour may be lower compared to a pattern that has multiple touches and lasts for several weeks.
The overall market conditions also play a significant role in the probability of a rectangle pattern going in your favour. For example, if the market is in a strong uptrend, the probability of a bullish rectangle pattern going in your favour may be higher compared to a market in a downtrend.
It’s essential to remember that technical analysis patterns are not always accurate, and traders should always use proper risk management techniques, such as stop-loss orders, to protect their capital. It’s also crucial to conduct additional analysis and consider other factors, such as fundamental analysis and market sentiment, before making any trading decisions.
If price breaks out in the opposite direction
If the price breaks out in the opposite direction of the rectangle pattern, traders can consider the following adjustments to their trading strategies:
1. Cut losses quickly: If the price breaks out in the opposite direction of the rectangle pattern, traders should consider cutting their losses by closing their positions and taking a small loss. This will prevent further losses if the price continues to move in the opposite direction.
2. Reverse positions: Traders can also consider reversing their positions and taking a position in the opposite direction of the original trade. For example, if the original trade was a long position, traders can switch to a short position if the price breaks out in the opposite direction of the rectangle pattern.
3. Wait for confirmation: Traders can also wait for confirmation of the new trend before taking any action. This means waiting for the price to establish a new trend and confirm that the breakout was not a false breakout. Traders can use technical indicators such as moving averages, MACD, or RSI to confirm the new trend.
4. Adjust stop-loss: If traders choose to wait for confirmation of the new trend, they can adjust their stop-loss orders to limit their losses. This means moving the stop-loss order closer to the entry price or adjusting it to the new support or resistance levels.
Conclusion
In conclusion, rectangle patterns are a valuable tool for traders in the cryptocurrency market. Traders can use rectangle patterns to identify potential trading opportunities and make profitable trades. By using advanced trading strategies such as trading breakouts and pullbacks, traders can increase their chances of success. As with all trading strategies, risk management is crucial, and traders should always use stop-loss orders to limit their losses.
The technical knowledge you’ve gained here is a strong foundation, but it won’t guarantee consistent profitability. To achieve long-term success over the next 3+ years, you need to pair it with proper trading strategies and tactics.
At ParadiseFamilyVIP, we combine technical analysis, on-chain insights, sentiment monitoring, and whale psychology with proven strategies to provide accurate crypto signals and portfolio management, ensuring long-term profitability.
The ParadiseTeam shares all trades, planned exits, and portfolio allocation percentages with full transparency, so you can achieve the same ROI.
Our daily trading activities using real capital are shared openly, helping you learn how professionals operate. If you’re ready to take your trading skills to the next level, joining our inner circle is the best way forward. Seats are limited, so join the waiting list if needed.
This premium service is tailored for traders with sufficient capital. If you’re just starting, build your foundation with our FREE Telegram channels.
To check ParadiseFamilyVIP membership availability, click here: https://mycryptoparadise.com/paradisefamilyvip/
We trade only on carefully vetted exchanges, offering up to 35% fee discounts and deposit bonuses for members. These platforms are secure, trusted, and fully vetted by the ParadiseTeam 💙🌴
MEXC: https://www.mexc.com/landings/MyCryptoParadise?handleDefaultLocale=keep&inviteCode=1nqGL
BINGX: https://bingx.com/en/act/chanelActivityStyle3/PCF833J1/
KCEX: https://www.kcex.com/register?inviteCode=MYCRYPTOPARADISE
BITUNIX: https://www.bitunix.com/register?vipCode=3q22
Additionally, BITUNIX and KCEX are fully licensed and legal in the USA ✅💰
Rectangle Pattern FAQ
How do you identify a rectangle pattern?
Draw a horizontal line across the swing highs and another across the swing lows where price keeps bouncing. A valid rectangle should last at least four weeks and have at least two touches on each line. More touches make the pattern more significant.
How do you trade a rectangle breakout?
Wait for price to close beyond the upper resistance or lower support line before entering. Go long on an upside break or short on a downside break, placing your stop-loss on the opposite side of the range. Target the next significant support or resistance level.
Where should you place stop-loss and take-profit levels?
For a long position, place the stop-loss below the rectangle's support; for a short, place it above resistance. Take profit at the next major support or resistance level, or trail your stop to capture more of the move if price keeps running.
Are rectangle patterns reliable?
No technical pattern is fully reliable, and rectangles are no exception. Patterns with more touches, a longer duration, and a supportive trend tend to resolve more favorably. Always combine them with risk management and other analysis before trading.
Crypto trading involves substantial risk of loss. This article is educational and is not financial advice. Past performance does not guarantee future results. Always do your own research.
What is different here
Most guides stop at the theory. The MyCryptoParadise team shares the live trades, and the reasoning behind each one, inside ParadiseFamilyVIP. Everything here is education, not financial advice.
Crypto trading involves substantial risk and is not suitable for everyone. Nothing here is financial advice; it is education only. Never risk more than you can afford to lose.


Join the discussion
No comments yet. Pro Paradiser members, share how you are reading this.