


Chart Pattern Explained
In short
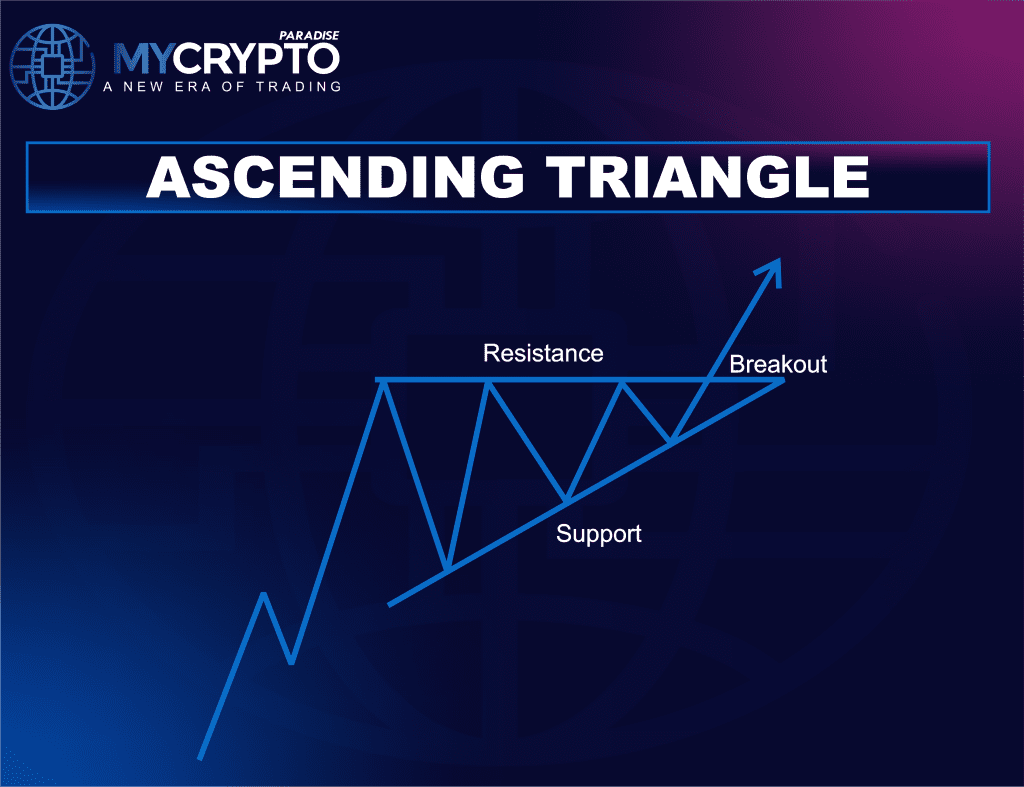
An ascending triangle is a bullish chart pattern characterized by a flat horizontal resistance line and a rising support trendline of higher lows. It indicates increasing buying pressure against a fixed resistance level, with confirmation occurring when the price closes above resistance on strong volume.
- The Ascending Triangle Pattern is a bullish chart structure formed by rising support and horizontal resistance, reflecting increasing buying pressure against a key resistance level.
- This pattern often signals bullish continuation. However, confirmation only occurs after a strong breakout above resistance supported by volume.
- Successful trading requires patience, breakout confirmation, proper stop-loss placement, and disciplined risk management to avoid fakeouts and emotional entries.
The Ascending Triangle Pattern is one of the most reliable bullish continuation structures in technical analysis. It reflects growing buyer strength as price continues to print higher lows while repeatedly testing a fixed resistance zone.
At MCP University FREE, this guide is part of our professional trading education series designed for traders who focus on market structure, liquidity behavior, and disciplined execution rather than emotional decision-making. By the end of this article, you will understand how to identify the Ascending Triangle Pattern, analyze the psychology behind it, and trade it with precision.
Introducing the Ascending Triangle Pattern
The Ascending Triangle Pattern is a bullish chart formation that develops when buyers gradually gain strength against a horizontal resistance level. Unlike neutral consolidation patterns, this structure shows clear signs of increasing demand as price continues to create higher lows while struggling against a fixed ceiling.
Specifically, the pattern forms when price repeatedly tests a resistance zone while the support trendline rises over time. As a result, the trading range becomes tighter, compressing prices into a narrowing structure that often leads to a strong breakout.
This tightening is not random. Instead, it reflects aggressive accumulation from buyers who continue entering the market at higher prices. Sellers initially defend the resistance area, but over time, their strength weakens as buying pressure increases. Eventually, one side loses control. In most cases, buyers absorb the remaining sell orders near resistance, causing the price to break upward with momentum.
The Ascending Triangle is especially important in crypto trading because it often appears during bullish continuation phases, institutional accumulation, and pre-breakout compression environments.
Key Characteristics of an Ascending Triangle Pattern
Horizontal Resistance
The upper boundary of the Ascending Triangle remains relatively flat, representing a key resistance zone where sellers repeatedly defend the market. Each time the price reaches this level, selling pressure temporarily prevents further upside movement. However, repeated tests gradually weaken the resistance as buyers continue absorbing available supply. This horizontal ceiling becomes the main breakout level that crypto traders monitor for bullish confirmation.
Rising Support Trendline
The lower boundary slopes upward as buyers consistently enter the market at higher prices. Instead of waiting for deeper pullbacks, bullish crypto traders become increasingly aggressive during each retracement. This rising support reflects growing market confidence, strengthening demand, and gradual buyer dominance over sellers.
Price Compression
As the pattern develops, the distance between support and resistance steadily narrows, creating a compression structure. This tightening price action reflects pressure buildup within the market as volatility temporarily decreases before expansion occurs. The longer the compression phase lasts, the stronger the eventual breakout potential often becomes.
How to Identify the Ascending Triangle Pattern?
Identifying a reliable Ascending Triangle Pattern requires more than simply drawing trendlines on a chart. Crypto traders must analyze price structure, support and resistance behavior, and volume activity to confirm the setup properly.
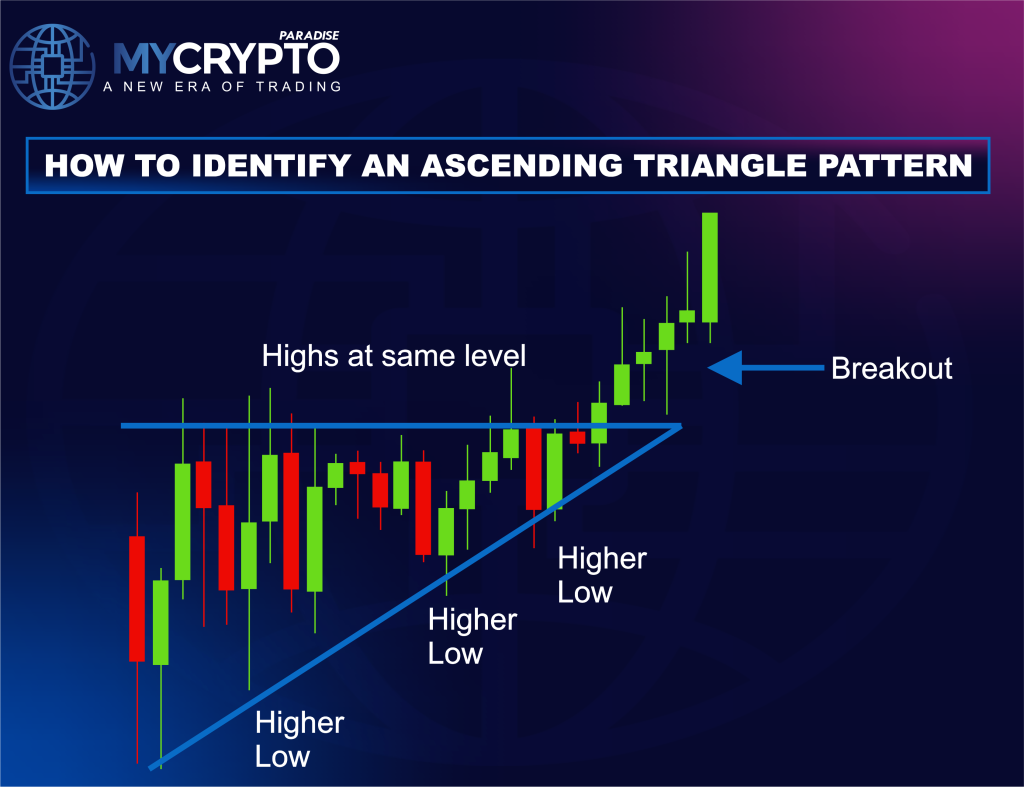
Confirm Horizontal Resistance
First, identify a clear resistance zone where the price repeatedly rejects from approximately the same level. This horizontal resistance acts as a strong barrier where sellers continue defending the market. Multiple reactions at resistance help validate the structure.
Identify Rising Support
Next, observe whether price forms higher lows over time. Connect these lows using an upward-sloping support trendline. This rising support reflects increasing buyer aggression and growing bullish pressure beneath resistance.
Analyze Price Compression
As the pattern develops, notice how the gap between support and resistance gradually narrows. This price compression reflects reduced selling pressure and increasing breakout potential as momentum builds within the structure.
Watch Volume Behavior
Volume typically decreases gradually as the Ascending Triangle matures. This decline often signals temporary consolidation and reduced volatility before expansion occurs. A valid breakout should later show strong volume confirmation.
Wait for Breakout Confirmation
Avoid entering trades too early inside the structure. Instead, wait for:
- A strong breakout candle
- Increased breakout volume
- A confirmed close above resistance
Confirmation helps reduce fakeout risk and improves overall trade reliability.
Structure and Psychology of an Ascending Triangle
Structure of the Ascending Triangle
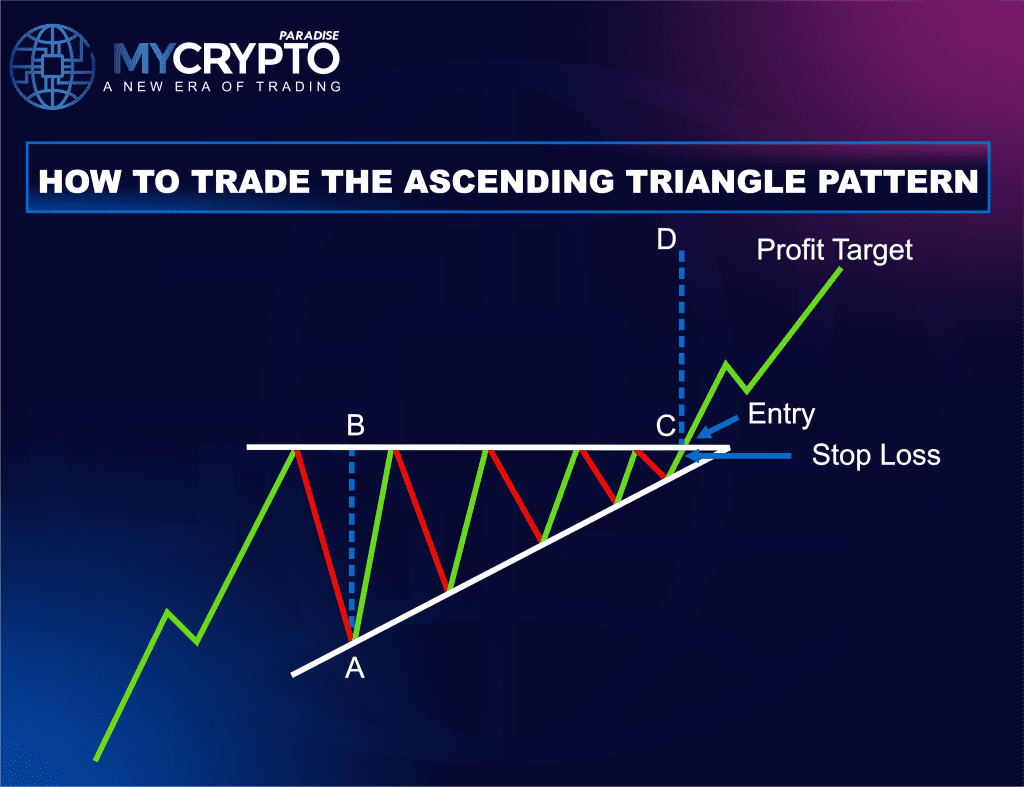
The Ascending Triangle Pattern forms when price repeatedly tests a horizontal resistance zone while simultaneously creating higher lows along a rising support trendline. The flat resistance reflects an area where sellers consistently defend the market, while the rising support shows buyers entering at increasingly higher prices.
As the structure develops, the gap between support and resistance gradually narrows, creating price compression and pressure buildup within the market. This tightening structure often prepares the market for a strong breakout move once resistance is finally broken.
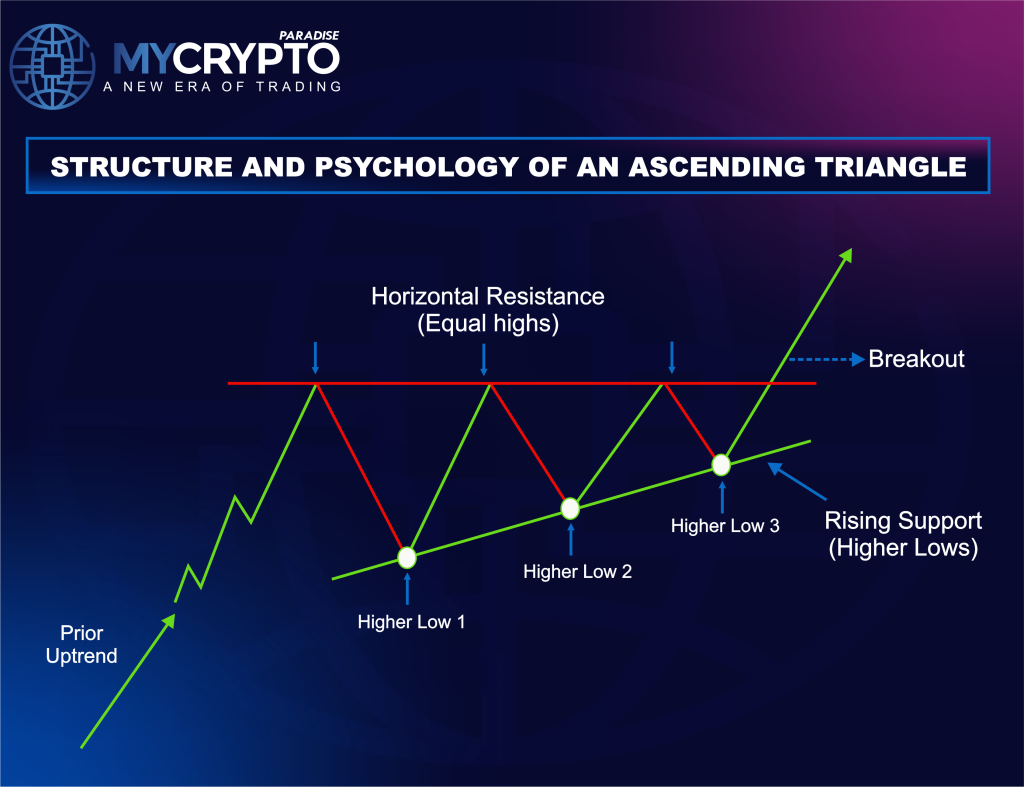
Psychology Behind the Ascending Triangle
The psychology behind the Ascending Triangle reflects a gradual shift in market control from sellers to buyers. Initially, sellers reject the price at resistance, but buyers continue returning with increasing aggression during every pullback. Each higher low signals growing bullish confidence and weakening sell-side pressure.
Over time, buyers absorb available supply near resistance until sellers lose control completely. Once a breakout occurs, momentum traders enter aggressively while short sellers become trapped, often fueling a strong bullish continuation move.
How to Trade the Ascending Triangle Pattern?
Trading the Ascending Triangle successfully requires patience, confirmation, and disciplined execution. Random entries inside the structure often lead to unnecessary losses. The highest-probability approach focuses on breakout confirmation.
Breakout + Retest Strategy
The most reliable method is trading the breakout, followed by a retest of the resistance level.
Entry
Wait for price to:
- Break above horizontal resistance
- Close strongly above the structure
- Show increased volume
Avoid chasing the initial breakout candle immediately. Instead, wait for the market to retest the broken resistance level. If resistance successfully flips into support, enter the trade after bullish confirmation, such as:
- Strong bullish candle
- Rejection wick
- Continuation structure
Stop-Loss Placement
Proper stop-loss placement is essential when trading the Ascending Triangle Pattern, as it helps protect capital while allowing the trade enough room to develop naturally.
Bullish Setup
For bullish breakout trades, the stop-loss is commonly placed:
- Below the retest low
- Or slightly below the rising support trendline
This placement helps protect against failed breakouts and sudden market reversals while still allowing room for normal price volatility during the retest phase. A well-placed stop-loss improves overall trade management and helps maintain a balanced risk-to-reward ratio.
Profit Target
- Measure the maximum height of the triangle from the resistance to the lowest support level.
- Project the same distance upward from the breakout point.
- This method provides a logical and structure-based target instead of emotional or random price expectations.
- It also helps traders maintain disciplined trade management and realistic risk-to-reward ratios.
Volume & Confirmation Guide
Volume plays a critical role when trading the Ascending Triangle Pattern because it validates whether the breakout reflects genuine market participation. Without volume confirmation, breakouts become significantly less reliable.
Volume Behavior
During Formation
- Trading volume usually decreases gradually as price compresses within the Ascending Triangle structure.
- This decline reflects a temporary equilibrium between buyers and sellers before expansion occurs.
- Lower volume during consolidation often signals reduced volatility and pressure buildup inside the market.
- The compression phase allows liquidity to accumulate near key breakout levels.
During Breakout
A valid breakout should typically show:
- Strong volume expansion
- Large momentum candles
- Aggressive buying pressure
- Clear bullish continuation strength
- Increased market participation and momentum confirmation
- Rising breakout volume confirms that buyers are genuinely taking control of the market.
- Weak breakout volume often reflects low conviction and significantly increases the risk of fakeouts or failed breakouts.
Additional Confirmation Signals
RSI Confirmation
- RSI strength above the 50 level supports bullish continuation momentum and increasing buyer strength.
- Rising RSI during a breakout often confirms stronger bullish market participation.
Market Structure Break
- A breakout that creates a new higher high confirms bullish market structure continuation.
- Strong structure breaks often signal the beginning of momentum expansion.
Retest Holding
- If price retests the broken resistance level and successfully holds it as support, breakout reliability increases significantly.
- Strong bullish reactions from the retest zone often provide safer trade entries.
Higher Timeframe Alignment
Ascending Triangle setups aligned with higher timeframe bullish conditions generally produce stronger outcomes, including:
- Daily bullish trends
- Weekly support zones
- Bullish macro market structure
- Higher timeframe alignment increases the probability of successful breakout continuation.
Ascending Triangle vs Other Patterns
Understanding the differences between the Ascending Triangle and other chart patterns helps crypto traders avoid misidentification, improve market analysis, and execute trades with greater precision. Although some structures may appear visually similar, the underlying market psychology and directional bias can be completely different.
Ascending Triangle vs Symmetrical Triangle
A Symmetrical Triangle reflects balanced consolidation where both buyers and sellers remain relatively equal, causing the price to compress between converging trendlines.
The Ascending Triangle, however, carries a stronger bullish bias because buyers continue forming higher lows while resistance remains fixed. This rising support reflects increasing buying pressure and gradual buyer dominance over time.
Ascending Triangle vs Descending Triangle
A Descending Triangle represents bearish pressure through falling resistance and relatively flat support. Sellers become increasingly aggressive as prices continue creating lower highs.
In contrast, the Ascending Triangle reflects the opposite market environment, where buyers gradually gain strength through rising support and repeated pressure beneath resistance.
Ascending Triangle vs Rectangle Pattern
A Rectangle Pattern reflects sideways consolidation between flat support and flat resistance, showing temporary equilibrium between buyers and sellers without a clear directional bias.
The Ascending Triangle, however, reflects growing demand and bullish pressure because buyers continue entering the market at higher prices, creating higher lows beneath resistance.
Ascending Triangle vs Bull Flag
A Bull Flag forms after a strong impulsive rally, followed by a controlled downward or sideways pullback before continuation occurs.
The Ascending Triangle develops differently, as price gradually compresses beneath horizontal resistance while support continues rising upward. Instead of a pullback structure, it reflects pressure buildup and buyer accumulation before breakout expansion.
Common Mistakes When Trading the Ascending Triangle
Entering Too Early
Many crypto traders anticipate the breakout before proper confirmation occurs. However, entering too early increases exposure to fakeouts, sudden volatility, and failed breakout attempts. Waiting for a confirmed breakout improves trade reliability significantly.
Ignoring Volume
Breakouts without strong volume confirmation often lack momentum and become more vulnerable to failure. A healthy breakout should typically show rising volume and strong buyer participation to confirm bullish strength.
Poor Stop-Loss Placement
Placing stop-losses too close to breakout levels can lead to unnecessary stop hunts caused by normal market volatility. On the other hand, excessively wide stops reduce overall risk-to-reward efficiency and increase potential losses.
Chasing Breakouts Emotionally
Entering trades after large breakout candles without waiting for confirmation often leads to poor entries and emotional decision-making. Disciplined traders remain patient and wait for healthier confirmation or retest opportunities.
Ignoring Overall Market Conditions
Even strong Ascending Triangle setups can fail during weak macro market conditions. Before entering trades, traders should always analyze:
- Bitcoin direction
- Overall market sentiment
- Higher timeframe structure
Conclusion
The Ascending Triangle Pattern is one of the most respected bullish continuation structures in crypto trading. Its rising support trendline and repeated resistance tests reflect increasing buyer strength and weakening sell-side pressure. As price compresses within the structure, breakout potential continues building, often leading to strong momentum-driven moves after confirmation.
However, success with this pattern is not about predicting breakouts blindly. It is about waiting for confirmation, understanding market psychology, and executing with discipline and proper risk management. Crypto traders who focus on breakout validation, volume confirmation, and structured execution can take advantage of its high-probability opportunities.
At ParadiseFamilyVIP🎖️, traders are trained to handle structures like the Ascending Triangle with professional precision and discipline. From identifying key breakout zones to executing confirmation-based trades, every step is designed to build a structured and professional trading mindset.
👉 Join ParadiseFamilyVIP🎖️ to trade crypto markets with confidence, structure, and precision.
Ascending triangle pattern FAQ
Is an ascending triangle bullish or bearish?
An ascending triangle is generally a bullish pattern. The flat resistance and rising support show buyers entering at higher prices and absorbing supply, which often leads to an upward breakout, especially during continuation phases.
How do you confirm an ascending triangle breakout?
Wait for a strong candle that closes above the horizontal resistance on increased volume. Many traders then look for a retest where the old resistance flips into support before entering.
Where do you set a stop-loss when trading an ascending triangle?
A common placement is just below the retest low or slightly under the rising support trendline. This helps protect against failed breakouts while leaving room for normal volatility during the retest.
How do you set a profit target for an ascending triangle?
Measure the maximum height of the triangle from resistance down to the lowest support point, then project that distance upward from the breakout level. This gives a structure-based target rather than a random one.
Crypto trading involves substantial risk of loss. This article is educational and is not financial advice. Past performance does not guarantee future results. Always do your own research.
What is different here
Most guides stop at the theory. The MyCryptoParadise team shares the live trades, and the reasoning behind each one, inside ParadiseFamilyVIP. Everything here is education, not financial advice.
Crypto trading involves substantial risk and is not suitable for everyone. Nothing here is financial advice; it is education only. Never risk more than you can afford to lose.


Join the discussion
No comments yet. Pro Paradiser members, share how you are reading this.