


Chart Pattern Definition
In short
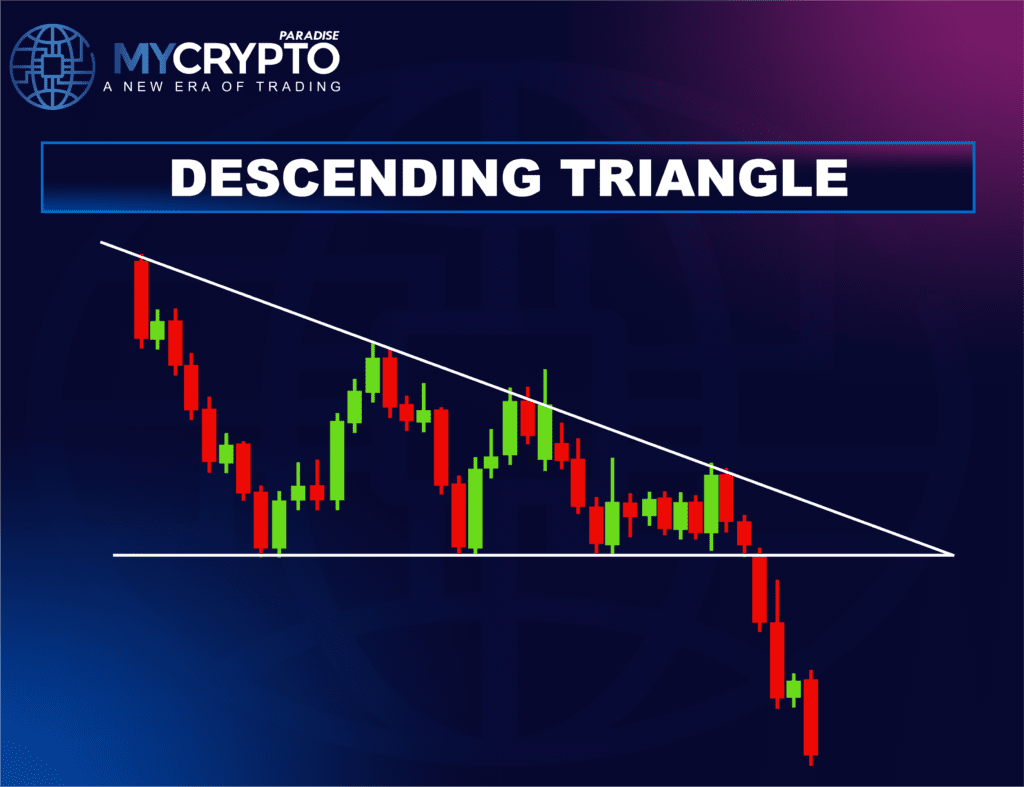
A descending triangle is a bearish chart pattern characterized by a flat horizontal support line and a downward-sloping resistance line of lower highs. This pattern indicates that sellers are increasingly dominant, often signaling a potential breakdown or continuation of a downtrend in crypto markets.
- The Descending Triangle Pattern is a bearish pattern that signals a potential breakdown or continuation within a downtrend in crypto markets.
- Crypto Traders should always wait for a breakout confirmation and combine it with volume, support/resistance, and disciplined risk management to improve success rates.
- While the Descending Triangle Pattern provides valuable insights, its reliability depends on broader factors, including technical indicators, overall market conditions, and external news events.
The Descending Triangle pattern is a classic bearish pattern that professional crypto traders often find in the market. Catch it early, and you’ll get ahead of the crowd, ready to trade the next wave of volatility instead of scrambling to catch up.
This guide is part of our MCP University FREE advanced learning series for serious crypto traders. You’ll see how to spot, confirm, and trade the Descending Triangle pattern with real clarity, discipline, and the kind of precision the pros use.
Introducing the Descending Triangle Pattern
A Descending Triangle Pattern forms when prices keep showing lower highs but keep bouncing off the same support level. Sellers are getting more aggressive, and buyers are just barely hanging on. You see the price hit that support over and over, but each bounce gets weaker. Sellers are basically tightening the screws.
Every time the price fails to climb as high as before, it’s a clear sign that sellers are gaining the upper hand. Once the price finally drops below that support, especially if trading volume picks up, sellers really take control fast.
You’ll usually spot this pattern during a steady downtrend, or right in the middle of a bigger bearish move. It’s pretty much a sign that buyers are fading, and sellers are building up pressure for a bigger move down.
As this pattern develops, it’s one of the first hints that the downtrend’s about to continue. For crypto traders, it’s a red flag; get ready for a breakdown and maybe some sharper price drops before the rest of the market catches on.
How to Recognize a Descending Triangle Pattern?
Spotting a Descending Triangle Pattern early gives crypto traders a real edge. When you catch it in time, you’re ahead of the crowd & ready for a possible drop before everyone else catches on. This pattern doesn’t just pop up out of nowhere. It builds step by step, showing both the technical shifts and the changing mood in the market as sellers start to take control.
Downtrend Context
Most descending triangles show up when the market’s already under pressure, and sellers keep pushing prices down. They fight hard to defend lower highs, which just drags the mood further into the negative.
Horizontal Support Base (Flat Lower Trendline)
Next, the price keeps bouncing off the same level, but each bounce gets weaker. Buyers just can’t seem to get it off the ground anymore.
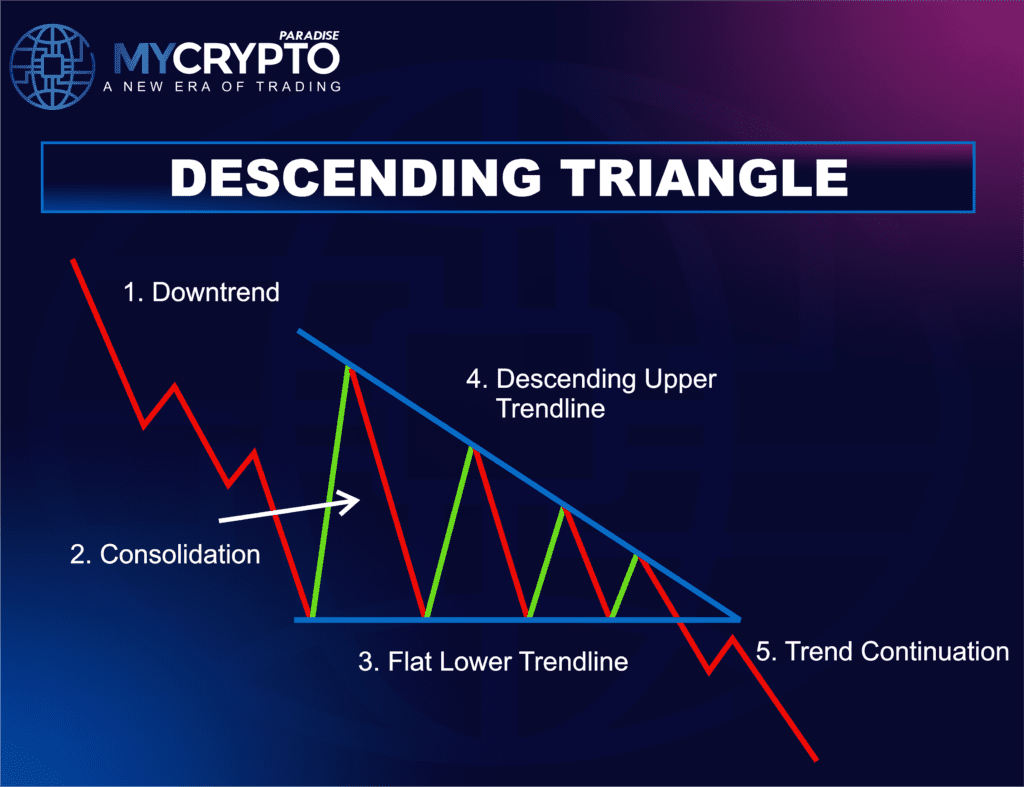
Descending Resistance Line (Upper Trendline)
Meanwhile, those highs keep dropping, and you’ll see a descending resistance line forming above. Each little rally fades out sooner than the last as sellers get more aggressive and start stepping in earlier.
Volume Contraction
Pay attention to volume, too. As the pattern develops, volume usually shrinks. The market’s stuck, nobody’s sure what comes next, and the range tightens up. But that can’t last forever. This kind of quiet almost always comes before a big move.
Bearish Breakdown
Then comes the big moment: the price breaks down below that horizontal support, and volume spikes. That’s your confirmation, the descending triangle has played out, and the bears are back in charge.
Retest Confirmation
After the breakdown, the price often comes back up to test the old support (which now acts as resistance). This retest is a second chance for crypto traders to get in, offering a bit more clarity and a good spot to manage risk before the move continues lower.
Is the Descending Triangle Bullish or Bearish?
The Descending Triangle Pattern usually signals a bearish move, but its real meaning depends on where it shows up in the bigger market cycle. If you know the context, you’re much better equipped to read what’s going on and plan your trades around the market’s mood.
Bearish Continuation Triangle
Most of the time, a descending triangle pops up right in the middle of a downtrend. Sellers are still driving the show, and buyers just can’t hold the line at support. As the price keeps squeezing between falling resistance and flat support, selling pressure builds up. When the price finally breaks through support with heavy volume, you get a clear sign: the bearish trend is about to keep rolling.
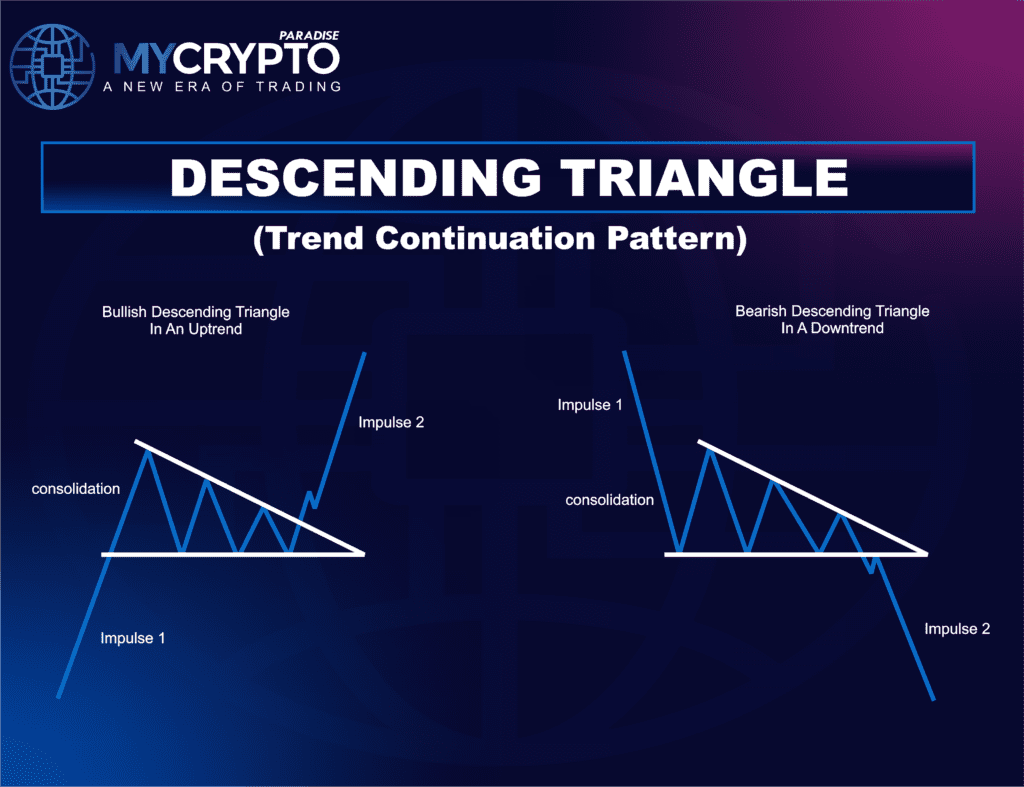
Bullish Continuation Triangle
You’d usually expect a descending triangle to show up in a downtrend, but sometimes, it pops up right in the middle of a strong uptrend. Here’s what’s really happening: buyers are still running the show overall, but sellers keep throwing up a wall of resistance that slopes downward.
As the price gets squeezed tighter between eager buyers and that stubborn resistance, tension ramps up. Then, once the price finally blasts through that descending line on heavy volume, it’s a clear sign that the pause is over, and the bulls are back in charge, ready to push the trend higher.
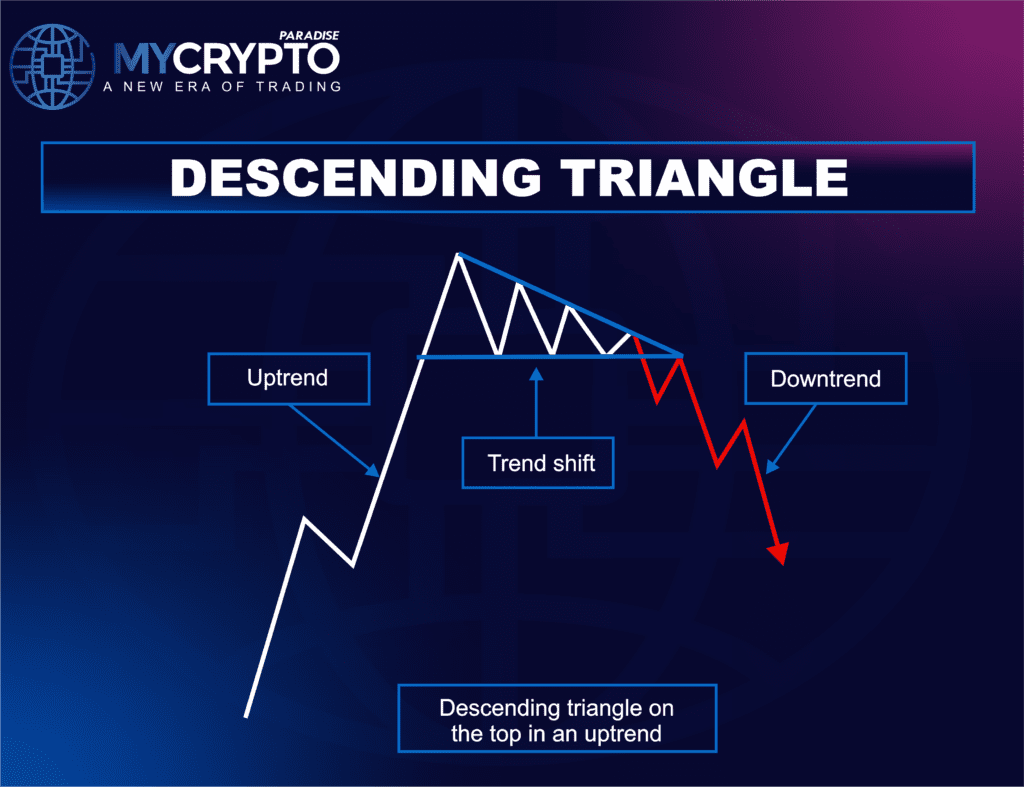
Bearish Reversal Triangle
Sometimes, though, this pattern forms at the top of the Uptrend. That’s when the triangle means something different; it’s a warning that buyers are running out of steam and price is preparing for a reversal. Lower highs stack up against a stubborn support level. Once the price breaks down, it marks a real shift; bulls are out, and bears are taking over.
How Reliable Is the Descending Triangle Pattern?
Out of all the bearish continuation patterns, the Descending Triangle is one of the most reliable, especially if volume picks up at the breakdown and the broader structure backs it up.
Statistical Performance
Numbers back this up. Backtests and market data show the pattern breaks downward about 65-75% of the time, and odds get even better if it lines up with the main trend. That track record makes it a go-to bearish setup for crypto traders.
Key Conditions That Boost Reliability
- You’ll usually see this pattern in a clear downtrend, which just adds to the bearish case.
- Volume tends to shrink as the triangle forms, then jumps sharply when the price breaks down.
- Momentum indicators often show buyers getting weaker and lower highs against flat support; that says it all.
- If the breakdown happens before the price gets too squeezed (extremely) inside the triangle, the move is usually stronger.
When these pieces come together, the Descending Triangle gives a high-probability signal for more downside moves. Still, in choppy or thin markets, fake breakdowns can happen, so always wait for confirmation, don’t just assume.
How to Trade the Descending Triangle Pattern?
Trading this pattern isn’t about chasing every setup. It’s about patience, confirmation, and tight risk control. Here’s how crypto traders handle it:
Entry Strategy
Breakdown Entry: Jump in short right after the price closes solidly below support, especially if volume surges. That’s your green light because it means sellers are in charge.
Pullback Entry: If you want to play it safer, wait for the price to come back and retest the old support (now resistance) after the breakdown. It’s a more cautious entry and usually gives you a better risk-to-reward ratio.
Stop-Loss Placement
Set your stop-loss just above the last lower high inside the triangle. If the trade goes against you and the price snaps back above support, this stop keeps your losses in check.
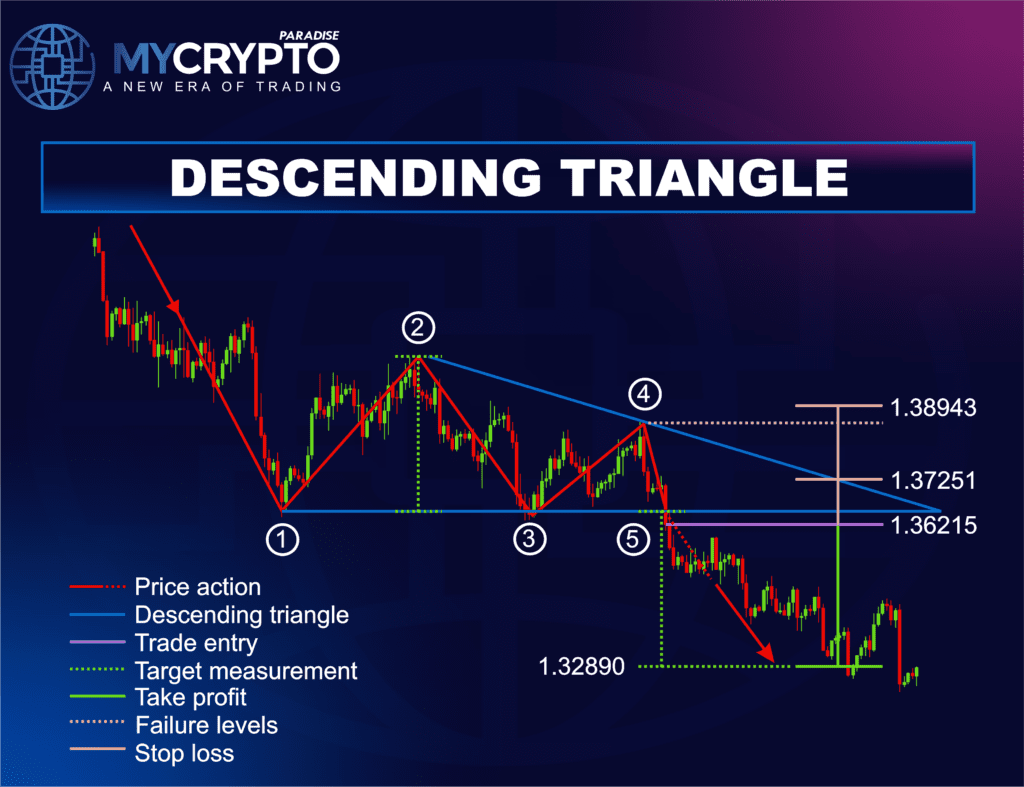
Take-Profit Targets
There are a couple of popular ways to set targets:
- Measure the triangle’s height (the gap between the highest point and the horizontal support), then project that distance down from the breakdown point.
- Or, look for big support zones, previous swing lows, or key Fibonacci levels to lock in profits, either partially or all at once.
With confirmed entries and well-planned exits, traders can tackle Descending Triangle setups with a solid plan and the discipline that keeps performance steady over the long run.
Descending Triangle Versus Similar Chart Patterns
Crypto trading is full of bearish patterns that look alike, but the Descending Triangle Pattern stands out. It’s clean and orderly. You’ll spot it during strong selling pressure, and it gives traders a much clearer read on when a breakdown is coming.
Descending Triangle Versus Descending Channel
- A Descending Channel’s pretty straightforward: prices drift lower between two parallel, sloping lines. It’s a steady grind down, but there’s no clear clue about when things will really fall apart.
- Now, a Descending Triangle is different. You get a flat support level that keeps getting tested, and each bounce produces a lower high. Buyers keep defending the same spot, but sellers push harder every time. That builds real tension, and when it breaks, it tends to be sharp and obvious.
- Because the Descending Triangle is so well-defined, traders can plan entries, stop losses, and targets much more precisely than when dealing with a broad, drifting channel.
Rising Wedge Versus Descending Triangle
- A Rising Wedge can initially deceive people. You see higher highs and higher lows, so it looks bullish, but the range is tightening, and the move often runs out of steam. The direction of the breakout isn’t always clear unless you get extra confirmation.
- With a Descending Triangle, the bearish bias is front and centre. Flat support, lower highs, sellers are clearly taking control. When that support finally gives way, the move usually comes stronger.
- That’s why most crypto traders look for Descending Triangles when the market turns bearish. The breakdown level is obvious, so there’s less room for doubt compared to a Rising Wedge.
Descending Triangle Versus Bear Flag
- A Bear Flag pops up after a sharp drop, then you get a short-lived, slightly rising or sideways pause. It’s just a breather before the next leg down.
- A Descending Triangle takes its time. Instead of a steep flagpole, you see steady pressure against support as the highs keep dropping. This slow squeeze builds up real breakout energy.
- Since the support level in a Descending Triangle gets tested again and again, when it finally breaks, the move can get wild, which is exactly what traders want for planning structured trades.
Common Mistakes to Avoid With the Descending Triangle Pattern
Spotting a Descending Triangle is a great start, but it’s easy to trip up. Even small mistakes can turn a high-probability setup into an unnecessary loss.
Entering Before the Breakdown
Plenty of traders short too early, thinking the support will break any second. But until you see a clear close below that level, there’s no real signal. Getting in too soon leads to false breaks and frustrating losses.
Ignoring Momentum and Breakdown Strength
Not every support break leads to a real move. If a price just pokes below support with weak volume or a half-hearted candle below, it’s probably a fake-out. You want strong follow-through and real momentum behind the move.
Forcing the Pattern on Charts
Just seeing lower highs isn’t enough. You need a clear, horizontal support that gets tested multiple times. Trying to force a Descending Triangle onto a messy chart just sets you up for failure.
Ignoring the Higher Timeframe Context
Trading a Descending Triangle against a strong uptrend on higher timeframes doesn’t work well. This pattern shines when it lines up with a broad bearish structure and overall market weakness.
Poor Risk Management
Stops that are too tight, too wide, or outsized positions can wreck your capital fast. Always set your invalidation above the last lower high and know your risk before you jump in.
Overlooking Market Conditions and News
Big news or sudden volatility can blow up any technical setup in a heartbeat. If you ignore the larger market situation, you’re asking to get blindsided, even if the pattern looks perfect.
Conclusion
The Descending Triangle is one of the most reliable bearish patterns in crypto. It shows buyers are losing ground, and a breakdown is likely. When you see lower highs, a flat support, rising volume, and a clear breakdown, it’s one of the high-probability short setups out there.
But consistency isn’t just about spotting the pattern. It’s about nailing the timing, setting smart stops, and managing your risk. No pattern provides a sure shot, but with structure and discipline, the Descending Triangle gives traders a real edge in volatile markets.
At ParadiseFamilyVIP🎖️, we help traders sharpen these skills in real time, combining technical precision, market psychology, and structured risk control for long-term performance.
👉 Join ParadiseFamilyVIP🎖️ today and start trading with professional structure and discipline. Membership slots are limited. Secure your access or join the waiting list to stay prepared for the next major breakdown opportunity.
Descending triangle pattern FAQ
Is a descending triangle bullish or bearish?
It is usually bearish, most often a continuation pattern within a downtrend. Its meaning depends on context: in a strong uptrend it can break upward as a bullish continuation, and at a market top it can act as a bearish reversal.
How reliable is the descending triangle pattern?
Backtests show it breaks downward roughly 65 to 75 percent of the time, and the odds improve when it aligns with the main trend and volume spikes on the breakdown. In choppy or thin markets, fake breakdowns can occur, so confirmation matters.
How do you confirm a descending triangle breakdown?
Wait for the price to close below the horizontal support, ideally on a clear volume spike. A retest, where price returns to the old support that now acts as resistance, offers a second confirmation point.
Where do you place a stop-loss when trading it?
Set the stop-loss just above the last lower high inside the triangle. If price snaps back above support and invalidates the breakdown, this keeps the loss contained.
Crypto trading involves substantial risk of loss. This article is educational and is not financial advice. Past performance does not guarantee future results. Always do your own research.
What is different here
Most guides stop at the theory. The MyCryptoParadise team shares the live trades, and the reasoning behind each one, inside ParadiseFamilyVIP. Everything here is education, not financial advice.
Crypto trading involves substantial risk and is not suitable for everyone. Nothing here is financial advice; it is education only. Never risk more than you can afford to lose.


Join the discussion
No comments yet. Pro Paradiser members, share how you are reading this.