


Chart Pattern Analysis
In short
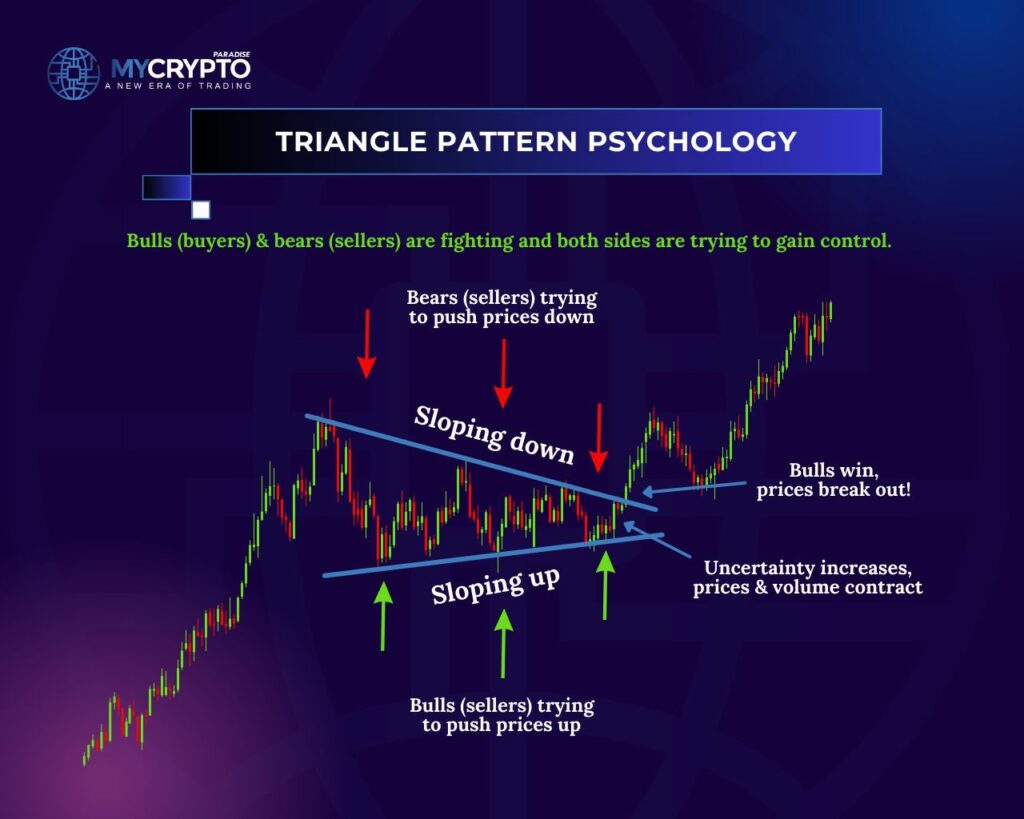
A symmetrical triangle is a consolidation chart pattern formed by two converging trend lines: an upper line connecting lower highs and a lower line connecting higher lows. It signals indecision as buyers and sellers tighten the price range, often resolving with a breakout in either direction.
Symmetrical triangles are a powerful technical analysis pattern that traders use to predict future price movements in the cryptocurrency market. These patterns can help traders identify potential breakouts and breakdowns, as well as my provide valuable insights into market sentiment and momentum.
In this article, we’ll take a closer look at symmetrical triangles in crypto trading, including what they are, how they form, and how traders use them to make informed trading decisions.
What is a Symmetrical Triangle?
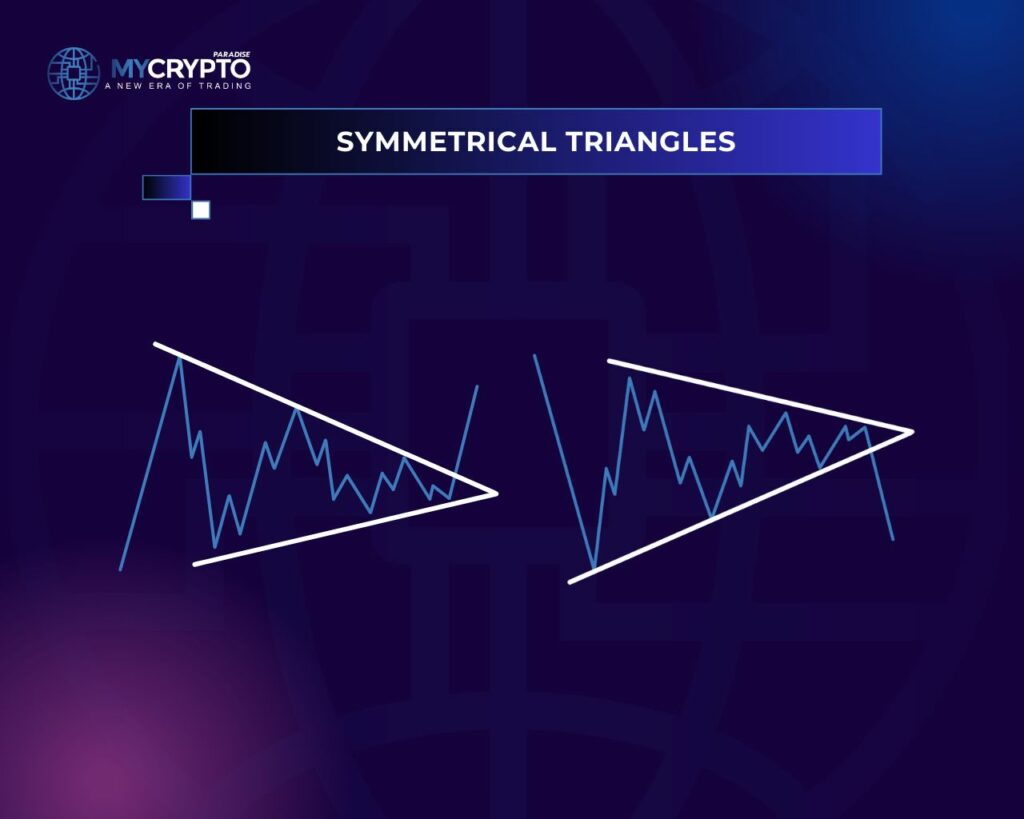
A symmetrical triangle is a charting pattern that forms when the price of an asset is trading in a tightening range, creating a triangle shape on the chart. The pattern is formed by two trend lines that converge at a point, with each line representing the upper and lower bounds of the price movement.
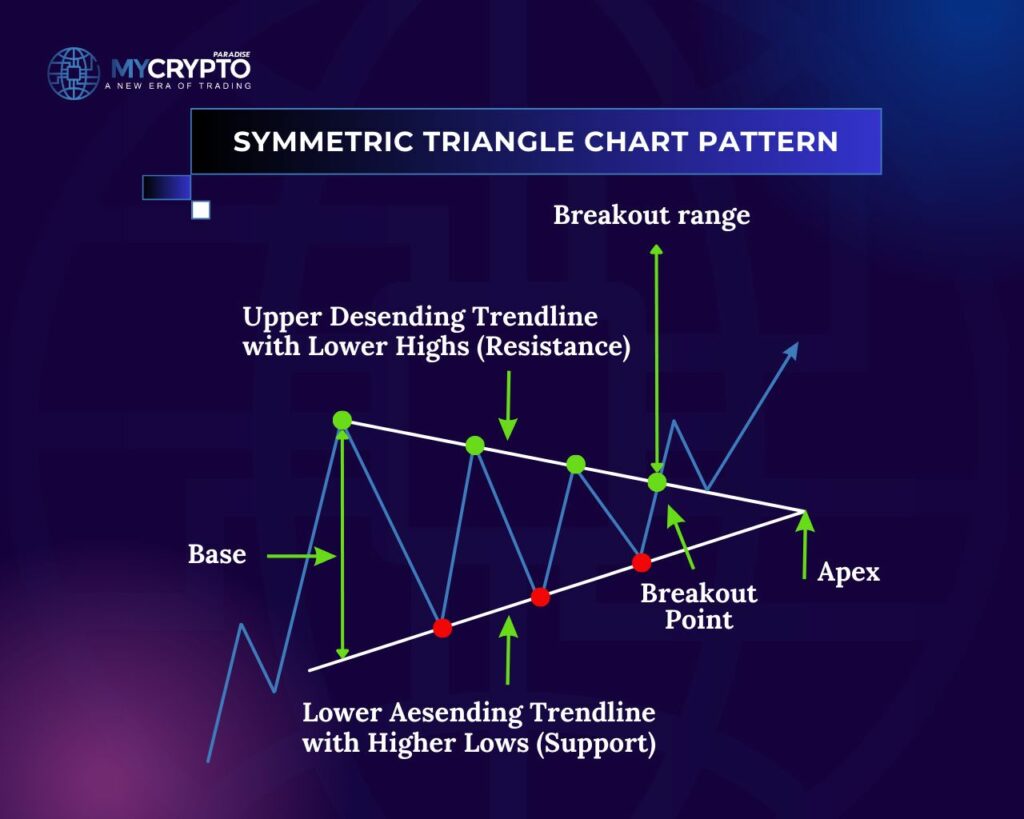
The upper trend line is formed by connecting the highs of the price movement, while the lower trend line is formed by connecting the lows. As the price movements become more confined within the triangle, the trend lines converge towards the apex, where they meet.
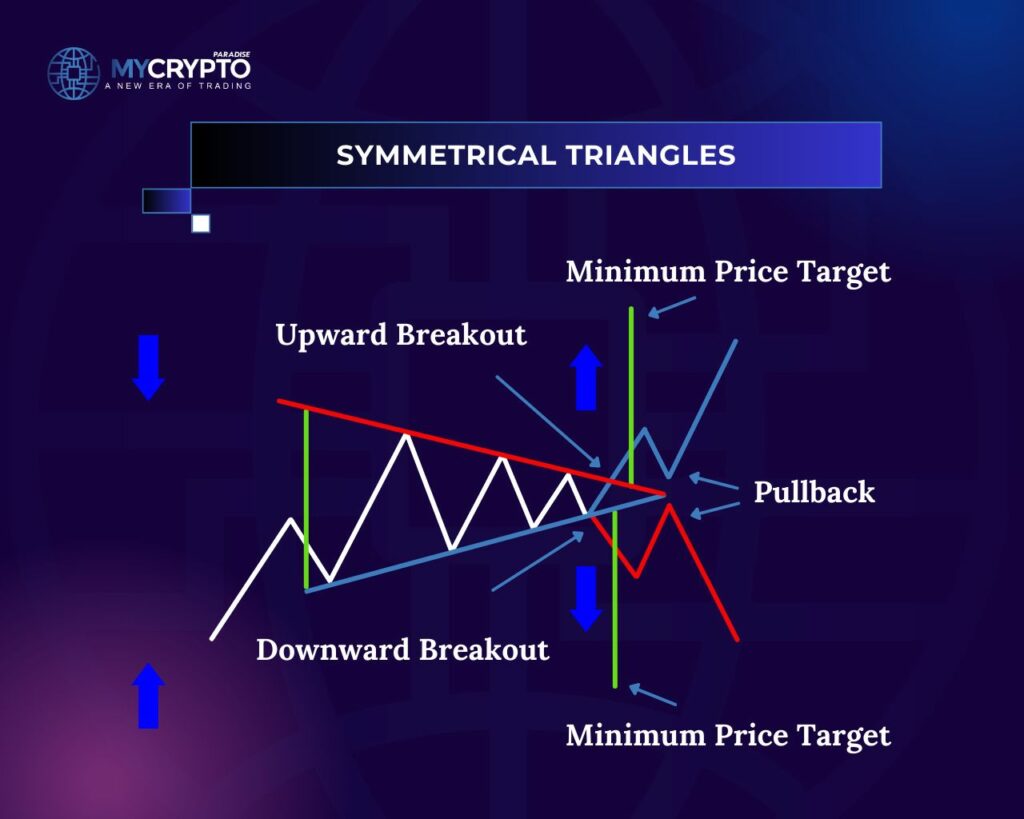
Symmetrical triangles can be either bullish or bearish, depending on the direction of the breakout. A bullish symmetrical triangle occurs when the price is trending upwards into the apex, and a breakout above the upper trend line signals a continuation of the upward trend. In contrast, a bearish symmetrical triangle occurs when the price is trending downwards into the apex, and a breakout below the lower trend line signals a continuation of the downward trend.
How do Symmetrical Triangles Form?
Symmetrical triangles form when the market is experiencing a period of indecision or consolidation, as buyers and sellers battle for control. During this time, the price movements become increasingly confined within a narrowing range, creating the characteristic triangle shape.
As the price movements become more confined, the trend lines begin to converge towards the apex of the triangle. This convergence indicates that the range of price movements is becoming increasingly narrow, and that a breakout is likely to occur in the near future.
The longer the symmetrical triangle pattern continues, the more likely it is that a significant breakout or breakdown will occur. Traders often watch for these patterns to form as a signal of potential market volatility and an opportunity to make a profitable trade.
How Do Traders Use Symmetrical Triangles in Crypto Trading?
Traders use symmetrical triangles in a variety of ways to make informed trading decisions. One popular approach is to wait for a breakout or breakdown to occur, and then enter a trade in the direction of the breakout.
For example, if a trader identifies a bullish symmetrical triangle forming on the chart of a cryptocurrency, they may wait for a breakout above the upper trend line before entering a long position. Similarly, if a bearish symmetrical triangle is forming, the trader may wait for a breakdown below the lower trend line before entering a short position.
Traders may also use symmetrical triangles to identify potential support and resistance levels. The upper and lower trend lines of the triangle can serve as important levels of support and resistance, as they represent the boundaries of the price movement. If the price breaks through one of these trend lines, it may indicate a shift in market sentiment and a potential trading signal
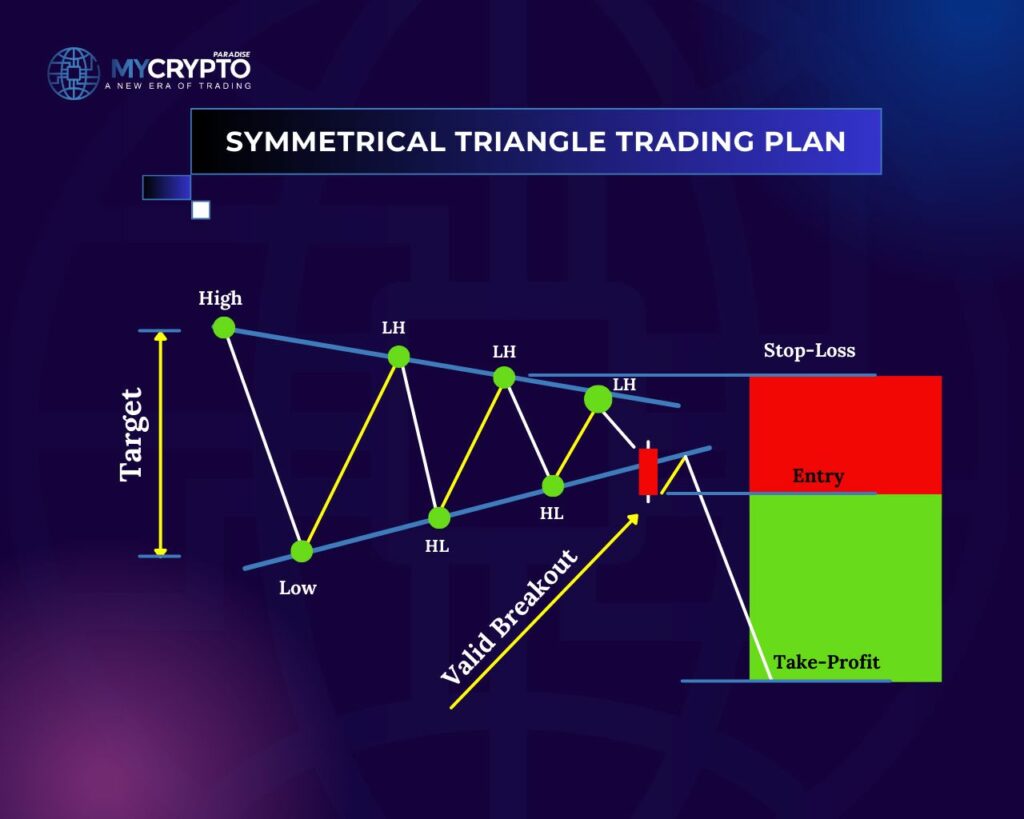
Another way that traders use symmetrical triangles is to identify potential price targets. The height of the triangle can be used to estimate the potential price movement following a breakout or breakdown. Traders measure the distance between the highest and lowest points of the triangle and then add this amount to the breakout point to estimate the potential price target.
However, it’s important to note that while symmetrical triangles can be a powerful tool in crypto trading, they are not infallible. Breakouts and breakdowns can often be false signals, and traders should always use other indicators and analysis techniques to confirm their trading decisions.
How Traders Can Identify False Signals When Trading Symmetrical Triangle
While symmetrical triangles can be a powerful tool in predicting future price movements and identifying potential trading opportunities, false signals can occur. False signals can lead to traders entering a trade that doesn’t follow through the expected direction or experiencing losses.
Here are some ways traders can identify false signals when using symmetrical triangles:
1. Low Trading Volume: One of the ways to identify false signals is to look at the volume of trading. Trading volume is an important indicator of market sentiment, and a lack of volume during a breakout or breakdown can indicate a false signal. When there is low trading volume during a breakout or breakdown, it is possible that the move was not initiated by a significant number of market participants, and the move may not be sustained.
2. Price Action after the Breakout: Traders should also pay attention to the price action after the breakout or breakdown. If the price quickly retraces back into the triangle, it may indicate a false signal. In such cases, the price may be consolidating within the triangle for a longer period before finally breaking out or breaking down.
3. Confirming Indicators: Traders should use other technical analysis indicators to confirm the signals from the symmetrical triangle. For instance, if the RSI (Relative Strength Index) or MACD (Moving Average Convergence Divergence) indicators do not confirm the signal from the symmetrical triangle, it may indicate a false signal.
4. Timeframe: Traders should look at the timeframe of the chart they are analyzing. A breakout or breakdown on a shorter timeframe may not be as significant as one on a longer timeframe. Therefore, traders should always consider the timeframe of the chart they are analyzing and the significance of the breakout or breakdown.
What are the Probabilities that a Symmetrical Triangle Pattern will Result in a Profitable Trade?
While trading symmetrical triangles can be a profitable trading strategy in crypto trading, it is important to note that no trading strategy can guarantee profits. However, there are several steps traders can take to increase their chances of making profitable trades when using symmetrical triangles:
1. Identify the Symmetrical Triangle: The first step is to identify the symmetrical triangle pattern on the chart. This involves drawing trend lines that connect the higher highs and lower lows to form the triangle pattern. It is important to ensure that the pattern is valid and not a false signal.
2. Determine the Direction of the Breakout: Traders should determine the direction of the breakout, which can be either bullish or bearish. A bullish breakout occurs when the price breaks above the upper trend line, while a bearish breakout occurs when the price breaks below the lower trend line.
3. Wait for a Confirmation: Traders should wait for confirmation of the breakout before entering a trade. This can involve waiting for the price to close above or below the trend line on a significant volume. Traders can also use other technical indicators to confirm the signal.
4. Set Stop-Loss Orders: Setting stop-loss orders is an essential part of managing risk in trading. Traders should place stop-loss orders below the breakout point to limit potential losses in case the trade goes against them.
5. Set Profit Targets: Traders should set profit targets based on the height of the triangle pattern. This involves measuring the distance between the highest and lowest points of the triangle and adding it to the breakout point to estimate the potential price target.
6. Manage Risk: Risk management is critical in trading, and traders should never risk more than they can afford to lose. Traders should also use position sizing to manage their risk and ensure that they are not overexposed to a single trade.
7. Monitor the Trade: Traders should monitor the trade carefully and be prepared to adjust their strategy if market conditions change. It is also important to take profits or cut losses when necessary.
How to Combine Symmetrical Triangles with Other Technical Indicators
Combining technical indicators with symmetrical triangle signals in crypto trading can help traders to confirm the signals and increase their chances of making profitable trades. Here are some examples of technical indicators that traders can use in combination with symmetrical triangle signals:
1. Moving Averages: Moving averages are widely used in technical analysis to identify trends and support and resistance levels. Traders can use moving averages to confirm the direction of the breakout from a symmetrical triangle. For example, if the price breaks out above the upper trend line of the symmetrical triangle and the 50-day moving average is also trending higher, this can provide additional confirmation of a bullish signal.
2. Relative Strength Index (RSI): The RSI is a momentum indicator that measures the strength of a trend and can help traders to determine if an asset is overbought or oversold. Traders can use the RSI to confirm the breakout from a symmetrical triangle. For example, if the RSI is above 70 when the price breaks out above the upper trend line, this can indicate that the asset is overbought and may be due for a correction.
3. Bollinger Bands: Bollinger Bands are a volatility indicator that consists of a moving average and two standard deviation bands. Traders can use Bollinger Bands to confirm the breakout from a symmetrical triangle by looking for the price to break out above the upper band or below the lower band.
4. Fibonacci Retracement Levels: Fibonacci retracement levels are a popular tool used in technical analysis to identify potential support and resistance levels. Traders can use Fibonacci retracement levels to identify potential price targets based on the height of the symmetrical triangle. For example, if the height of the triangle is $10 and the price breaks out above the upper trend line at $20, the 161.8% Fibonacci retracement level would be at $30.
5. MACD: The Moving Average Convergence Divergence (MACD) is a momentum indicator that can help traders to identify trend reversals and confirm the breakout from a symmetrical triangle. Traders can look for bullish or bearish crossovers of the MACD line and signal line to confirm the direction of the breakout.
Conclusion
Symmetrical triangles are a popular charting pattern used by cryptocurrency traders to predict future price movements and identify potential trading opportunities. These patterns form when the price movements of an asset become increasingly confined within a narrowing range, creating a characteristic triangle shape on the chart.
The technical knowledge in this article is valuable but not sufficient for long-term profitability on its own. While it can give you an edge, transforming it into consistent success over the next 3+ years requires proper trading strategies and tactics.
At ParadiseFamilyVIP, we combine technical analysis, on-chain data, sentiment monitoring, and whale psychology with proven trading methods to deliver accurate crypto signals and portfolio management that ensure sustainable results.
The ParadiseTeam shares all trades we make, including exit points and portfolio allocations, so you can replicate our ROI with ease.
We provide complete transparency, trading with our own capital and sharing daily insights to help you improve. If you’re ready to advance as a trader, joining our inner circle is the next step. Seats are limited, so join the waiting list if needed.
Our premium service is ideal for traders with sufficient capital. Beginners can start with our FREE Telegram channels to build their foundation.
To check ParadiseFamilyVIP membership availability, click here: https://mycryptoparadise.com/paradisefamilyvip/
We trade exclusively on trusted exchanges that offer up to 35% fee discounts and deposit bonuses for members. These platforms are secure and trusted by the ParadiseTeam 💙🌴
MEXC: https://www.mexc.com/landings/MyCryptoParadise?handleDefaultLocale=keep&inviteCode=1nqGL
BINGX: https://bingx.com/en/act/chanelActivityStyle3/PCF833J1/
KCEX: https://www.kcex.com/register?inviteCode=MYCRYPTOPARADISE
BITUNIX: https://www.bitunix.com/register?vipCode=3q22
Both BITUNIX and KCEX are licensed and compliant in the USA ✅💰
Symmetrical Triangles FAQ
What is a symmetrical triangle pattern?
It is a chart pattern where price trades in a tightening range, with an upper trend line connecting the highs and a lower trend line connecting the lows. The two lines converge toward an apex, reflecting market indecision before a likely breakout.
Is a symmetrical triangle bullish or bearish?
It can be either, depending on the breakout direction. A close above the upper trend line suggests a continuation higher, while a close below the lower trend line suggests a continuation lower. The pattern itself is neutral until price resolves.
How do you set a price target from a symmetrical triangle?
Measure the height of the triangle, the vertical distance between its highest and lowest points, then add that distance to the breakout point for an upside target or subtract it for a downside target. This is an estimate, not a certainty.
How do you avoid false breakouts in a symmetrical triangle?
Watch for low volume on the breakout, price quickly retracing back inside the triangle, and confirmation from indicators like RSI or MACD. Checking a longer timeframe and waiting for a confirmed close beyond the trend line also reduces false signals.
Crypto trading involves substantial risk of loss. This article is educational and is not financial advice. Past performance does not guarantee future results. Always do your own research.
What is different here
Most guides stop at the theory. The MyCryptoParadise team shares the live trades, and the reasoning behind each one, inside ParadiseFamilyVIP. Everything here is education, not financial advice.
Crypto trading involves substantial risk and is not suitable for everyone. Nothing here is financial advice; it is education only. Never risk more than you can afford to lose.


Join the discussion
No comments yet. Pro Paradiser members, share how you are reading this.