


In short: Open interest shows whether positions are being opened or closed. The long/short ratio shows which side the crowd is on. Price shows which side is pressing. Each one alone can fool you. Read the three together, against what is usual for that market. Then you can tell new money from old money and spot a crowd arriving late.
Most traders glance at one positioning number and stop there. A rising long/short ratio looks bullish, and rising open interest looks like strength. Both can mislead you on their own, because each answers only part of the question.
MyCryptoParadise is a professional crypto signals and trading education service operating since 2016. This MCP University FREE class reads positioning the way the ParadiseTeam does. Open interest first, then the crowd’s side, then price, always against what is normal for that market.
What does open interest tell you?
Open interest is the number of futures positions still open in a market. It rises when new positions open and falls when positions close. Every contract has a long side and a short side, so open interest never shows direction on its own. It shows whether money is arriving or leaving.
Think of it as the fuel gauge of a move. A rise with open interest climbing is being fed by new positions. A rise with open interest falling is running on positions being closed. Investopedia’s open interest definition covers the mechanics, and our lesson on what open interest tells you about a move’s fuel goes deeper.
What does the long/short ratio tell you?
The long/short ratio compares how many accounts are long with how many are short. It counts accounts, not money. One account can hold the size of a hundred others, so the ratio shows how the crowd leans, never how much each side has invested. It is a headcount, not a weighing scale.
That headcount has a trap. A rising ratio looks like new long accounts arriving, but it also rises when short accounts simply close. The ratio alone cannot tell the two apart. Open interest can, because new longs add positions while departing shorts remove them.
Our live BTC long/short ratio page shows that headcount on Bitcoin right now.
Why do you need both, together with price?
Because each one fills the gap the other leaves. Open interest says whether money is arriving or leaving. The ratio says which side the crowd is on. Price says which side is pressing. The same change in positioning means something different in a rise than in a fall, so price is the third piece.
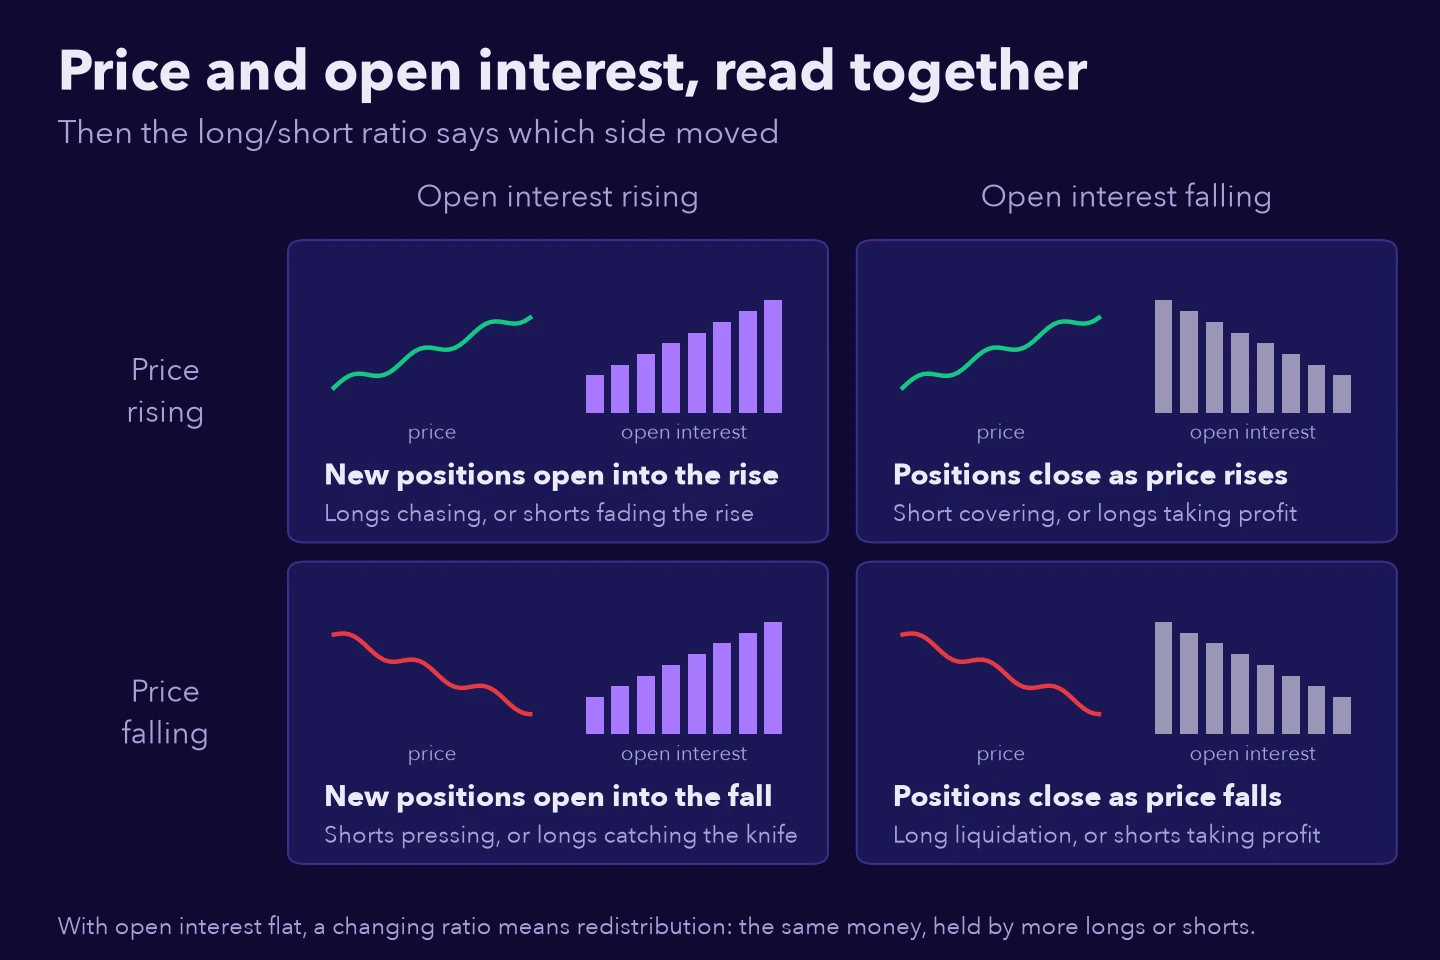
Put open interest and price together first. When both rise, new positions are opening into the move. When price rises while open interest falls, positions are closing into strength: shorts covering, or longs taking profit. The same logic works on the way down, and the long/short ratio then tells you which side did the moving.
What are the ten positioning situations?
Add the crowd’s side to price and open interest, and each mix gets a name. These ten cover almost everything a market does. They are inferences, not identities: no chart knows who is trading. They describe what the crowd, the open positions and price did together on that candle.
- Longs chasing: new long accounts arrive while price rises. Late if the crowd is already long-heavy.
- Shorts fading the rise: new short accounts bet against a rise.
- Short covering: price rises while shorts close, so new positions are not feeding the rise.
- Longs taking profit: long accounts close into strength.
- Longs catching the knife: new long accounts keep arriving while price falls.
- Shorts pressing: new short accounts keep arriving while price falls.
- Shorts taking profit: shorts close while price falls, so new shorts are not feeding the drop.
- Long liquidation: longs close as price falls, by choice or by force.
- Redistribution to longs: the same positions spread across more long accounts, with no new money.
- Redistribution to shorts: the same, toward the short side.
What is a late crowd?
A late crowd is one that keeps piling in on a side it already favours. New long accounts arriving into a rise while the crowd is already long-heavy for that market are late longs. That is not a sell signal. It is a place to check whether price is accepted above the level in play, or rejected.
What does “unusual for this market” mean?
Every market has its own normal. On some coins the crowd is nearly always long-heavy, so a long-heavy split is ordinary there. Reading the ratio against an even split would call that crowd one-sided every day. The useful question is different: is the crowd leaning further than it usually does in this market?
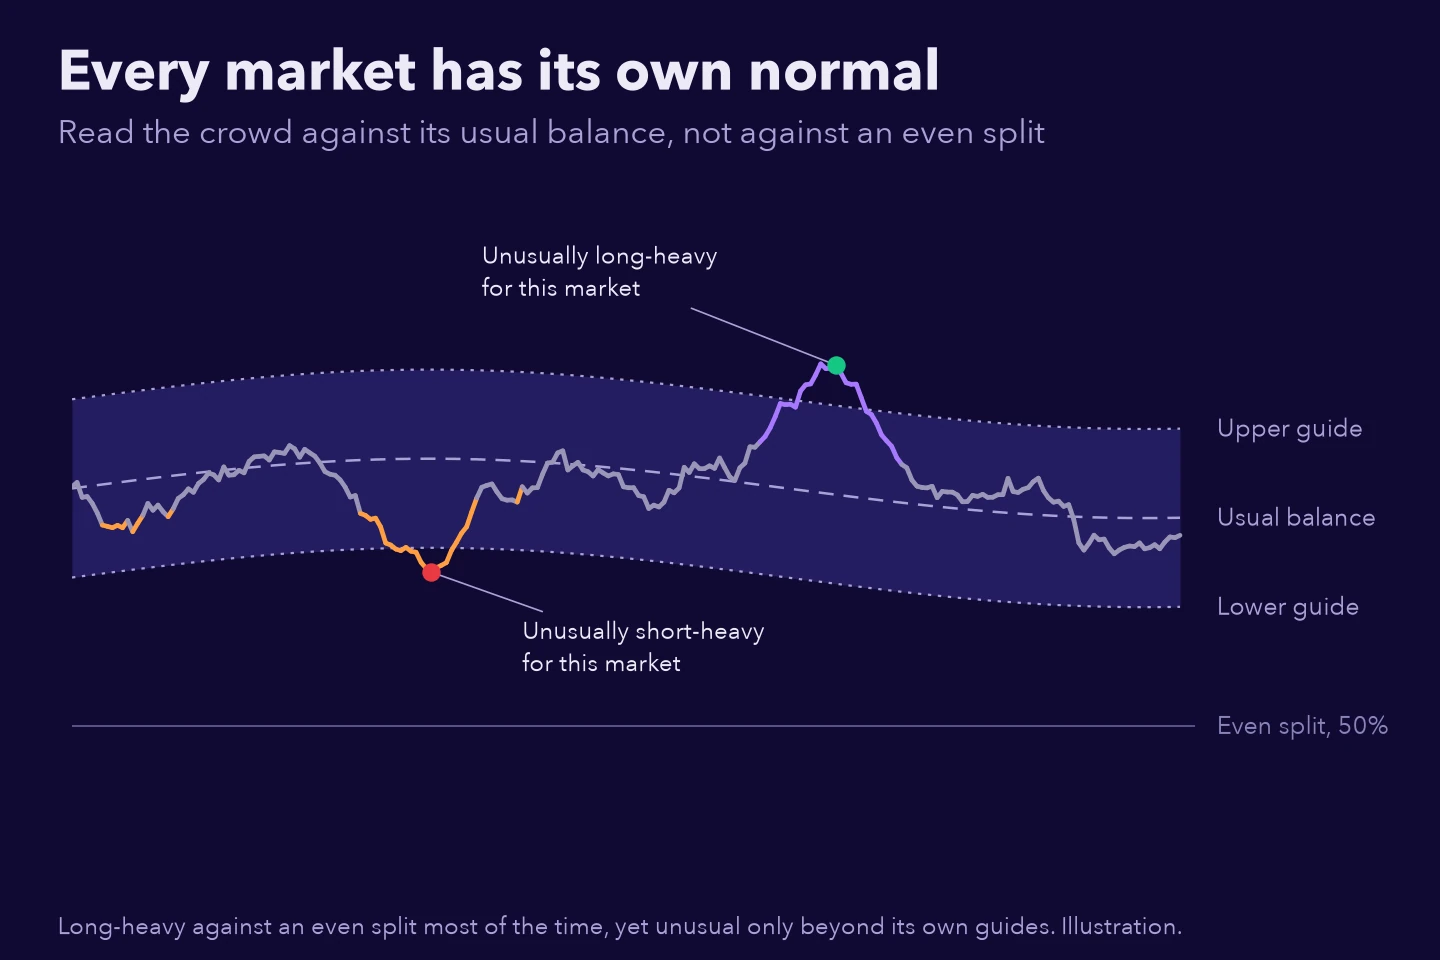
So read positioning against the market’s own usual balance and its usual range. A crowd near its usual balance is background noise. The nearer the edge of its usual range, and especially beyond it, the more it matters. A market sitting at 45% long can still be leaning long if its usual balance is lower.
Is a long-heavy crowd bearish for price?
Not on its own. A crowd can stay long-heavy while price keeps rising, and short-heavy while price keeps falling. A long-heavy crowd is not a sell signal, and a short-heavy crowd is not a buy signal. Positioning describes the crowd, never where price goes next, so it belongs next to a level and a plan.
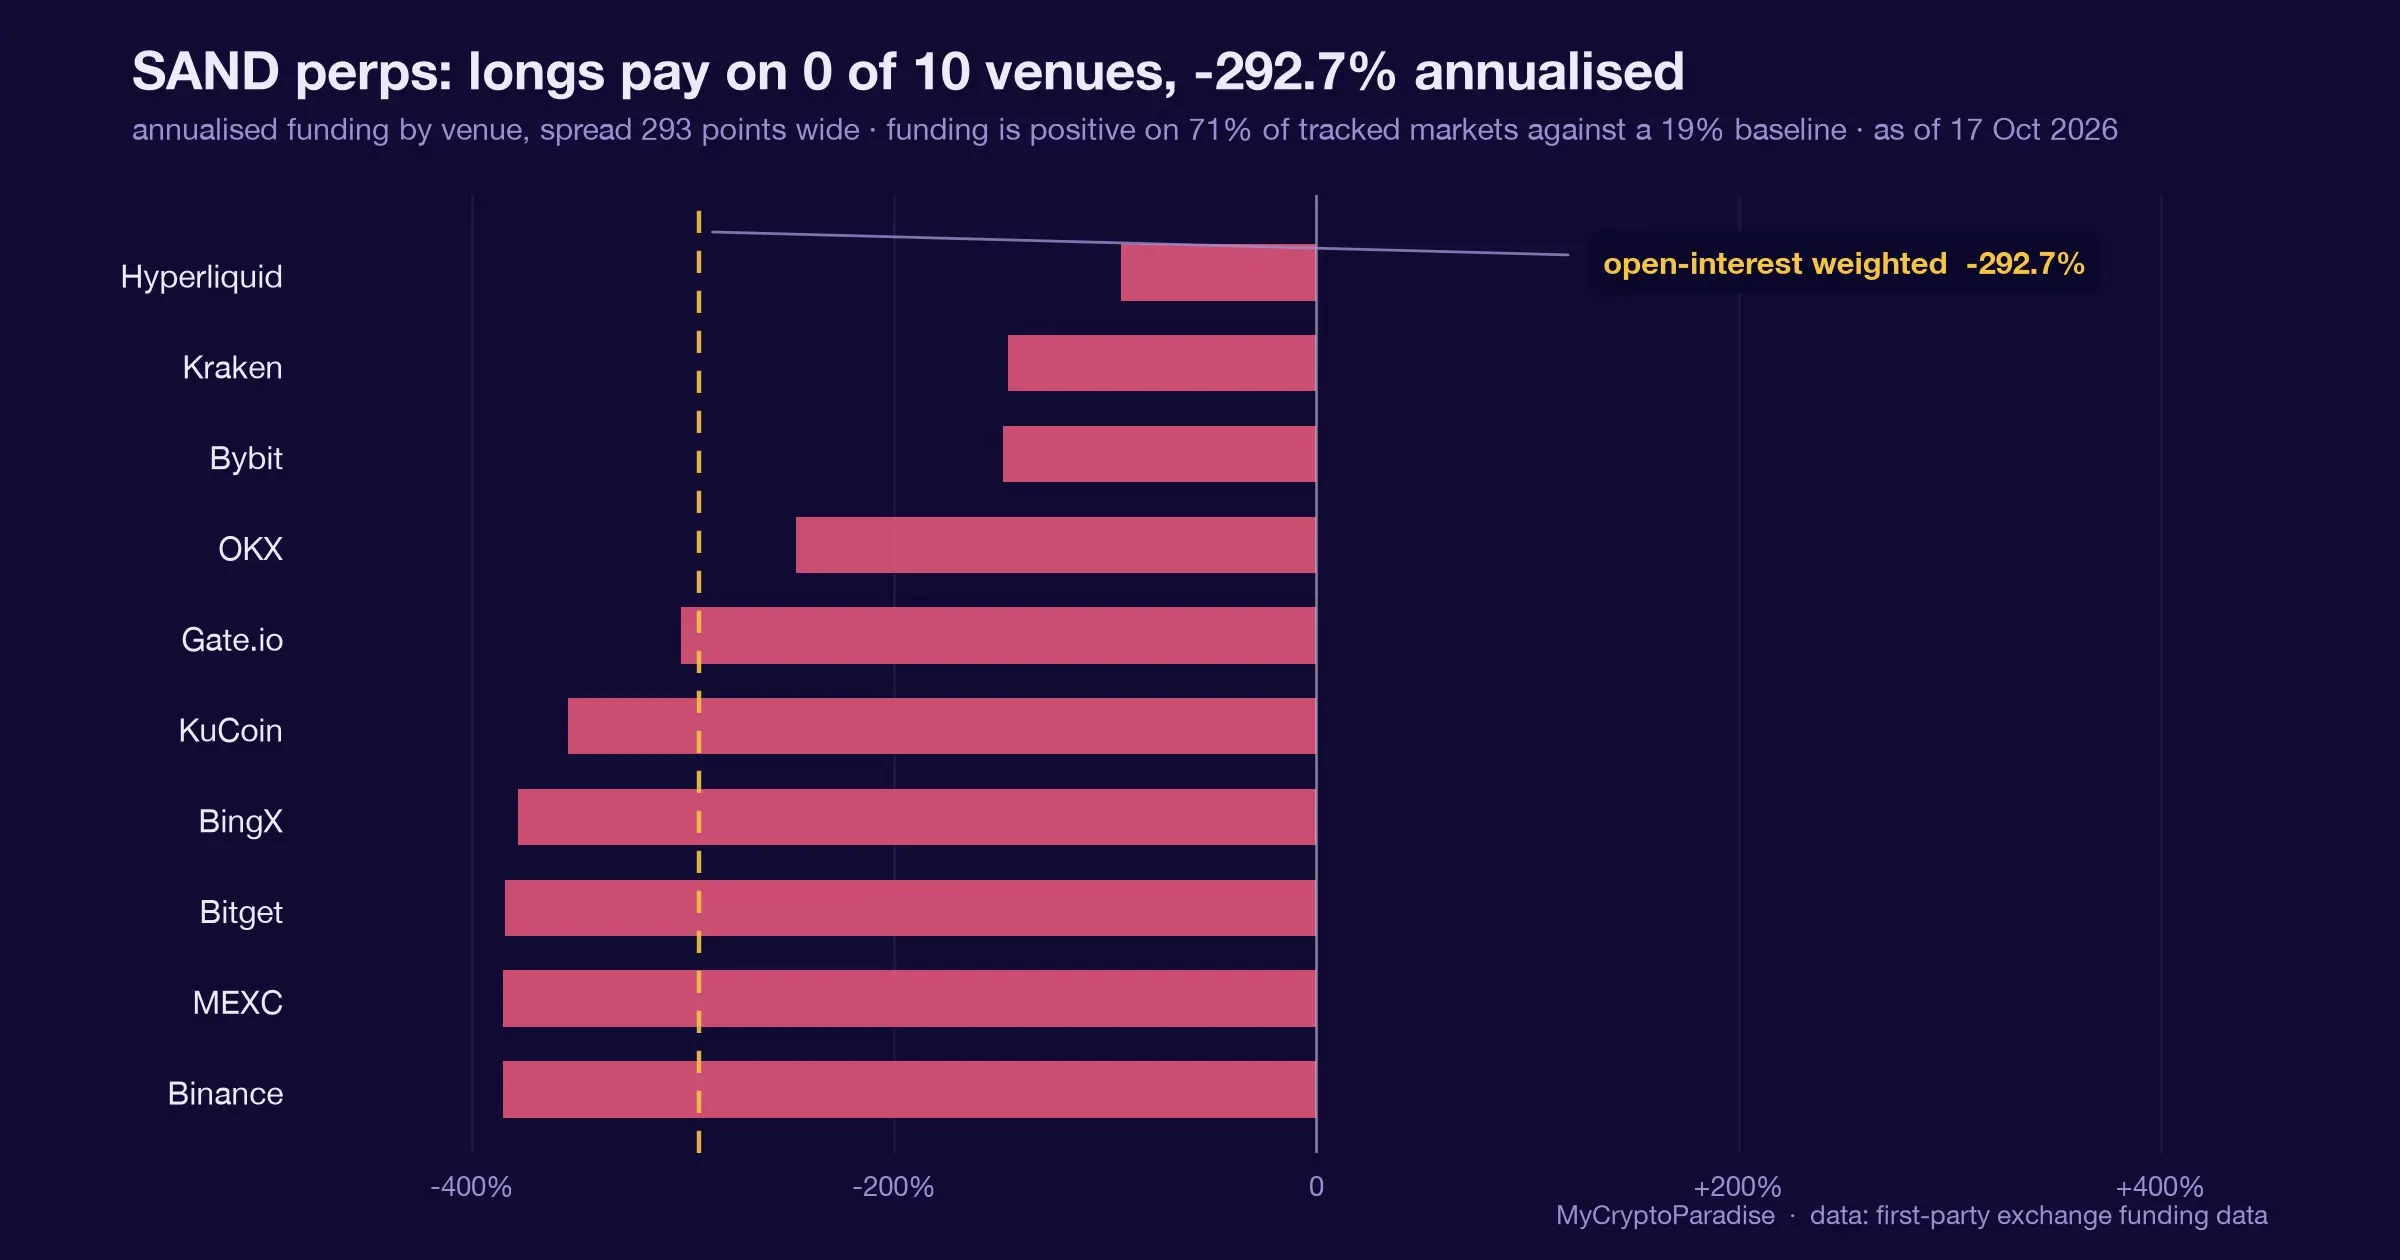
What positioning does well is warn you when a move runs on borrowed fuel. Short covering can lift price without new buyers. A crowd catching the knife can stall a fall for a while. Funding is the next piece: read how to read crypto funding rates to see which side is paying to stay in.
How do you practise reading positioning?
Open a chart you already follow and find a strong rise and a sharp fall. For each, ask three questions. Was price accepted or rejected at the next level? Did open interest keep building, or did it drain? Did the crowd’s lean change before price did? Write the answers down before you scroll on.
Then look for the quiet tells. Redistribution while price is flat means the money did not change, but the accounts holding it did. Watch what price does next at the nearest level. Over a few weeks, the ten situations start to read like a story instead of a list.
Where does MCP Positioning Intelligence fit?
The ParadiseTeam built every idea in this class into MCP Positioning Intelligence, its TradingView indicator. It reads open interest across the major exchanges, the crowd’s account share and price. It compares the crowd with each market’s usual balance and names the situation in plain words. A machine-learning model built by the ParadiseTeam grades every crowd reading.
Its columns show who is moving under the crowd line. A column turns hollow when price moved clearly while open interest fell. Then the move ran on positions closing: shorts covering into a rally, or longs liquidated into a drop.
The next step shows how to read every line of it. The MCP Positioning Intelligence guide walks through the crowd line, the who-is-moving columns, the panel and the alerts. It is part of AI Indicators by MCP and included with PRO Paradiser.
FAQs
What is the difference between open interest and the long/short ratio?
Open interest counts the futures positions still open, so it shows whether money is arriving or leaving. The long/short ratio counts accounts on each side, so it shows how the crowd leans. Neither shows direction alone. Read together with price, they tell new money from old money.
Does a high long/short ratio mean price will fall?
Not on its own. A crowd can stay long-heavy while price keeps rising. A high ratio describes how accounts lean, never where price goes. Check whether new positions are still opening, and whether price is accepted or rejected at the level in play, before you draw any conclusion.
Why can the long/short ratio rise without new buyers?
Because short accounts closing also raise the long share. The ratio is a headcount, so fewer shorts look the same as more longs. Open interest tells the two apart: new longs add positions, while departing shorts remove them. That is why the two belong on the same chart.
What is short covering in crypto?
Short covering is a rise driven by short positions closing rather than by new long positions opening. Price goes up while open interest falls. It can be fast and sharp. New money is not feeding it, so it often needs fresh buyers to keep going once the covering ends.
Why compare the crowd with its usual balance?
Because every market has its own normal. On some coins the crowd is nearly always long-heavy, so a long-heavy split is ordinary there. What matters is a crowd leaning further than it usually does in that market, especially beyond the edge of its usual range.
Risk disclaimer: Crypto trading involves substantial risk of loss. This class is education only, not financial advice. Never trade with money you cannot afford to lose. Past results do not guarantee future results.











Join the discussion 1
so the late crowd usually gets wrecked 💥, especially if its new money in the market? thats what i was wondering 🤔📉