

In short
This update changes how MCP RSI Intelligence grades a reading. A machine-learning model built by the ParadiseTeam grades every momentum reading on every chart. A reading never shows more points than the ParadiseTeam’s measured research allows. The panel looks the same, and some fast-chart readings now show fewer points.
Newer update, October 2026: a machine-learning model grades each fresh divergence on its own strength where the ParadiseTeam’s measured research could confirm that grade. A reading never shows more points than that research allows. See how divergences are graded.
What changed in this update?
One thing changed at the core: how many points a reading earns. A machine-learning model built by the ParadiseTeam now grades every momentum reading on every chart. What you see stays familiar. The words, the 0 to 5 scale, the count and the divergences look exactly as before.
- A model inside: it grades every momentum reading, on all six timeframes that carry points.
- A ceiling: a reading never shows more points than the ParadiseTeam’s measured research allows.
- An honesty fix: some fast-chart readings now show fewer points than before.
- Checked live: the model’s points are checked every week against what it promised.
What is different here
Most indicator updates add more to the panel. This one removes points that had not earned their place, and it puts a ceiling on the rest. A strength grade you can trust is worth more than a busy panel.

What does the machine-learning model do?
It grades how much weight a momentum reading deserves. The model reads the RSI’s reading together with the market around it, then lights between 0 and 5 probability points. Where it finds no edge, it lights none, and the panel says No edge. It never redraws the RSI and never adds marks to your chart.
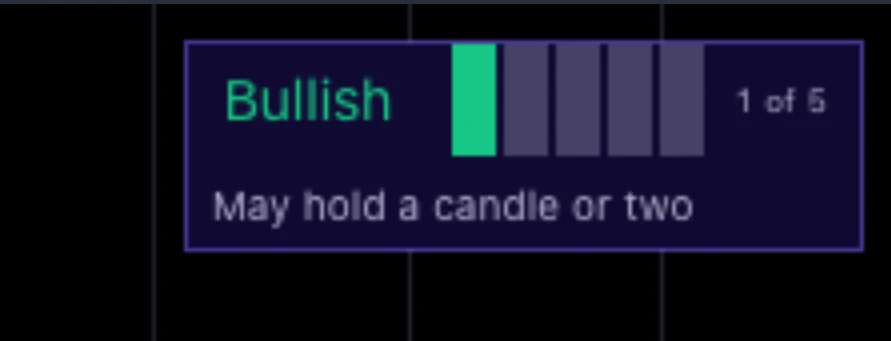
Look at the chart above. The RSI sits above its 50 line, and line two reads Bullish, holding up. A plain RSI would call that bullish and stop there. The model weighed the same reading and found no edge, so the count says 0 of 5. That is the update at work.
Is it still the RSI you know?
Yes. The violet RSI line, its blue average, the grey band and the 70, 50 and 30 lines are unchanged. The divergences are drawn and named exactly as before. The model works only on the grade in the panel, so everything you learned about reading the pane still applies.
Why do some readings show fewer points now?
On some fast-chart readings, the earlier version lit a point where the evidence behind it was thin. The model now leaves many of those readings at No edge. You may notice quieter panels on fast charts. That is deliberate: fewer points, and each one that remains carries more weight.
The standard is the same one the indicator always had, applied more strictly. A strength grade earns trust slowly and loses it quickly. We would rather show No edge than a point that does not deserve your attention.
Does the model predict price?
No. The model does not predict price: the probability points describe how strong the reading on screen is, never where price goes next. They are not a target and not a buy or sell signal. Use them as one layer of evidence next to your levels and a written plan.
What stays the same?
Almost everything you see. The model changes how many points a reading earns, not how the panel looks or reads. The words, the scale, the count, the timeframes, line two, the divergences and the alerts all work exactly as before. Here is the full list, so nothing on your chart surprises you.
- The five words: Strongly bullish, Bullish, No edge, Bearish and Strongly bearish.
- The 0 to 5 scale, the five points and the small count, from 0 of 5 to 5 of 5.
- Probability points on the 5m, 15m, 1h, 4h, daily and weekly charts.
- Line two in plain words, the gold events, the dots and the alerts.
- The four divergence names, and a fresh divergence keeps its own grade.
- No settings to change. Readings settle on closed candles and never repaint.
How is the model checked?
Every week the ParadiseTeam checks the model’s points on live charts against what the model promised before release. The check is part of the release, not an afterthought. And the ceiling stays in place either way: no reading can show more points than the measured research allows.
Do you need to do anything?
Reload your chart first. If the old version remains, remove MCP RSI Intelligence and add it again from Invite-only scripts in the TradingView Indicators menu. Nothing needs setting up, because the indicator has no settings to change. Your layouts, drawings and other indicators stay as they are.
Alerts need one extra step. A TradingView alert keeps the script version it was created with, as TradingView’s alerts FAQ explains. Delete your existing MCP RSI Intelligence alerts and create them again, so they run on the new grades. The alert names have not changed.
New to the panel? Our walkthrough of how to read every part of MCP RSI Intelligence covers the words, the points, line two, the dots and the alerts. The previous update explains the six timeframes, the count and the single violet line.
MCP RSI Intelligence is part of AI Indicators by MCP and is included with PRO Paradiser. New to the RSI itself? The free class on reading RSI momentum and divergences works without any tool.
Frequently asked questions
Does MCP RSI Intelligence use machine learning now?
Yes. Since this update, a machine-learning model built by the ParadiseTeam grades every momentum reading on every chart. A reading never shows more points than the ParadiseTeam’s measured research allows. The panel words, the 0 to 5 scale and the divergence names stay exactly as they were before.
Does the model predict where price goes next?
No. The model does not predict price. The probability points describe how strong the reading on screen is, never where price goes next. Read them as one layer of evidence next to price structure and a written plan, and never treat them as an entry on their own.
Why do some readings show fewer points than before?
On some fast-chart readings, the earlier version lit a point where the evidence behind it was thin. The model now leaves those readings at No edge. Fewer points can feel like less at first, but each point that remains now deserves more of your attention than before.
Do I need to do anything after the update?
Reload your chart. If the old version remains, remove MCP RSI Intelligence and add it again from Invite-only scripts. Then delete and recreate your MCP RSI Intelligence alerts, because a TradingView alert keeps the script version it was created with. No settings need changing.
Did the divergences change in this update?
No. Divergence detection is unchanged, with the same Classic, Exaggerated, Weak and Hidden names drawn the same way. A fresh divergence also keeps its own grade on the panel. The model grades the momentum readings, while each divergence keeps the grade it had.
Crypto trading involves substantial risk and is not suitable for everyone. Nothing here is financial advice; it is education only. Never risk more than you can afford to lose.











Join the discussion 1
So the AI is doing the grade-work on momentum now? My debits and credits still get a manual cross-check, but anything that helps clean up the risk-reward line is a credit to the ledger! 🤖