

In short: A hammer is a possible bullish reversal candle after a decline, with a long lower wick and small upper body. It signals rejection of lower prices, not a confirmed turn. Wait for the next candle, volume, or a structure reclaim, and define your invalidation before entry.
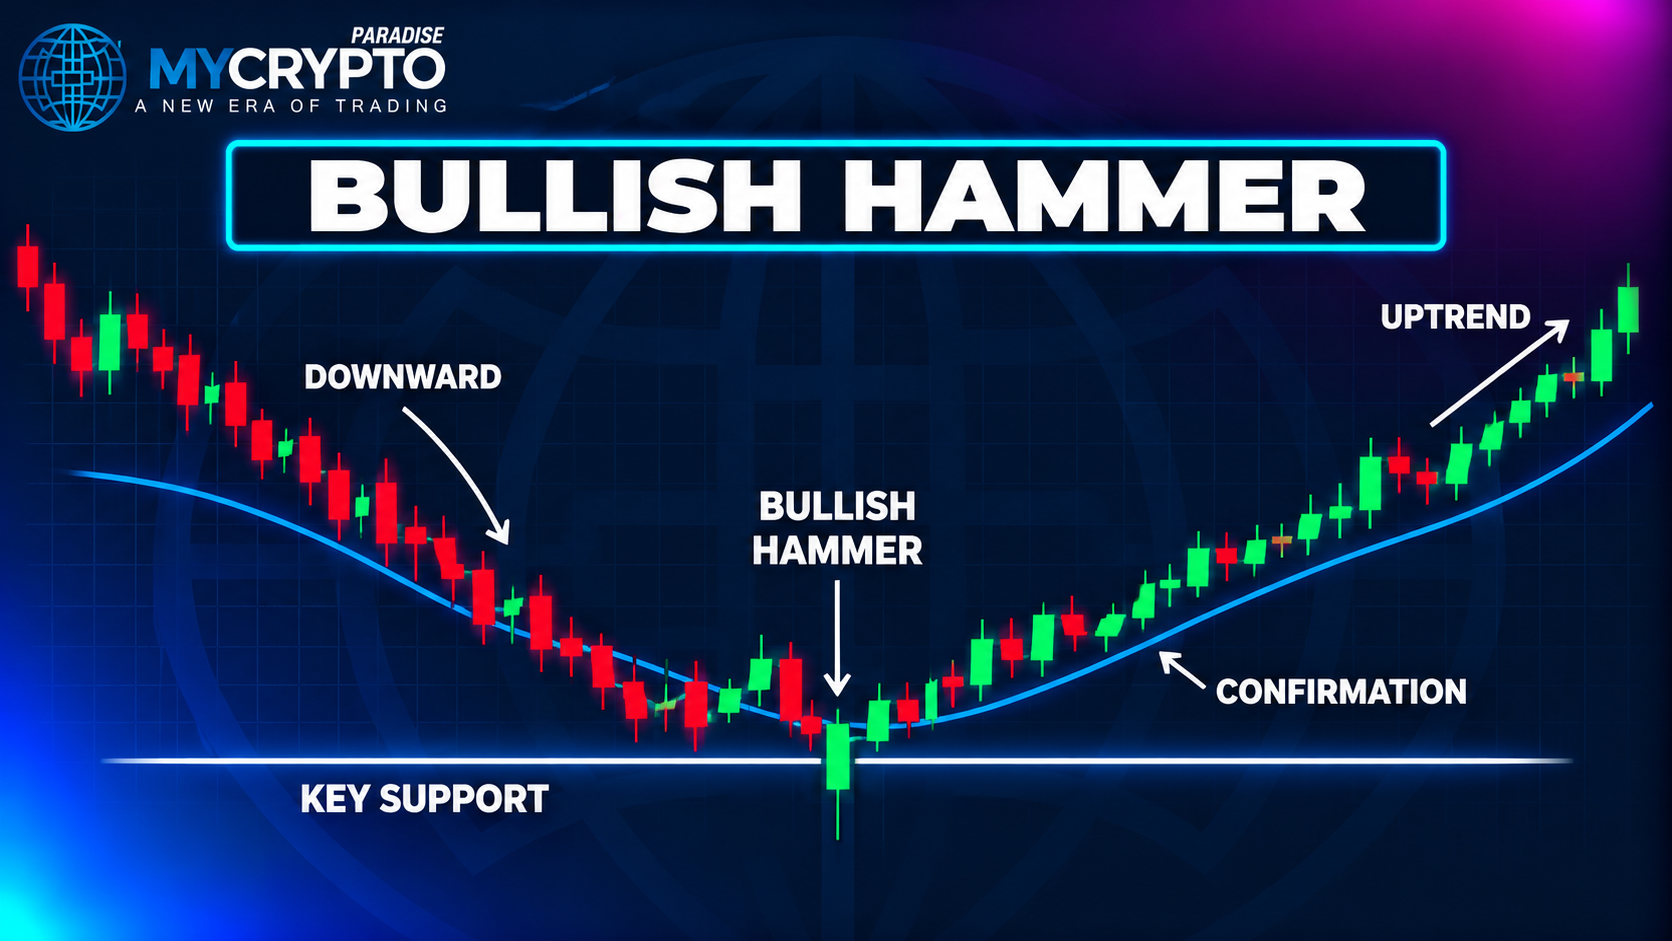
A hammer is a potential bullish reversal candle that forms after a decline. Its long lower wick shows that sellers pushed price down, yet buyers recovered much of the move before the close.
The inverted hammer appears in the same spot but with a long upper wick. Both suggest rejection, not a confirmed turn. This lesson sits in the candlestick track at MCP University FREE, the education side of a professional crypto signals and trading-education service operating since 2016.
What a hammer looks like
A hammer is a single-candle pattern that usually forms after a meaningful decline. Its real body sits near the top of the range. The lower wick is long, often at least twice the body length, while the upper wick is small or absent.
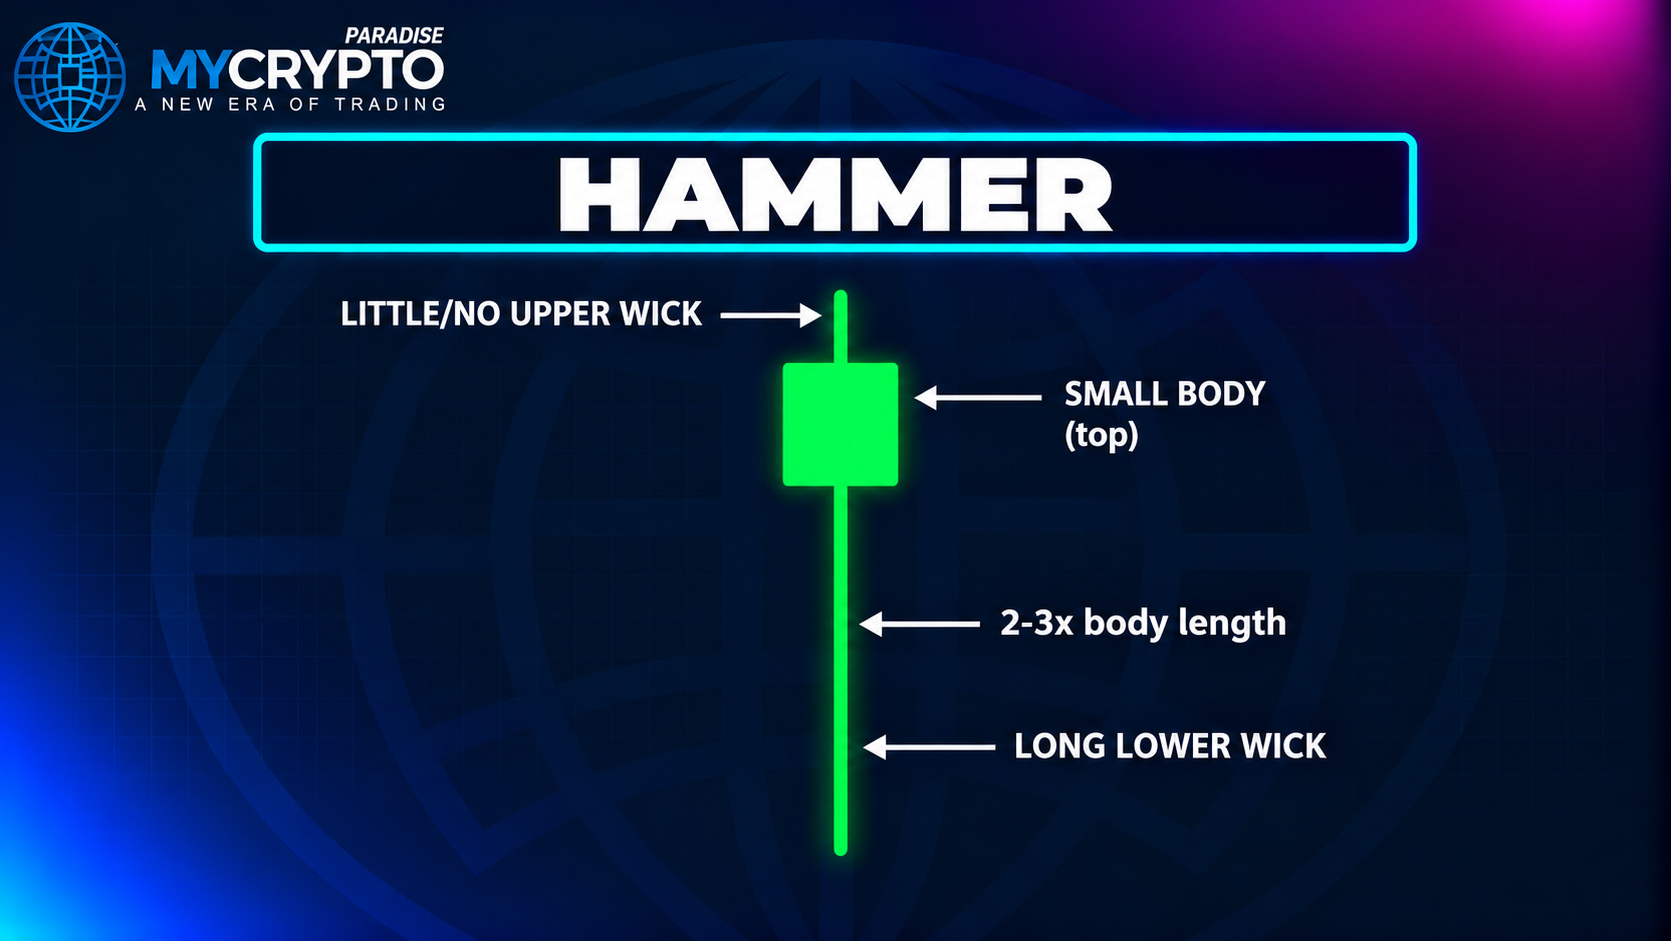
The candle reflects a battle inside the period. Sellers pushed price lower, but buyers recovered part of the drop before the close. That recovery suggests lower prices attracted demand. It does not prove buyers have taken control.
A red hammer can still be valid. The wick, body placement, and market context matter more than color. Wait for the candle to close before classifying it, since its shape can change while forming.
Hammer vs hanging man vs inverted hammer vs shooting star
These four candles share similar shapes, so the preceding trend is essential. A hammer and inverted hammer are studied after a decline as possible bullish signals. The hanging man and shooting star appear after an advance as possible bearish signals.
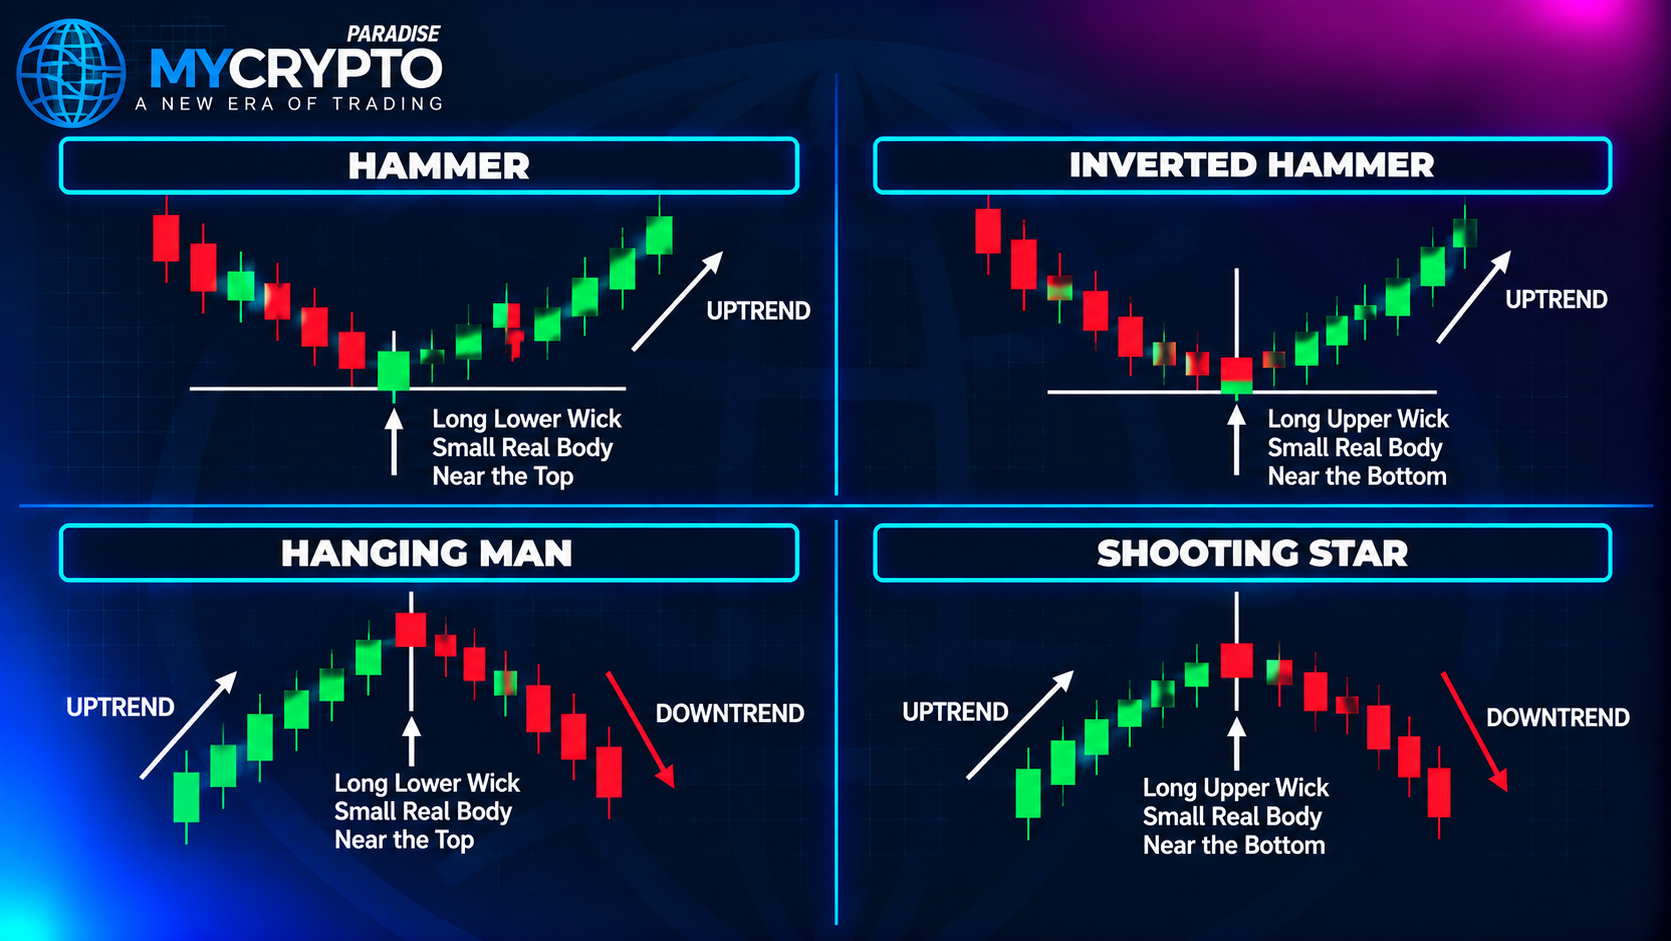
The hanging man has the hammer’s long lower wick but follows an uptrend, where it may warn that selling pressure is building. The shooting star mirrors the inverted hammer after a rally, signalling rejection of higher prices. A doji differs again, with open and close near each other, reflecting indecision.
The practical rule is simple. Identify the candle shape, establish the trend, then look for confirmation rather than trading the label. Technical analysts have documented these shapes for decades; see Investopedia on candlestick analysis.
Why it forms: sellers pushed, buyers rejected
During a hammer, sellers drive price below the open, but the decline does not hold. Buyers step in and recover a meaningful portion, leaving the close near the top. This is rejection of lower prices within one period, not proof the downtrend has ended.
The inverted hammer tells a different intraperiod story. Buyers lift price, creating the upper wick, but sellers return it toward the lows before the close. After a long decline, that test can hint at emerging demand, yet the weak close makes follow-through vital.
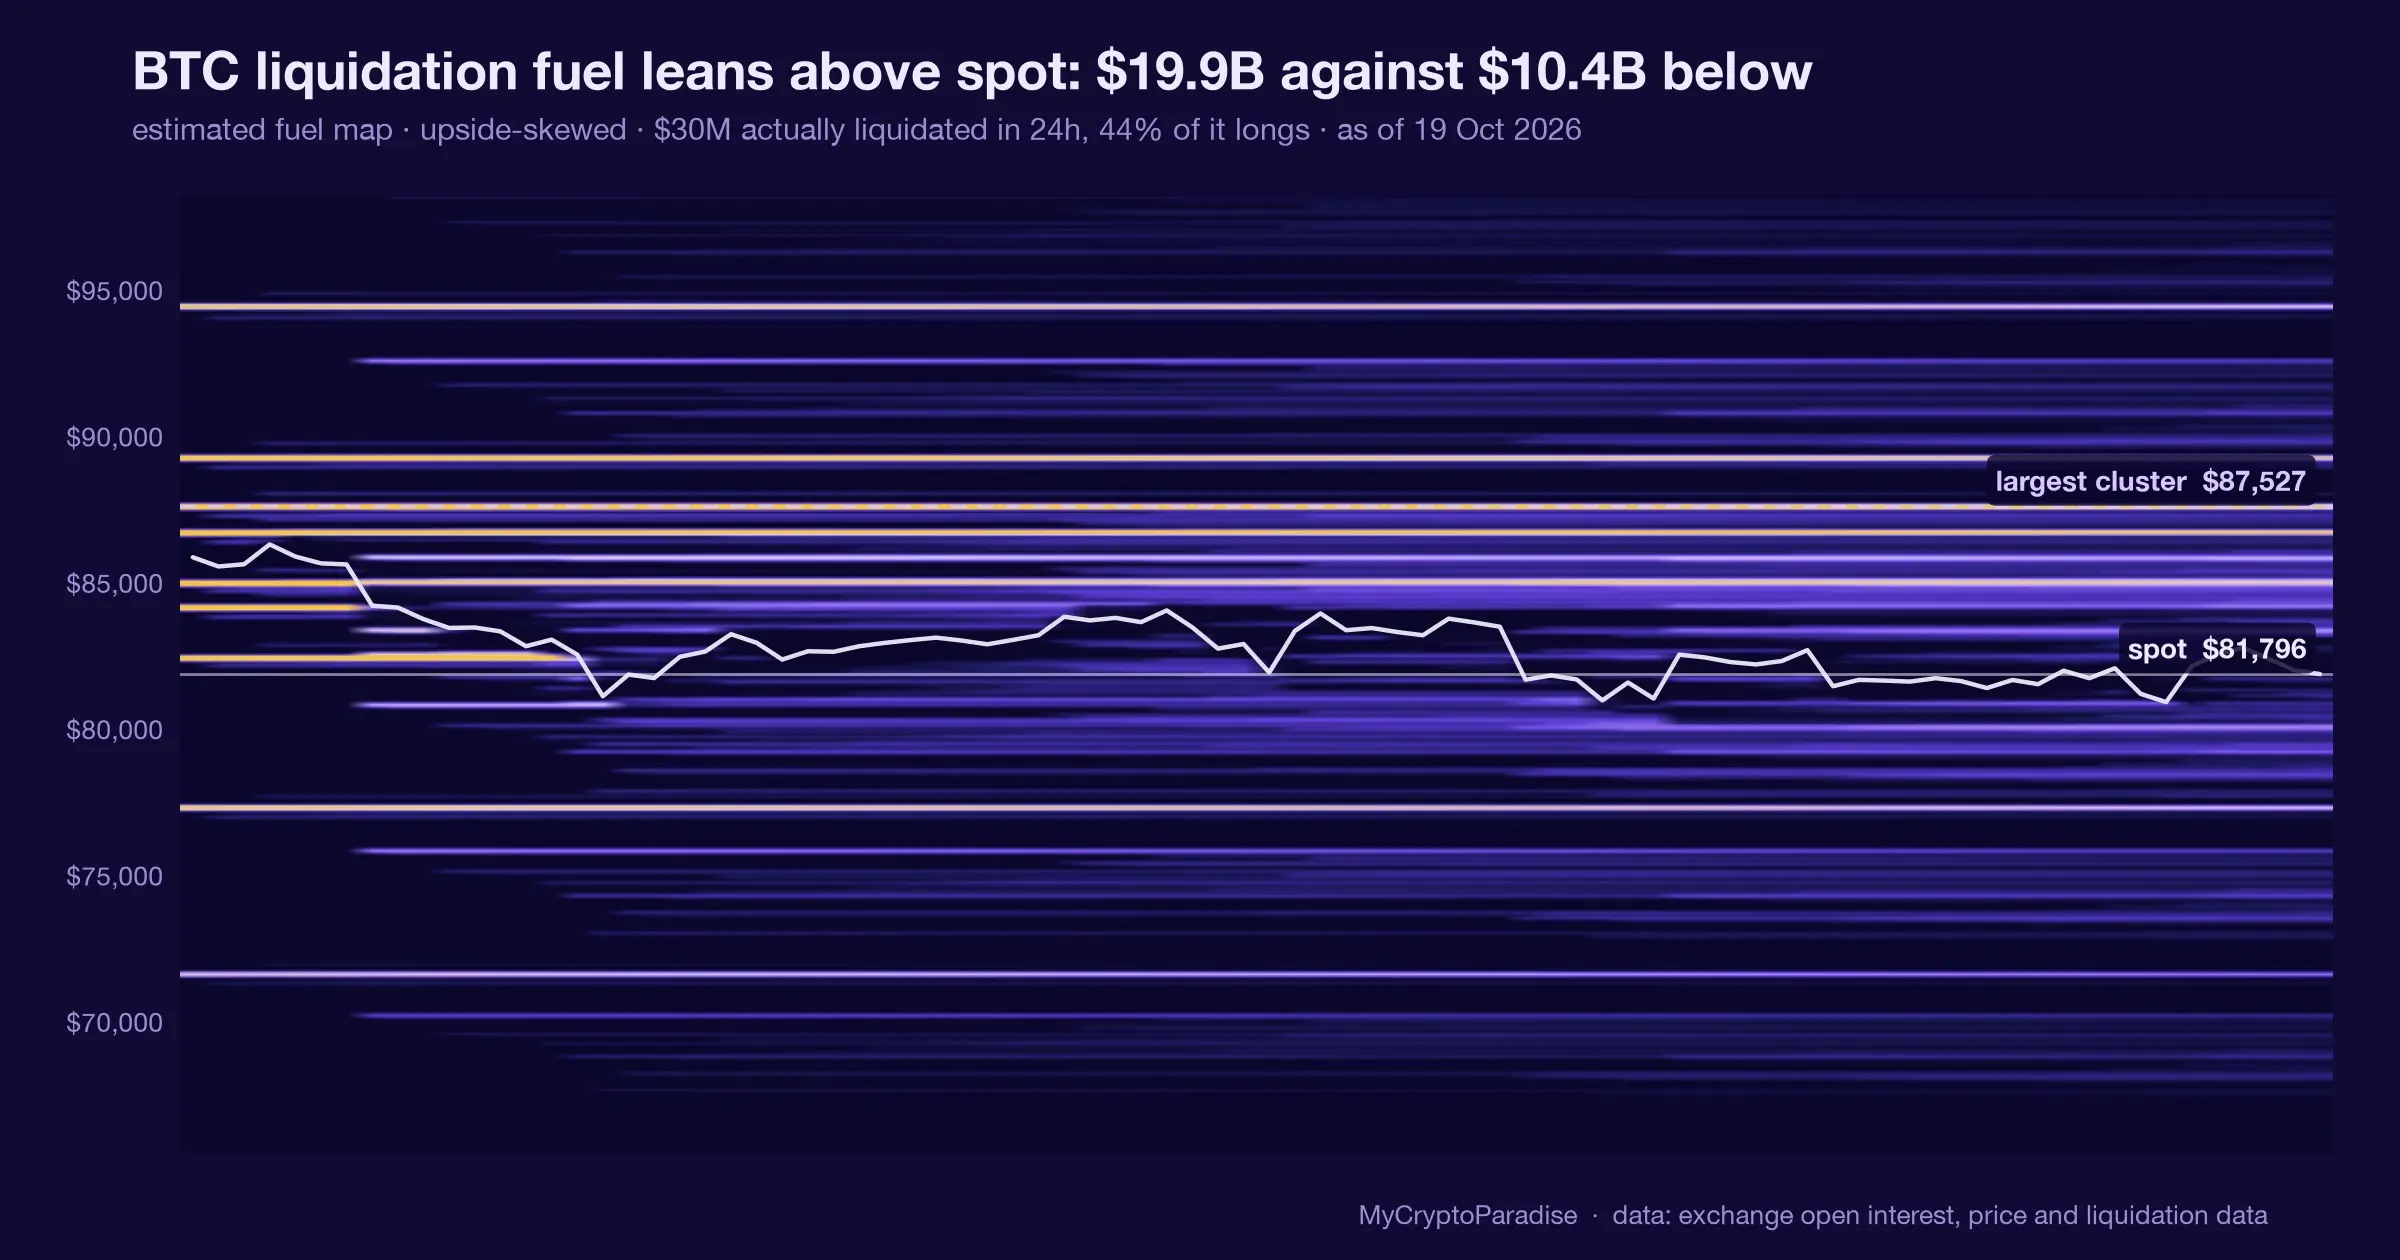
Balance can shift fast in crypto. Thin order books, rapid participation changes, and forced selling all stretch wicks. A crypto liquidation heatmap and current funding rate conditions can add context the candle alone cannot show.
Where it matters: support, a Fibonacci zone, or a flush
A hammer becomes more useful when it forms where the chart already matters. Prior swing lows, established support, or an area that has reacted before give a reason to watch for rejection. A textbook shape far from structure is less actionable.
A Fibonacci retracement adds context when it overlaps support or a prior swing. The level itself does not cause a reversal. Watch how price reacts inside the zone and whether it can reclaim a nearby level.
A sharp sell-off or liquidation flush can also print a long lower wick. But a flush may be followed by more selling, so the first bounce is not automatically a bottom. A bullish engulfing candle or a piercing line signal can add weight when structure agrees.
Confirmation: the next close and volume
Confirmation separates a reversal attempt from a candle with no follow-through. One approach waits for the next close above the hammer high. Others look for a reclaim of resistance or a break of short-term lower-high structure.
Volume adds context but should not be read alone. A bounce on stronger participation supports active buyers; a weak bounce on thin volume warrants caution. High volume does not guarantee a turn, since it may reflect heavy selling, so price response matters.
Judge any confirmation against the larger structure and the distance to the next resistance. Mapping that structure with Elliott Wave structure can help. Never treat one candle or indicator as enough on its own.
The inverted hammer needs stronger confirmation
The inverted hammer is harder to read. Its upper wick shows buyers tested higher prices but could not hold them into the close. That is a sign of emerging demand and clear evidence sellers still pushed back.
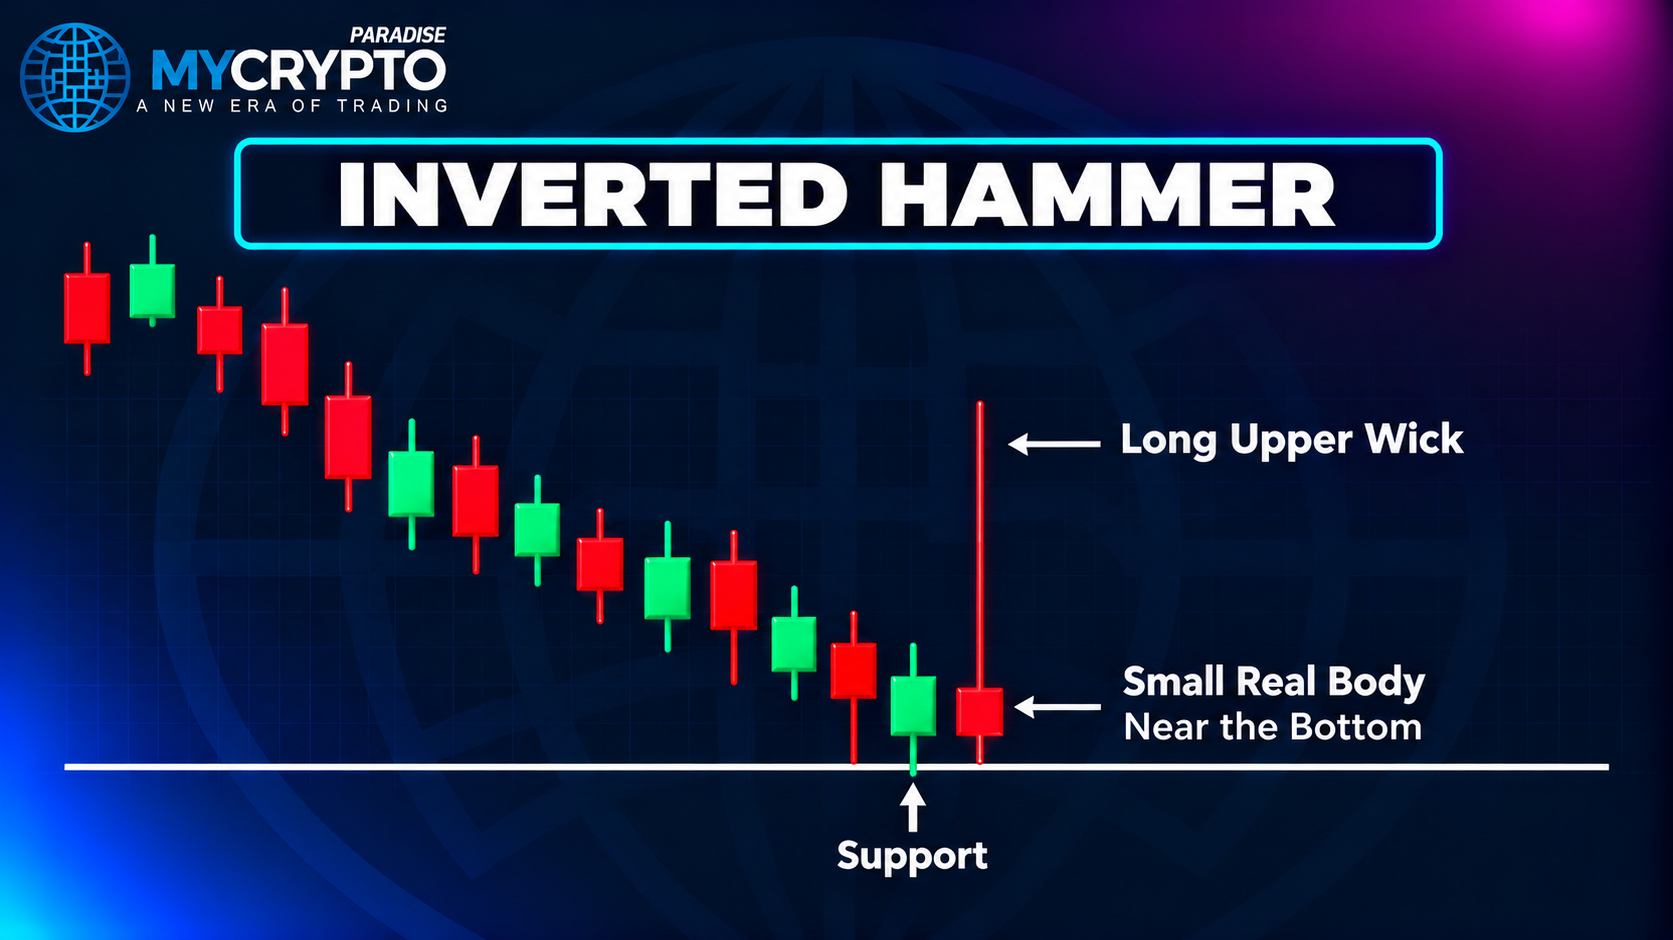
A bullish close above the pattern high suggests buyers followed through. A reclaim of resistance or a shift in short-term structure adds support. If price instead breaks the low and keeps making lower lows, the reversal idea has weakened or failed.
Do not assume a longer upper wick means a stronger signal. The wick shows an attempted advance, not accepted higher prices. Its meaning depends on location, the next candles, and whether the downtrend starts to lose control.
Stop and invalidation below the wick
Define risk before entering either pattern. For a bullish setup, the pattern low is a common invalidation reference, since a decisive break below it shows the rejection did not hold. Adjust for volatility, timeframe, and nearby structure rather than a fixed distance.
Size the position from the entry-to-stop distance and the capital you will risk. A wider stop needs a smaller position to keep the planned loss within limit. This stops an attractive candle from encouraging an oversized trade.
A stop does not guarantee your exit price during fast moves or liquidity gaps. Consider slippage and order type. If the setup needs an excessive stop or offers little room before resistance, passing is a valid decision. The Fear and Greed Index can frame the backdrop.
Common mistakes
A hammer or inverted hammer often fails in the middle of a range with no nearby support or preceding decline. There the candle may just reflect ordinary back-and-forth, which makes it hard to interpret and leads to weak trade selection.
Thin liquidity prints long wicks when small orders move the market. These candles can look convincing but fail to attract lasting participation. News spikes and liquidation wicks do the same, pushing price far before a quick reversal.
The best response to a failed pattern is to reassess, not to force the original read. If price breaks the low, loses support, or continues the trend, reconsider the thesis. A good process accepts invalidation and preserves capital.
Practice this
- Find three recent hammers and three inverted hammers after a clear decline.
- Mark whether each formed at support, a Fibonacci zone, or a flush.
- Note the next candle and whether it closed above the pattern high.
- Draw where your invalidation would sit below the pattern low.
- Record which setups confirmed and which failed, and why.
Repeating this builds pattern judgement without risking capital, which is exactly how to use candlesticks honestly.
FAQs
What is a hammer candlestick in crypto?
A hammer has a small body near the top of its range and a long lower wick. After a decline, it can show that lower prices were rejected. Treat it as a possible reversal only after confirmation.
What is an inverted hammer candlestick?
An inverted hammer has a small body near the bottom and a long upper wick. After a downtrend, it shows buyers attempted to push higher, though the close did not hold the full advance.
Does a hammer candle guarantee a reversal?
No. It records rejection of lower prices during one period, but the broader trend may continue. Look for follow-through, market-structure evidence, and a defined invalidation level before acting.
What is the difference between an inverted hammer and a shooting star?
Both have a small body low in the range and a long upper wick. An inverted hammer appears after a decline as a possible bullish signal. A shooting star appears after an advance as a possible bearish signal.
Where should a stop-loss go for a hammer pattern?
The pattern low is a common invalidation reference for a bullish setup. Placement still depends on volatility and structure. Size the position from the entry-to-stop distance and the risk you planned for the trade.
Risk disclaimer: Crypto trading involves substantial risk of loss. This class is education only, not financial advice. Never trade with money you cannot afford to lose. Past results do not guarantee future results.











Join the discussion
No comments yet. Members, share how you are reading this.