



In short: Fibonacci retracement measures how far price has pulled back from a prior move. Treat each level as a zone where a reaction becomes more likely, never a guaranteed turn. Confirm with structure, confluence and defined risk before acting.
Fibonacci retracement measures how far price has pulled back from a prior swing. It does not predict an exact reversal. Each level marks a zone where a reaction becomes more likely, never a certainty.
This lesson is part of the advanced technical tools track at MCP University FREE. It also builds a bridge into Elliott Wave structure and harmonic analysis, where Fibonacci relationships appear often.
What Fibonacci retracement measures, and what it does not
Fibonacci retracement measures the percentage of a previous price swing that has been retraced. You select a meaningful swing high and swing low, then watch price around the resulting levels.
In an upward move, traders draw from the swing low to the swing high. In a downward move, they draw from the swing high to the swing low. The direction follows the move studied.
The tool does not predict an exact turning price. A level is better read as an area where the probability of a reaction may rise. Price can reject it, stall, or pass through.
That distinction matters in crypto because volatility runs high. A brief bounce from a level does not prove the larger trend continues. Confirmation still comes from structure and price action. The underlying ratios are explained in the Binance Academy.
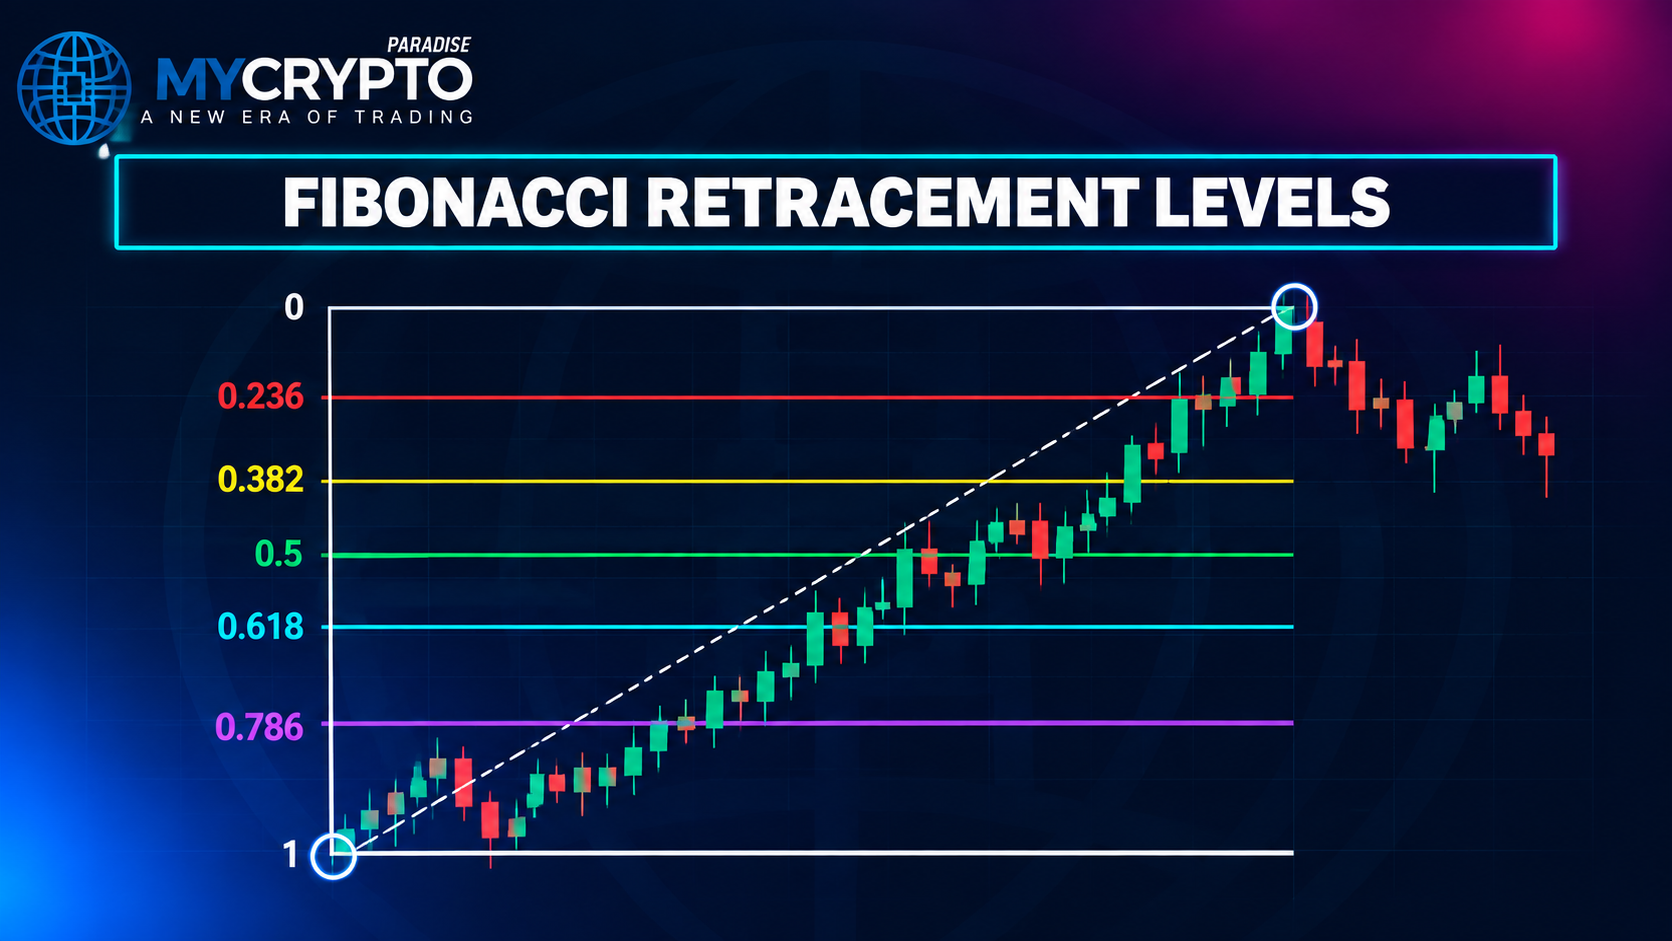
The levels, and why 50 is not a Fibonacci number
The main levels used in crypto are 23.6%, 38.2%, 50%, 61.8% and 78.6%. Each marks a different depth of the previous move.
The 23.6% level marks a shallow retracement. The 38.2% level is a moderate pullback. The 61.8% level is deeper, while 78.6% is a very deep pullback.
The 50% level is different. It is not drawn from the Fibonacci sequence, yet traders have long watched the midpoint of a move. Most charting platforms therefore include it beside the ratios.
Do not treat the levels as equal-strength signals. Their relevance depends on market context and on how price reacts around them. Read them through retracement depth, not as fixed lines.
How Fibonacci levels behave
When price approaches a level, compare the area with earlier support or resistance. If several references overlap, the zone may carry more weight than a Fibonacci line alone.
The key idea is probability. A level can raise or lower the chance of a reaction, but it never guarantees a turn.
How to draw it: which swing, wick or body, which timeframe
The first decision is the anchor swing. Choose the move you want to measure. A random short-term high or low produces weak levels with little value.
For an upward swing, draw from the meaningful low to the meaningful high. For a downward swing, draw the opposite way. The points should mark a clear move on your timeframe.
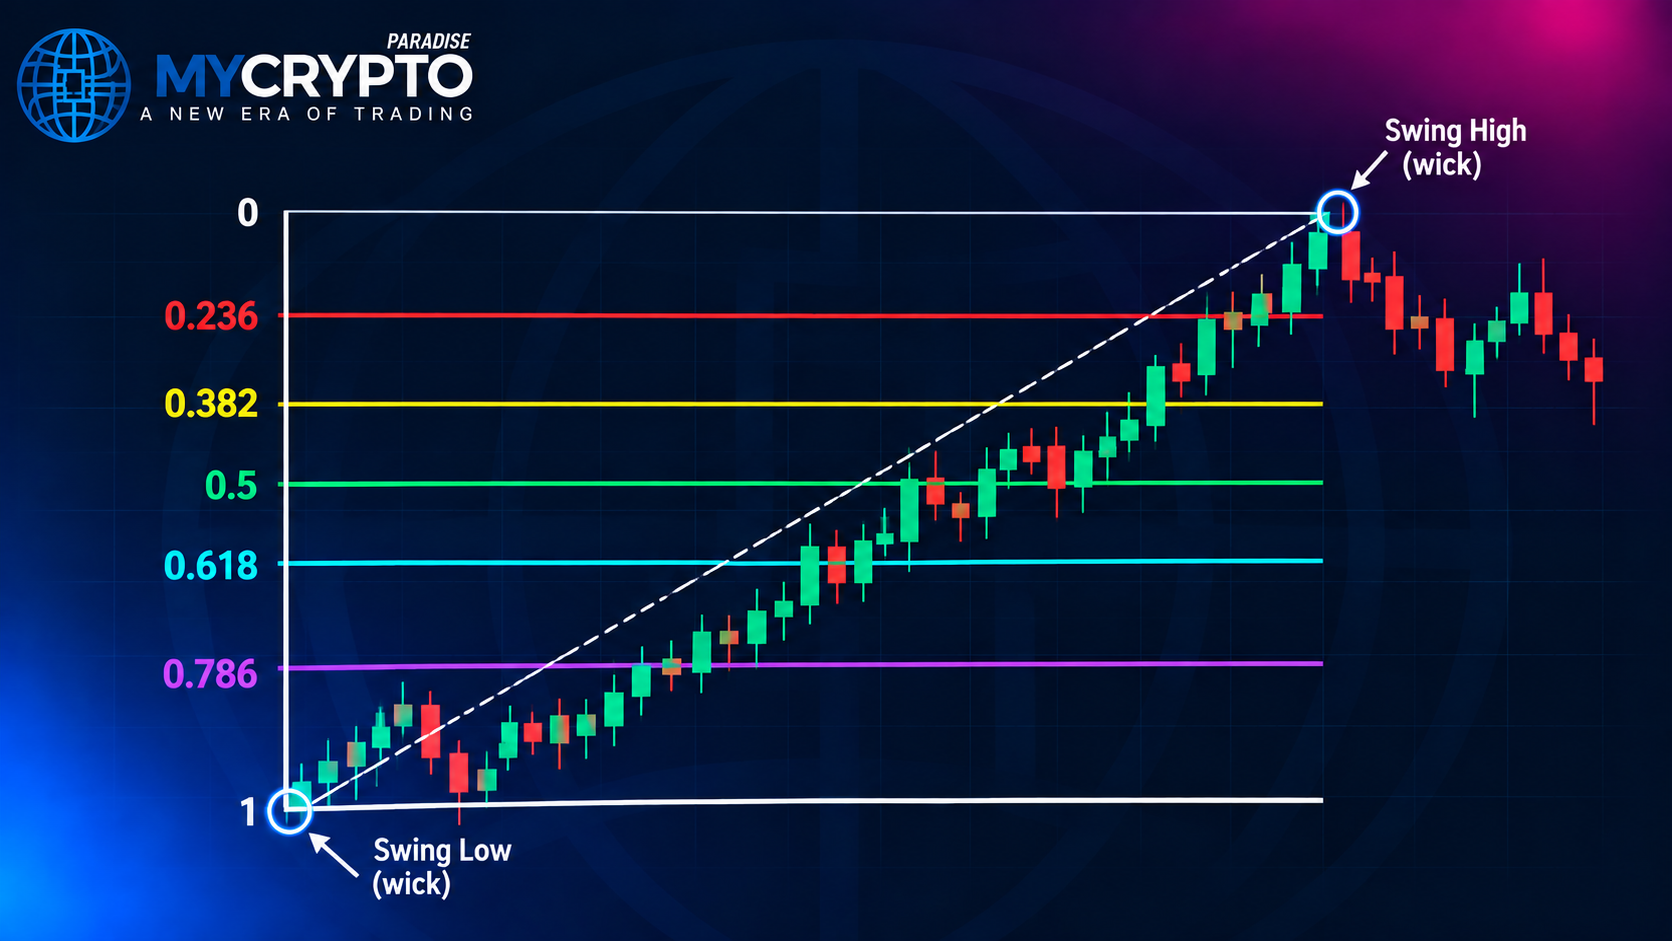
Wicks are useful because they show the full traded range of the candle. Body-based anchors suit a trader deliberately measuring closing structure. The rule that matters most is consistency.
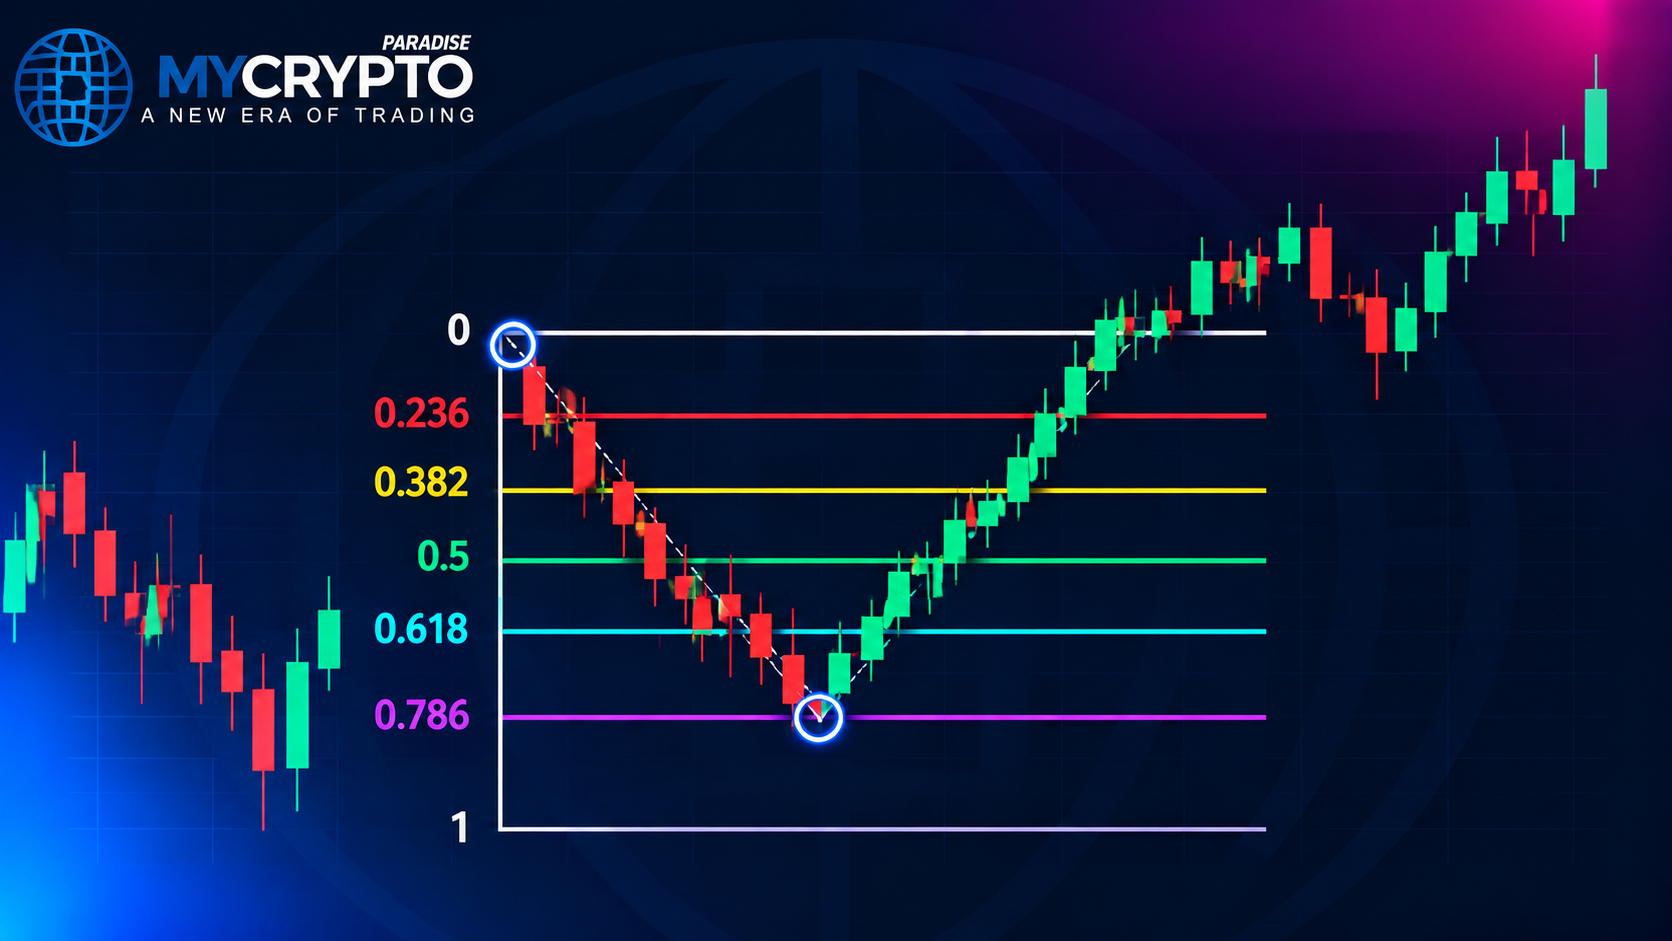
Do not switch between wick and body anchors simply because one produces a prettier level. That invites hindsight bias. Choose the method before you judge the reaction.
Timeframe matters too. A daily swing produces levels for a broader correction. A lower timeframe produces levels for a shorter move. The drawing should match your question.
The Golden Pocket (0.618 to 0.65) and why traders watch it
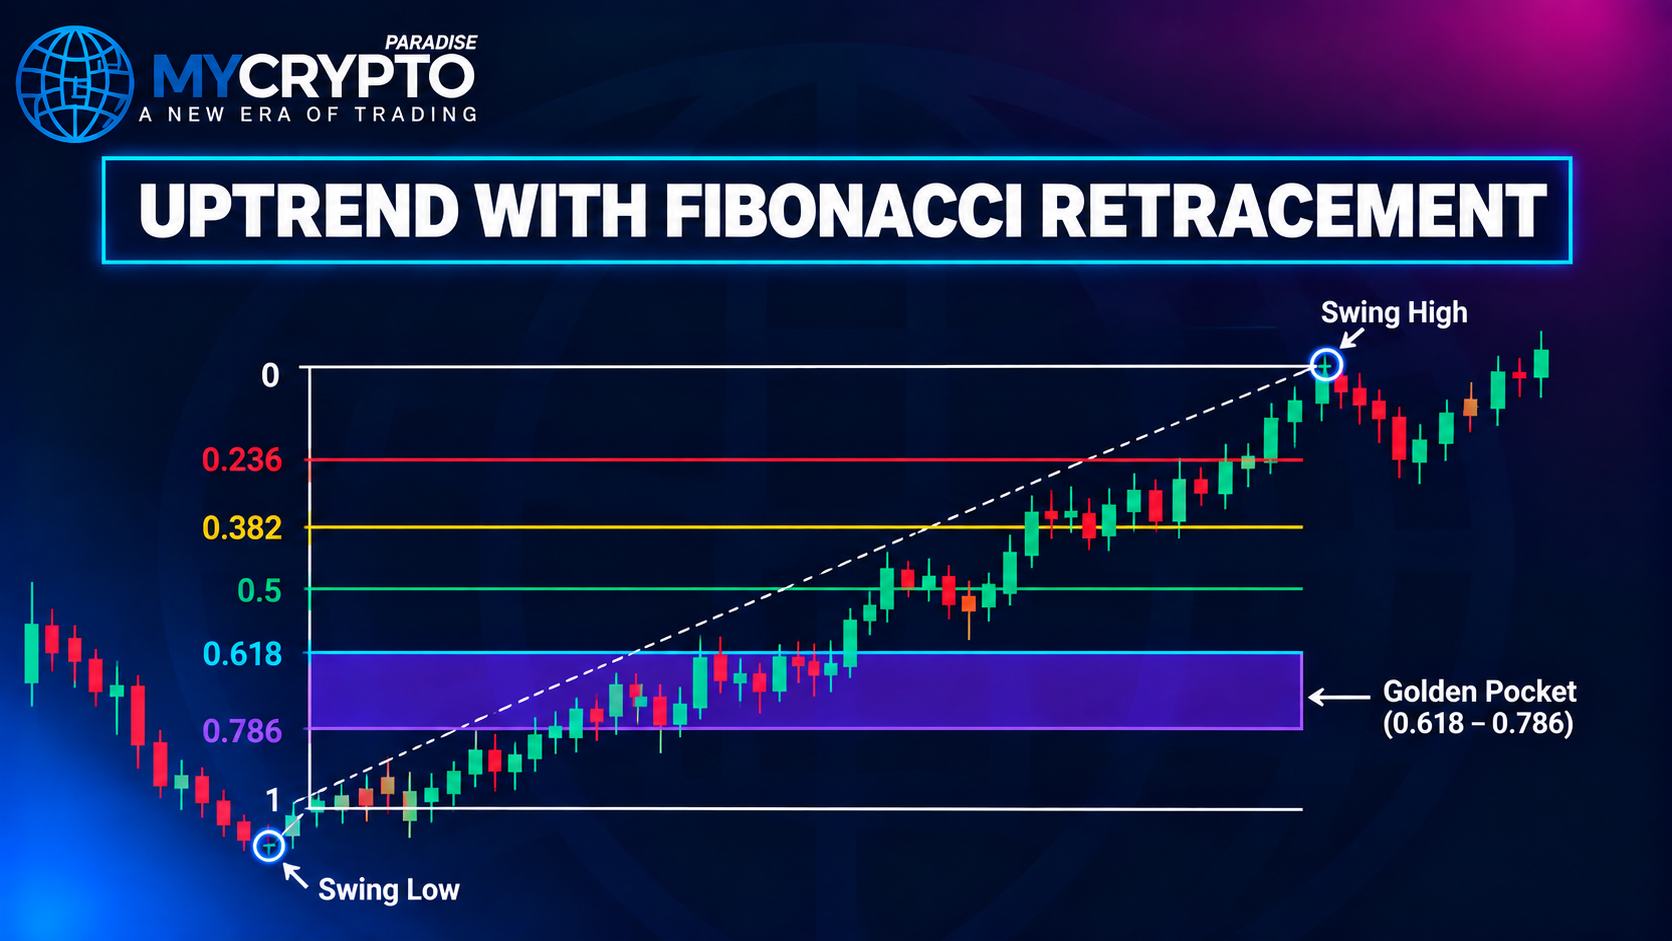
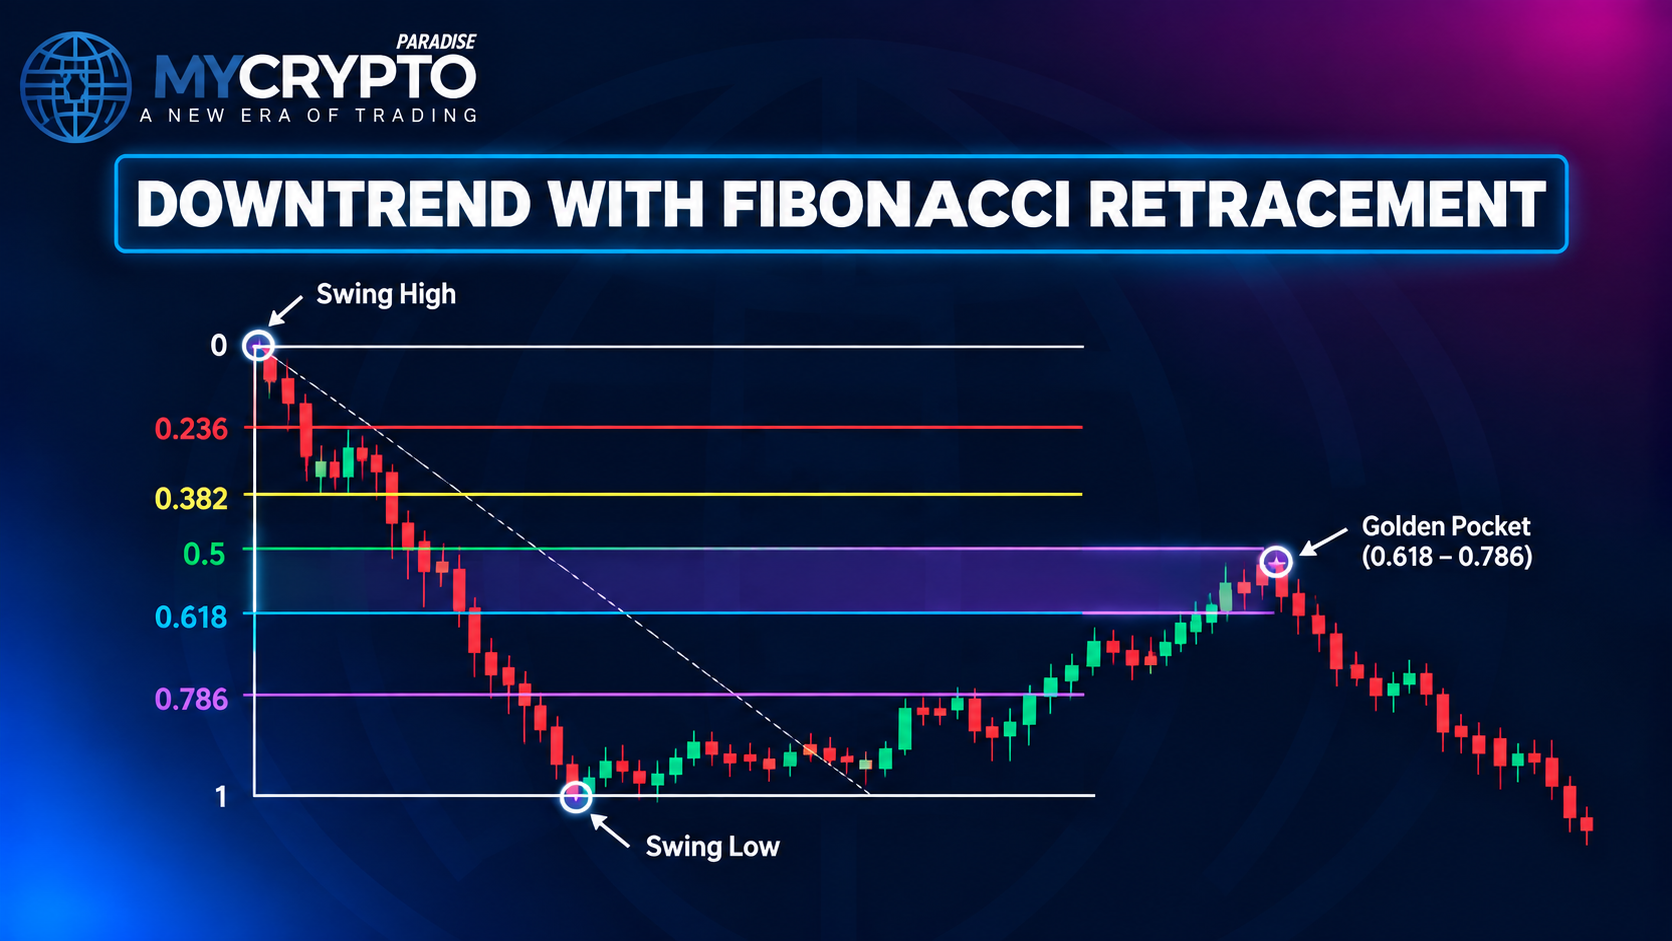
The Golden Pocket is a Fibonacci zone traders use to spot potential reaction areas during a correction. It is commonly the 0.618 to 0.65 range, though deeper pullbacks extend toward 0.786.
Golden Pocket in an uptrend
In an uptrend, levels are drawn from the swing low to the swing high. The Golden Pocket sits below the swing high, where price may retrace before potentially resuming higher.
Traders watch this zone for signs buyers are returning. A bullish reaction may suggest the correction is fading, but confirmation is essential.
Golden Pocket in a downtrend
In a downtrend, levels are drawn from the swing high to the swing low. The zone sits above the swing low, where price may pull back before potentially continuing lower.
Traders watch for selling pressure or bearish rejection candles. A clear engulfing reversal signal inside the zone can shift the read quickly.
What makes the zone important
Price can retrace deeply without immediately invalidating the prior trend. The Golden Pocket matters most when it aligns with other technical evidence, such as:
- Support and resistance: earlier price levels that may influence behaviour.
- Trendlines and structure: areas where the broader trend may regain control.
- Volume: evidence of changing buying and selling pressure.
- Candlestick confirmation: rejection wicks, engulfing candles, or a piercing line reversal.
- Liquidity: a liquidation heatmap can show where price may be drawn.
Confluence: pairing a level with other evidence
Confluence means several independent observations point to the same area. Fibonacci becomes more useful when its level agrees with another visible chart feature.
Support and resistance are common examples. If the 0.618 area overlaps old resistance that became support, watch whether price respects the combined zone.
Volume adds context to the reaction. Strong selling that makes little downside progress near support tells a different story from selling that breaks through. Broader sentiment, like the crypto fear and greed read, can frame that behaviour.
Derivatives positioning helps too. Checking crypto funding rates shows whether leverage is crowded on one side as price tests the zone.
Retracement depth as a trend-health read
Retracement depth gives a quick read on how much of an impulse the market has given back. It does not prove trend strength, but it helps organise the analysis.
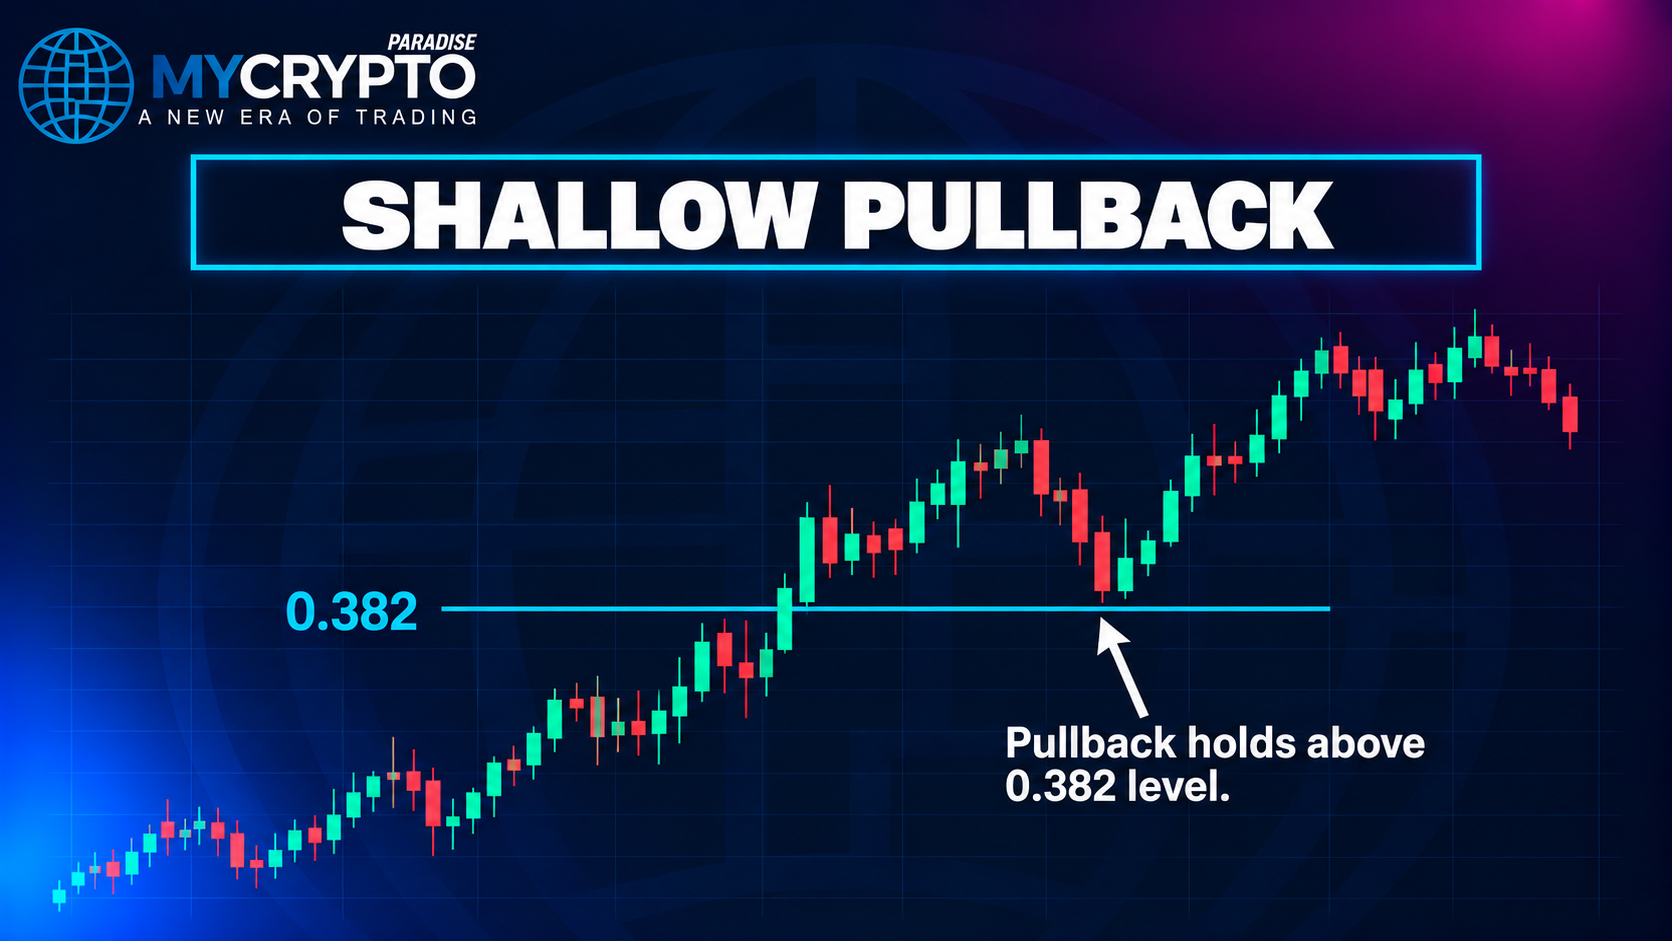
A shallow pullback that holds above 0.382 can signal strong directional pressure when structure stays intact. Buyers or sellers may be defending the move.
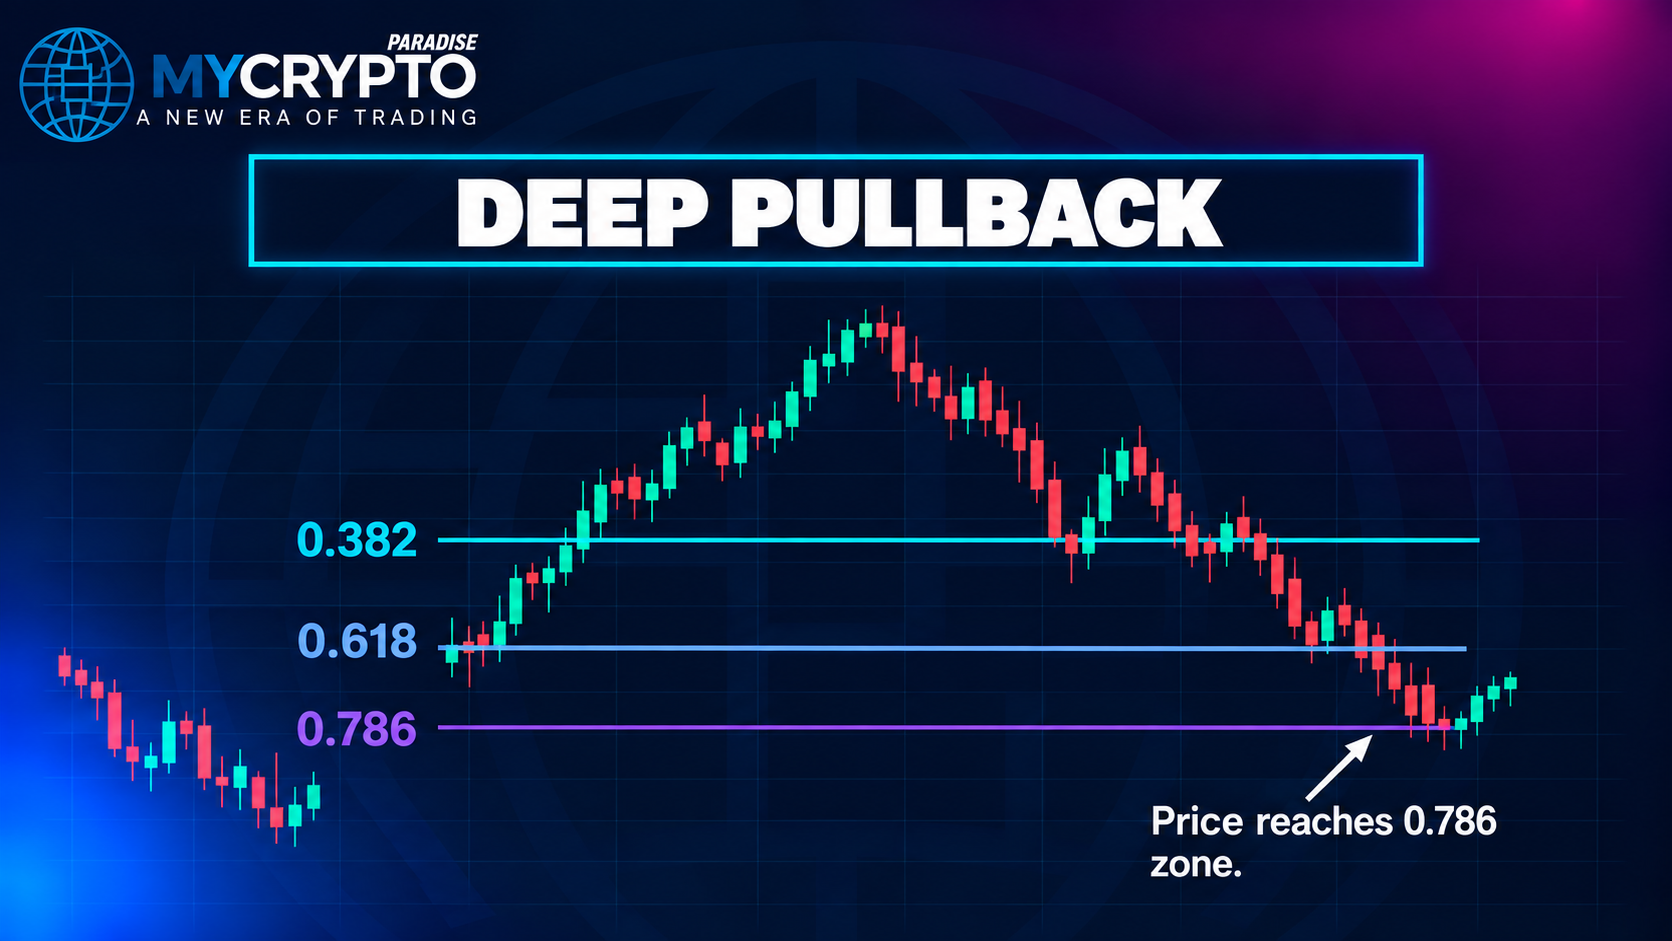
A deeper pullback toward 0.618 or 0.786 demands more attention. It can still become a continuation setup, but check whether key swing structure is preserved.
A deep retracement is not automatically bearish in an uptrend or bullish in a downtrend. The same percentage can produce very different outcomes in different structures.
This read also helps separate a correction from a possible reversal. If the market breaks a key swing and fails to reclaim it, the original interpretation needs reassessment.
Where Fibonacci fails
Fibonacci works poorly with no clear swing to measure. In a choppy range, different anchors produce conflicting levels and weak conclusions.
News-driven spikes create another problem. A sudden move can leave an extreme wick that shifts the levels sharply. Decide whether that spike reflects real structure or a temporary event.
The wrong anchor is a common error. If the chosen high or low does not represent the impulse, the levels look precise while measuring the wrong move.
Risk first: size before entry
Fibonacci should be used after risk is defined, not before. Know where the setup becomes invalid before deciding how much capital to expose.
Place invalidation beyond the relevant structural level. Do not assume the Fibonacci line itself must hold. Placement depends on the setup, volatility and timeframe.
Size the position from the amount you can lose if the setup fails. This stops an attractive zone from dictating an oversized position.
Common mistakes
- Choosing the wrong swing: start with the impulse that clearly changed structure.
- Changing anchors to fit the chart: pick the swing and method before judging the outcome.
- Mixing wick and body anchors: switching between them to get a preferred level distorts the analysis.
- Treating a line as an exact level: read it as a zone that price can reject, hold, or break.
- Skipping confluence: a level matters more when it overlaps independent evidence.
- Ignoring structure: a deep retracement does not automatically mean the trend reversed.
- Forcing it in choppy or news-driven moves: decide first whether the move is meaningful.
- Entering before defining risk: set invalidation and size before any entry.
Practice this
Open a chart and find one clear impulse that changed structure. Draw the retracement from that swing, using wicks consistently.
Mark the Golden Pocket and note any support, resistance or trendline that overlaps it. Write down what reaction would confirm a continuation.
Before imagining an entry, define where the idea is wrong and what size keeps the loss affordable. Review the chart later to see how price behaved around the zone.
FAQs
What is Fibonacci retracement in crypto?
Fibonacci retracement measures how much of a previous price move has been retraced. Traders use the resulting levels as zones for studying potential reactions, not as guaranteed turning points.
Is 50% a Fibonacci level?
No. The 50% midpoint is not a Fibonacci ratio. It is widely included in Fibonacci tools because traders commonly monitor the midpoint of a price move.
What is the Golden Pocket?
The Golden Pocket generally refers to the 0.618 to 0.65 retracement area. Traders watch it as a deeper correction zone where the probability of a reaction may rise.
Should I use candle wicks or bodies?
Wicks show the full traded range and are commonly used for swing anchors. Body-based anchors can also help when applied consistently to a specific structural method.
Is Fibonacci financial advice?
No. This lesson is for education only, not financial advice. Crypto markets involve substantial risk, and every setup can fail. Always define invalidation and position size first.
This class is part of the free education library from MyCryptoParadise, a professional crypto signals and trading education service operating since 2016.
Risk disclaimer: Crypto trading involves substantial risk of loss. This class is education only, not financial advice. Never trade with money you cannot afford to lose. Past results do not guarantee future results.










Join the discussion
No comments yet. Members, share how you are reading this.