


Listen: the breakdown
Market briefing: Ethereum spot ETFs bled for a third straight day, losing about $69.7 million on October 16 as BlackRock's ETHA led the exit again. BTC traded near $81,482 while the institutional bid for ETH kept thinning.
- ETH spot ETFs lost about $69.7 million on October 16, a third straight down day
- BlackRock's ETHA led the selling with a $69.68 million single-day outflow
- BTC ETFs shed $82 million the same day, so the de-risking spans the whole shelf
Ethereum spot ETF outflows just stretched into a third straight day, and the biggest buyer is now the biggest seller. Is this institutional de-risking, or the start of something deeper?
Ethereum spot ETF outflows pushed on for a third straight day on October 16, 2026. The funds shed roughly $69.7 million in a single session. BlackRock's ETHA led the exit again, with $69.68 million leaving that one product alone.
A day earlier, on October 15, the same funds lost $60.3 million. The pattern is not a one-off. Between October 1 and October 13, these ETFs bled about $715 million. The week into October 15 added roughly $600 million more.
This matters because ETHA was the product that proved institutional appetite for Ethereum. It still carries $12.494 billion in total historical net inflows. When the loudest buyer turns into the loudest seller, the market notices.
There is no single confirmed catalyst for this exact week. We will be honest about that. What we see instead is a slow, grinding withdrawal of the institutional bid, set against a backdrop of broad macro caution.
The weakness is not isolated to Ethereum either. Bitcoin ETFs also lost ground, with $82 million in net outflows on October 16 and $11.7 million the day before. Solana funds gave up $9.8 million on October 15.
So the money is leaving the whole shelf, not just one coin. ETH traded near $2,427 as the streak extended, down fractionally on the day. The price is quiet, but the plumbing underneath is draining. That contrast, a calm tape over a weakening bid, tends to resolve sharply rather than politely.
Institutional demand keeps draining from Ethereum
The mechanism here runs through institutional demand, not retail chatter. A spot ETF outflow means shares are being redeemed. To meet those redemptions, the issuer sells the underlying ETH. So every red day is real supply hitting the market, not just a sentiment reading.
That is the difference between an ETF flow and a tweet. One moves coins. The other moves moods.
Three consecutive down days signal a trend, not a blip. The buyer who absorbed billions in inflows is now stepping back. When the marginal institutional bid thins, price loses its most reliable floor.
Macro uncertainty sits underneath all of it. Large allocators de-risk when the wider picture turns murky. They hold cash, trim exposure, and wait. Crypto ETFs are an easy line item to cut first, because they are new, volatile, and discretionary.
This is why the outflows matter beyond the headline number. $69.7 million in one day is not large on its own. But it is the direction and the persistence that count. A weakening bid compounds, because each day of selling makes the next buyer more cautious.
For traders, the read is simple. Institutional flows are the slow money that sets the tide. Retail is the fast money that rides the waves. Right now the tide is going out for Ethereum, and the fast money has to respect that until the flows turn green again.
From ETH's bid to the alt tape
The liquidity picture starts with Bitcoin, because BTC still sets the risk tone for everything below it. BTC ETFs lost $82 million on October 16 and $11.7 million the day before. That tells us the de-risking is not an Ethereum-only story. The largest, most liquid crypto product is also seeing redemptions.
When BTC liquidity thins, the whole stack gets more fragile.
Ethereum sits one rung down the risk ladder. It feels any pullback in institutional appetite harder than Bitcoin does. The sustained ETHA selling removes a steady, size buyer from the order book. That leaves ETH more exposed to downside air pockets, where thin bids let price slip fast.
Alts sit at the bottom of the ladder, and they feel it worst. Solana funds already lost $9.8 million on October 15. Capital rotates down the risk curve on the way up and retreats up it on the way down. Right now it is retreating.
The chain is clean. Institutions pull from ETH, ETH loses its bid, and the liquidity that usually spills into alts never arrives. Smaller tokens then trade on thinner books and sharper moves.
This is the quiet danger in a calm tape. Price can look stable while the depth beneath it erodes. A market that holds flat on fading liquidity is not strong. It is waiting, and the side that gets squeezed is usually the one that mistook the pause for safety.
The flow turn that ends the streak
The single cleanest tell is the flow data itself. A green print that breaks the three-day streak would be the first sign the institutional bid is returning. One day does not make a trend, but it would stop the bleeding.
Watch ETHA specifically. It led the selling, so it will likely lead any turn. If the biggest product flips back to inflows, the rest tend to follow.
Invalidation of the bearish read is straightforward. Two or three consecutive green days, with ETHA among the buyers, would tell us the de-risking phase has paused. That would shift the odds back toward stabilisation for ETH.
Continued weakness is just as clear to spot. More red days, especially another large ETHA outflow, would mean the slow money is still leaving. In that case any price bounce stays suspect until the flows agree.
Price levels matter too, but flows lead here. ETH held near $2,427 as the streak ran. A hold there on shrinking outflows is constructive. A break lower while outflows persist would confirm the bearish chain.
Keep an eye on Bitcoin as the risk anchor. If BTC ETF flows stabilise, ETH gets room to breathe. If BTC keeps bleeding too, Ethereum has no cover.
The honest summary is this. We have no single catalyst to point at, so we let the flows do the talking. Green and sustained says the worst is passing. Red and persistent says respect the downside.
Reading ETH's thin bid near BTC support
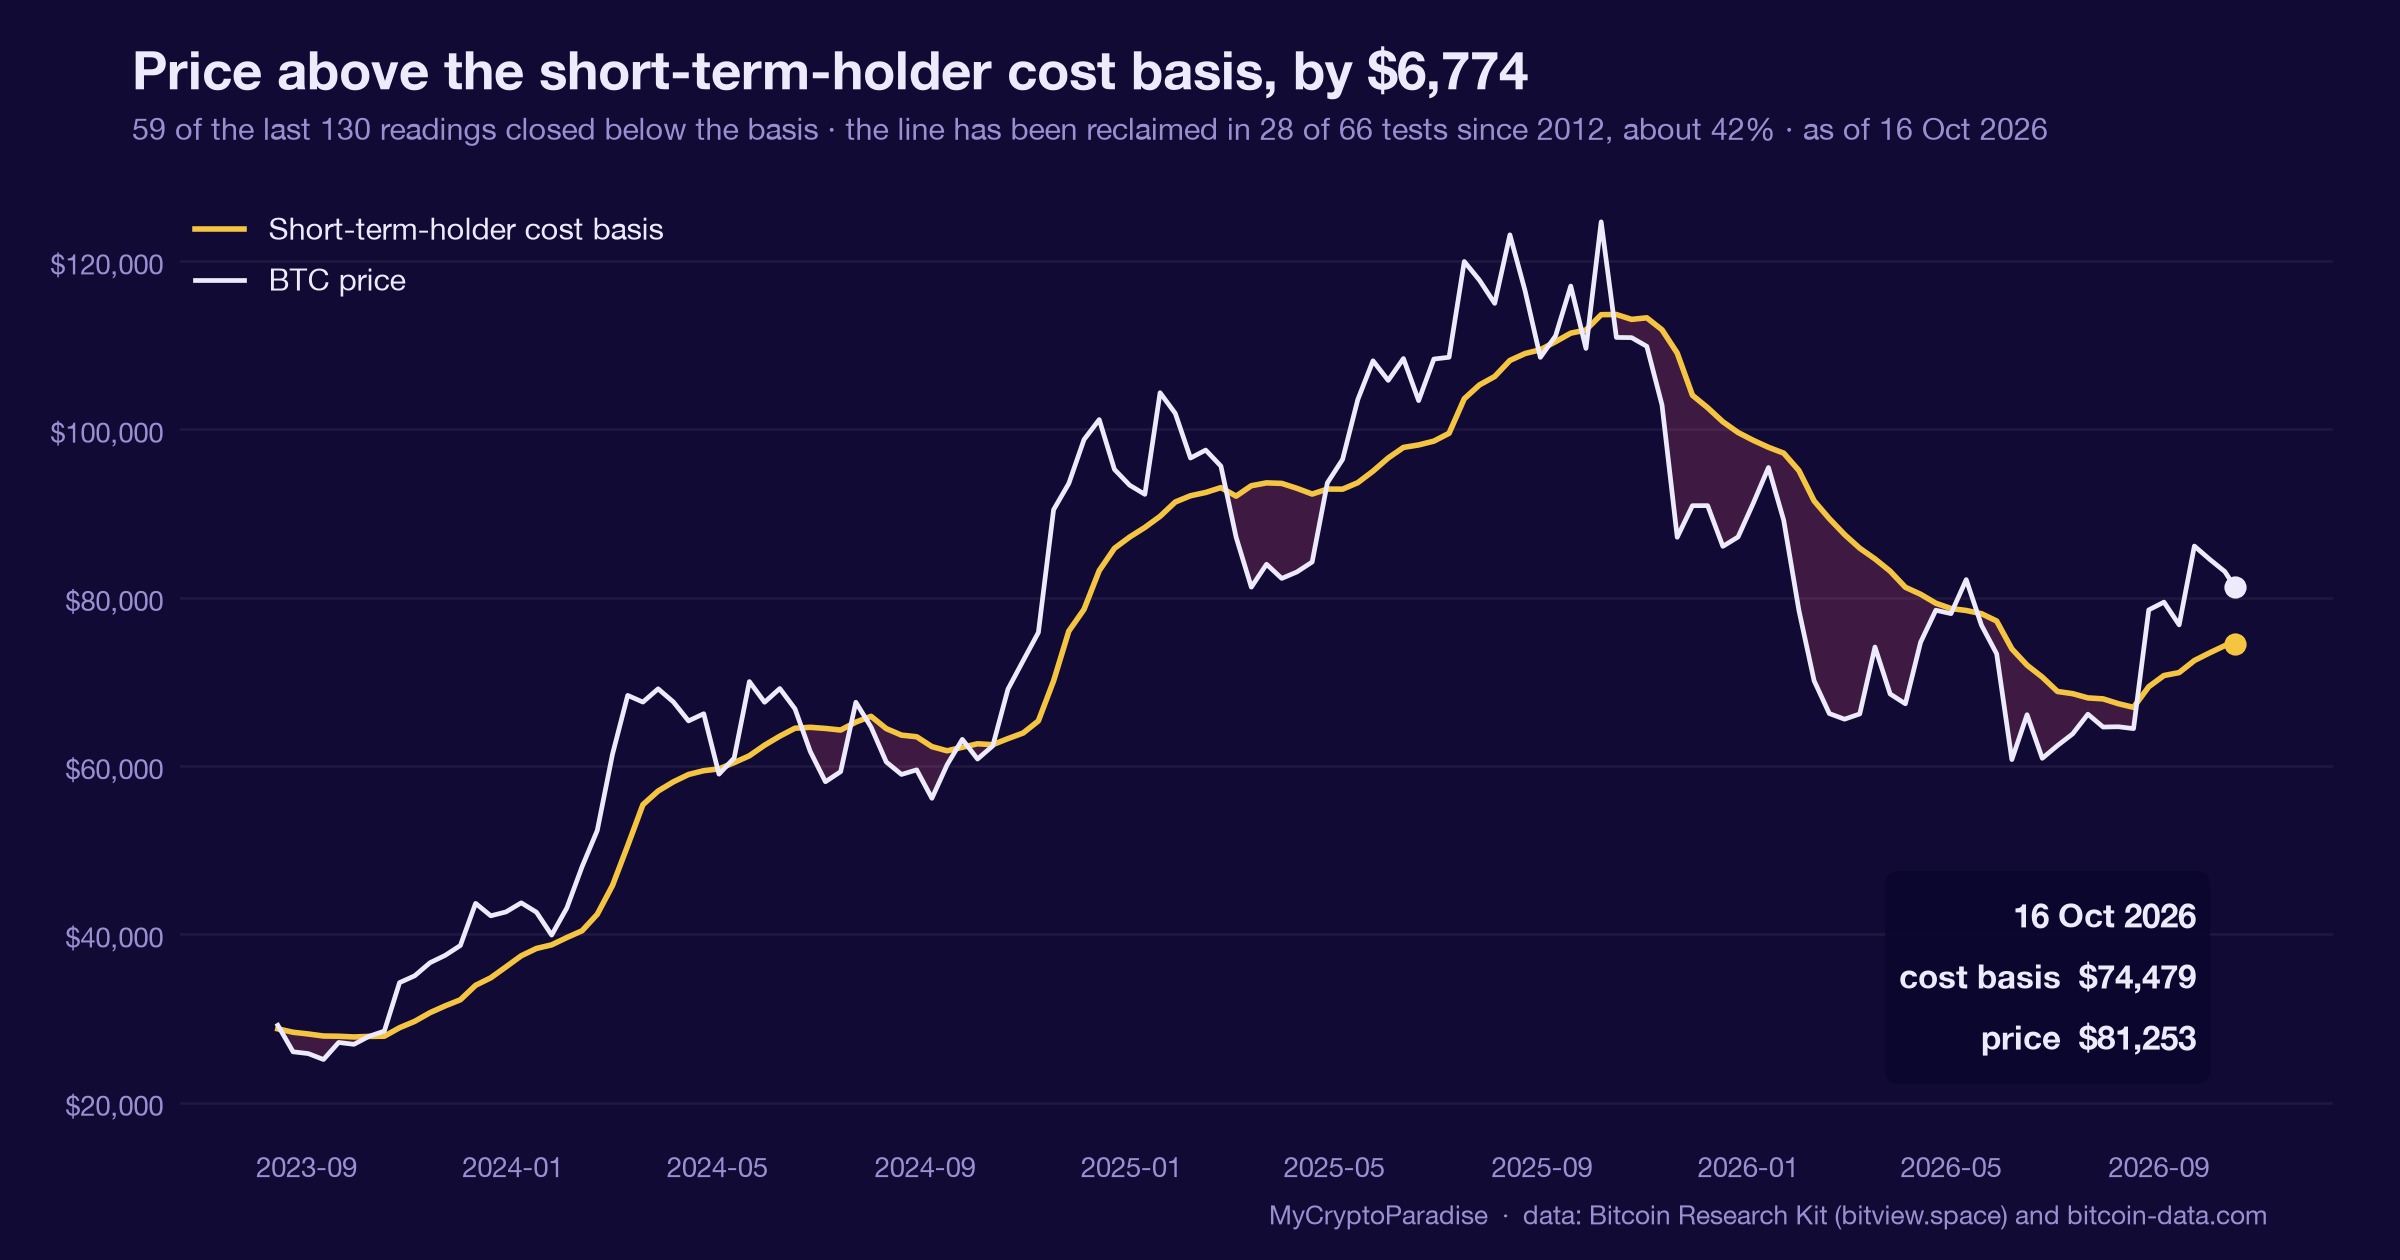
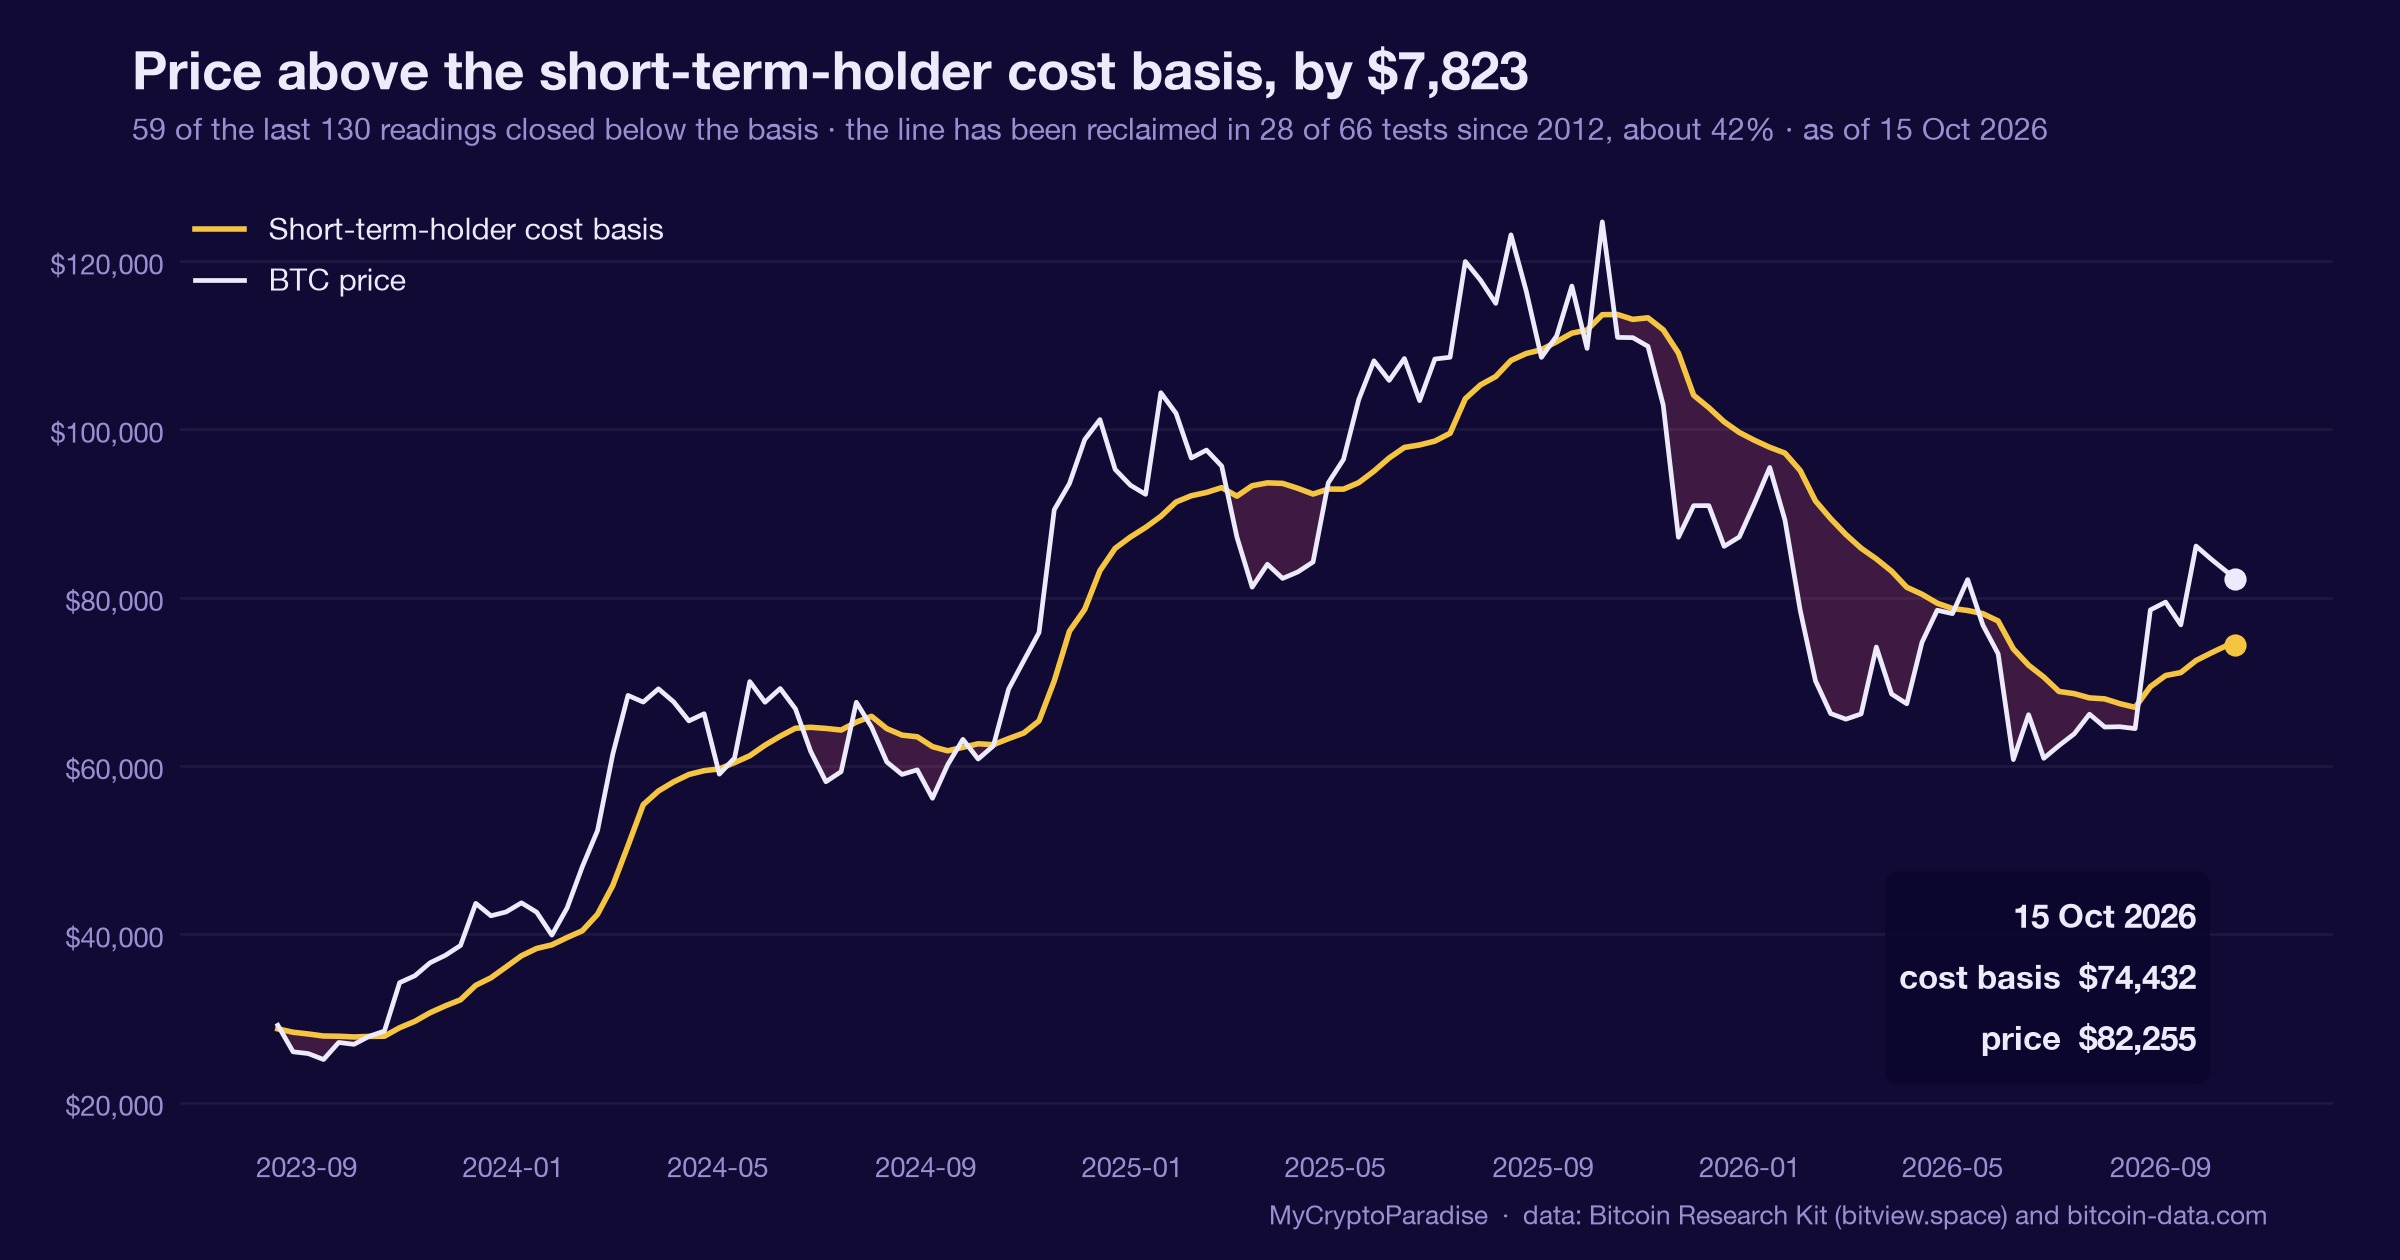
Flows tell one story, but structure tells the ParadiseTeam where the risk actually sits. BTC was trading near $81,482 as of 06:11 UTC on October 17, below the $90,000 resistance that caps the current move. Our standing view expects short-term weakness before any push toward $90,000, with $78,000 as the support that must hold.
The ETF outflows fit that caution rather than fight it. A fading institutional bid is exactly what a pre-correction tape looks like.
We see crowded retail longs and bearish volume divergences across the majors. Positive funding rates show the crowd leaning long into weakness. That is the fuel for a long squeeze, and over $900 million in longs already liquidated recently, with many quickly reopened. A market that keeps re-adding leverage into fading institutional demand tends to get flushed.
For ETH specifically, the ParadiseTeam treats the thin ETF bid as a weakening floor, not a reason to buy on its own. We want to see the flows turn green before trusting any bounce.
The line we watch on BTC is $78,000. A hold there on lighter bearish volume, with spot buyers stepping in, would be our first sign that capitulation is being absorbed. Lose $78,000 and the macro path toward the deeper $44,000 target comes back into view.
The ParadiseTeam stays patient here. We would rather wait for smart money to absorb the fear near a real level than chase a quiet tape that is quietly draining.
The read behind this: we framed this story through our own market analysis, Can Bitcoin Hold Its Final Support?
Track it live: our live crypto funding rates and the Crypto Fear and Greed Index both update in real time, so you can watch this shift for yourself.
Related coverage
For exact entries, targets, and stop losses with full risk management, that is what ParadiseFamilyVIP is for. New to reading these moves? Start with our crypto trading strategies guide.
ParadiseTeam is monitoring the market situation closely, and we are taking these developments into consideration while building our trading tactics inside ParadiseFamilyVIP.
Crypto trading involves substantial risk. Prices are volatile and you can lose money. This article is educational and is not financial advice. Past performance does not guarantee future results.
Do Ethereum ETF flows turn green again this month, or keep bleeding?
This is how 1 Paradiser is calling it. Tap your call.
No calls on this one yet. Tap yours to be the first.
Free account, no password. Members just sign in.












Join the discussion
No comments yet. Members, share how you are reading this.