 MCP Free
 MCP Insights
 PRO Paradiser
 MCP MasterClass
  ParadiseFamilyVIP Crypto Signals💰

Trading Distribution Patterns
In short
Distribution patterns in crypto trading illustrate how buying and selling activity is spread across various price levels. Analyzing these patterns helps traders understand market sentiment, pinpoint support and resistance, and time their trade entries and exits effectively.
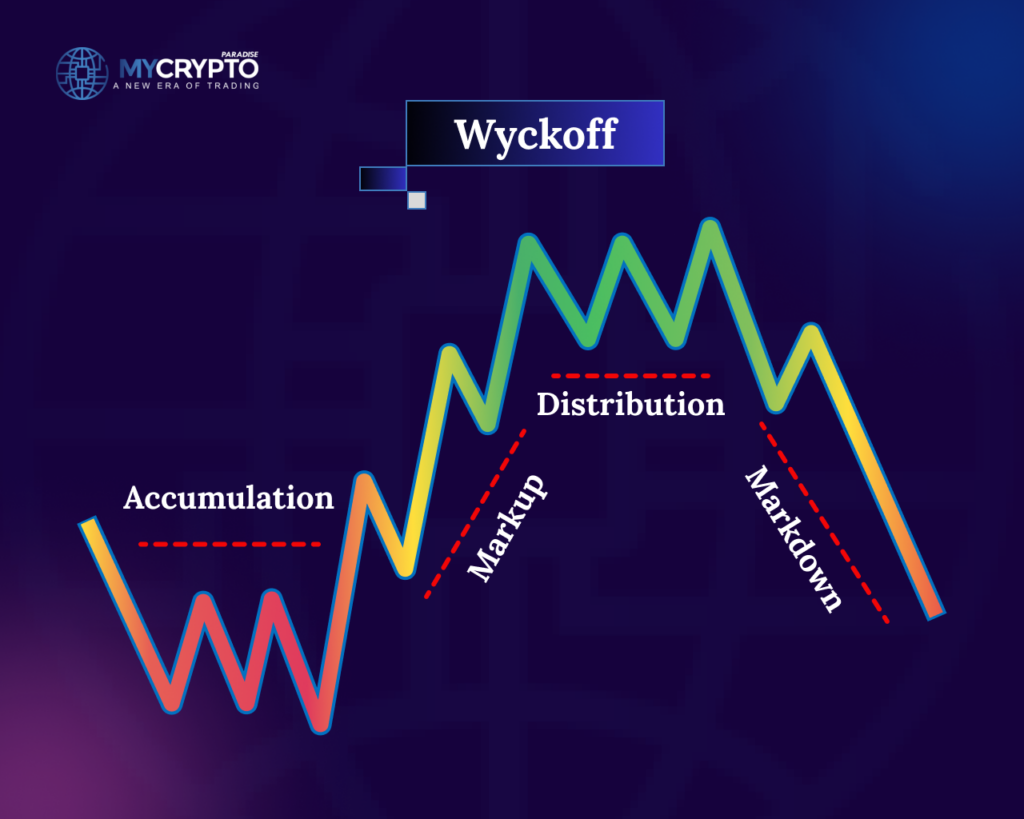
Distribution patterns in crypto trading refer to the way in which buying and selling activities are distributed across different price levels. By analyzing these patterns, traders can gain insights into market sentiment, identify potential trends, and make informed trading decisions.
This article explores the concept of distribution patterns in crypto trading, various types of distributions, strategies to interpret them, and their implications for traders. It also covers the distribution phase, the range that often forms near market highs before a downtrend.
Types of Distribution Patterns in Crypto Trading
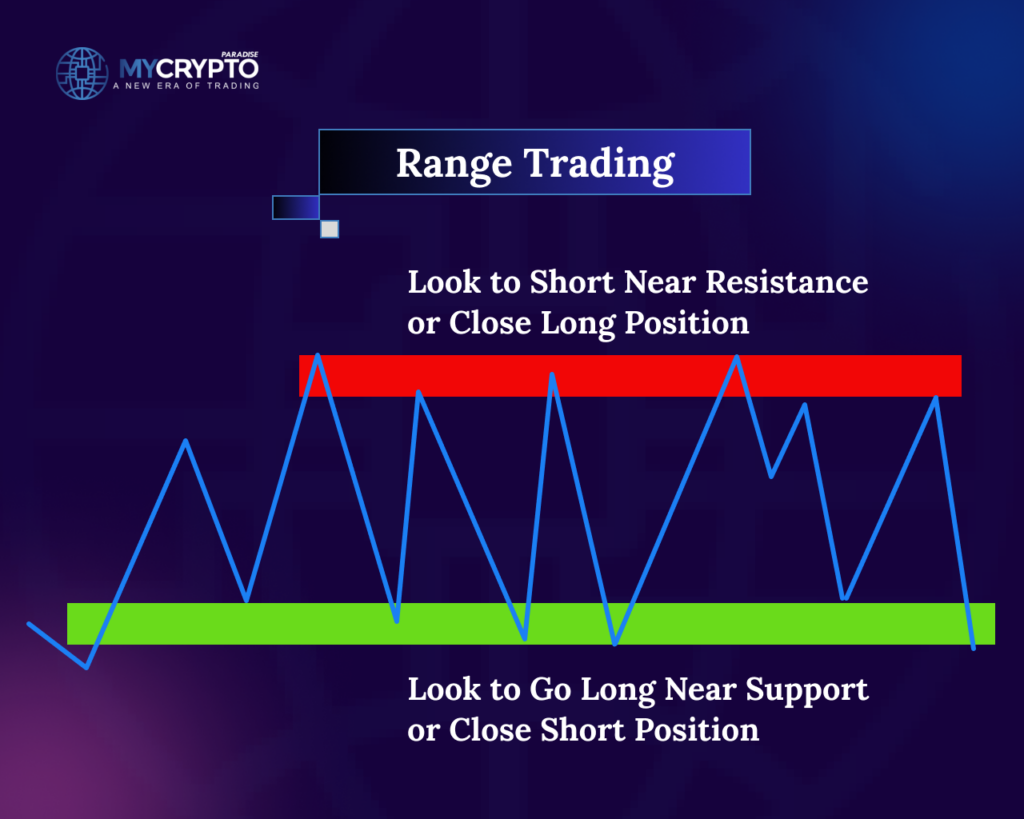
Normal Distribution
A normal distribution pattern, also known as a bell curve, occurs when the majority of trading activity is concentrated around the average price level. In such cases, the market is considered stable, with relatively balanced buying and selling pressure. Normal distribution patterns suggest that the market is in equilibrium, and traders may expect limited price fluctuations.
Skewed Distribution
Skewed distribution patterns arise when there is an imbalance between buying and selling pressure in the market. This imbalance can result in either a positive skew (skewed to the right) or a negative skew (skewed to the left).
Positive skew indicates a higher concentration of buying activity, potentially leading to price increases. Conversely, negative skew suggests a higher concentration of selling activity, potentially leading to price decreases.
Bimodal Distribution
Bimodal distribution patterns occur when there are two distinct peaks of trading activity in the market. This indicates the presence of two groups of traders with different trading strategies or sentiments. Bimodal distributions may suggest periods of uncertainty or conflicting market views. Traders should closely monitor such patterns as they could potentially indicate upcoming price reversals or significant market shifts.
The Distribution Phase Near Market Highs
In chart analysis, “distribution” also names a market phase. It is the sideways range that often forms after a long uptrend, when larger holders sell into continued buying. It is the opposite of accumulation, and it often comes before a markdown phase.
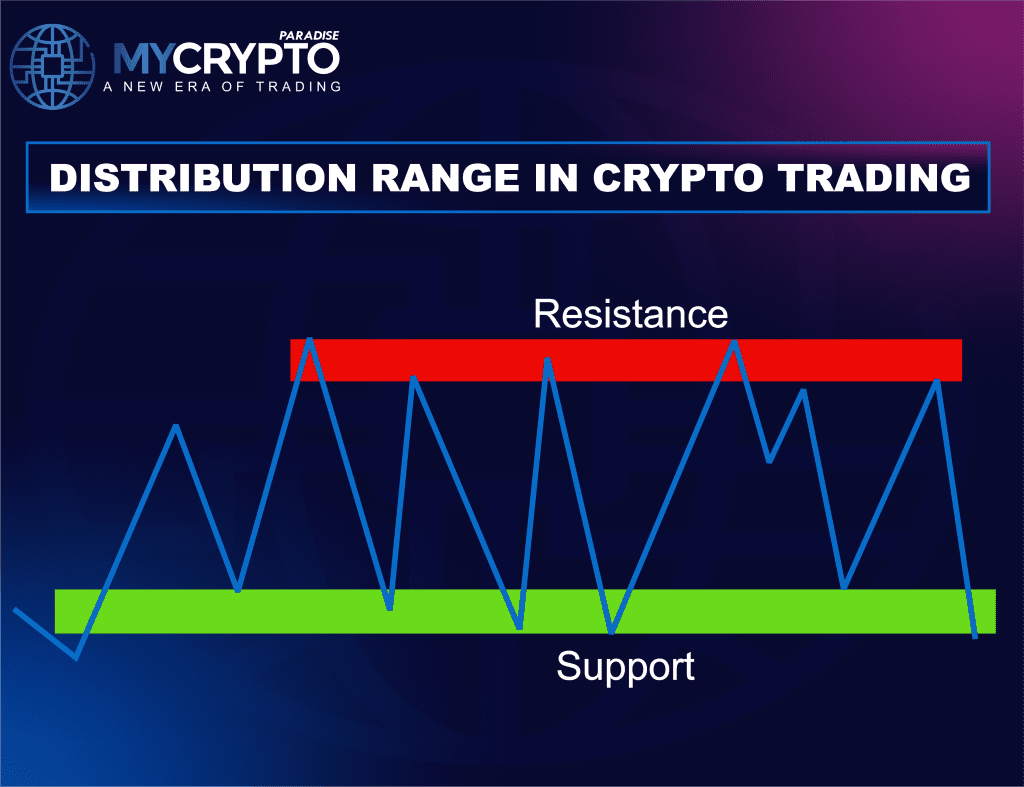
From the outside, the market can still look strong. Price holds near the highs and buyers keep arriving. Under the surface, momentum fades until support gives way.
Sideways Consolidation Near Market Highs
Instead of trending higher, price starts moving inside a broad range near resistance. The range is the market pausing while supply changes hands.
Weakening Bullish Momentum
New highs, if they come, come with less force. Breakouts stall, rejection wicks grow, and price expansion slows. These are signs that buyers are running out of energy.
Bearish divergence is another common warning inside the range. Price makes a higher high, but the RSI makes a lower one.
Fake Breakouts and Stop Hunts
Distribution ranges often produce false breakouts above resistance. Traders who buy the breakout get trapped when price falls back into the range. These moves are often read as large holders selling into the extra demand.
Heavy Volume Near Resistance
Volume often rises near resistance while price struggles to go higher. Strong volume without progress is one of the clearest warning signs of distribution.
Breakdown of Market Structure
Over time the uptrend structure breaks. Lower highs appear, rallies fail sooner, and support is tested again and again. A decisive break of support often starts the markdown phase.
Chart Patterns That Often Mark Distribution
Several classic chart patterns are distribution in visual form. Each shows buyers failing near the highs before sellers take over.
Wyckoff Distribution
The Wyckoff model maps distribution in phases. Key events include the Buying Climax (BC), Automatic Reaction (AR), Secondary Test (ST), Upthrust (UT) and Sign of Weakness (SOW). Our Wyckoff distribution guide walks through each phase.
Double Top
Price tests the same resistance twice and fails both times. A close below the neckline support confirms the pattern and often marks the move from distribution to markdown. See our double top guide.
Head and Shoulders
A left shoulder, a higher head and a lower right shoulder show buying strength fading at each peak. A confirmed neckline break is the usual trigger. Read the full head and shoulders guide.
Broadening Top
Near the highs, price can swing wider in both directions, making higher highs and lower lows. This broadening pattern reflects rising instability before a possible reversal.
Rising Wedge
Price keeps rising, but inside a narrowing range as momentum fades. A break below wedge support often signals that the markdown has begun. More in our rising wedge guide.
Strategies to Interpret Distribution Patterns

Volume Analysis
Volume analysis is a key tool for interpreting distribution patterns. Traders can examine trading volume at different price levels to identify areas of high or low liquidity. Higher volume at specific price levels suggests increased buying or selling interest, indicating potential support or resistance levels. By analyzing volume alongside distribution patterns, traders can confirm or challenge their trading assumptions.
Support and Resistance Levels
Distribution patterns can help identify significant support and resistance levels. Support levels are price levels where buying pressure is expected to be strong enough to prevent further price declines. Resistance levels, on the other hand, are price levels where selling pressure is expected to outweigh buying pressure, preventing further price increases. By identifying these levels within distribution patterns, traders can plan their entry and exit points.
Breakout Strategies
Breakout strategies capitalize on significant price movements that occur when the market breaks out of a distribution pattern. Traders monitor consolidation phases characterized by narrow price ranges within distribution patterns. Once price breaks above or below these ranges, it may signal strong buying or selling pressure and the start of a new trend.
How to Trade a Distribution Breakdown
Trying to call the exact top is a common mistake, because distribution ranges can last longer than expected. A structured breakdown trade is the more patient approach.
Breakdown and Retest Entry
Wait for price to close below the range support with rising selling volume. Then wait for a pullback to the broken support. If it now acts as resistance, rejection wicks or bearish candles there are the usual trigger for a short.
Stop-Loss Placement
Stops for a short are typically placed above the retest high or above the range resistance. The wider stop gives room for the false breakdowns common near tops. Size the position so that a stop-out stays within your risk rules.
Profit Target
Measure the height of the distribution range and project it down from the breakdown point. This gives a structure-based target instead of a guess.
Volume at the Breakdown
A valid breakdown usually shows expanding volume and large bearish candles. A breakdown on weak volume carries a higher risk of reversing back into the range.
Implications of Distribution Patterns in Crypto Trading
1. Trend Identification:
Distribution patterns can provide insights into market trends. By examining the shape and characteristics of distribution patterns over time, traders can identify the prevailing market sentiment, whether it’s bullish, bearish, or ranging. This information helps traders align their trading strategies with the overall market direction, increasing the probability of successful trades.
2. Risk Management:
These patterns assist traders in managing risk by providing information about potential price levels where buying or selling pressure may intensify. This knowledge allows traders to set appropriate stop-loss orders to limit losses or take-profit orders to secure profits. Understanding distribution patterns can also help traders gauge the risk-reward ratio for specific trading opportunities.
3. Market Sentiment Analysis:
Distribution patterns reflect the collective actions and sentiments of market participants. By analyzing these patterns, traders can gauge market sentiment, such as greed, fear, or indecision. This understanding is valuable for contrarian traders looking to take positions against prevailing market sentiment or for trend-following traders seeking confirmation of their trading decisions.
Common Indicators Used to Analyze Distribution Patterns
Traders utilize various indicators and tools to analyze distribution patterns in crypto trading. These tools help them gain insights into market dynamics, identify potential trends, and make informed trading decisions. Here are some common indicators and tools used by traders:
1. Volume Profile:
Volume profile is a graphical representation of trading volume at different price levels over a specific period. It provides valuable information about areas of high or low liquidity within a distribution pattern. Traders analyze volume profiles to identify price levels where significant buying or selling pressure exists, helping them determine support and resistance levels.
2. Moving Averages:
Moving averages (MAs) are widely used indicators that smooth out price data over a specific period. Traders often use exponential moving averages (EMAs) or simple moving averages (SMAs) to identify trends and potential reversals within distribution patterns. By comparing the current price to different moving averages, traders can gauge the market’s overall direction and spot potential entry or exit points.
3. Bollinger Bands:
Bollinger Bands consist of a central moving average line and two outer bands that represent the standard deviation of price movements. These bands help traders identify periods of price consolidation within distribution patterns. When the price reaches the outer bands, it may indicate potential overbought or oversold conditions, suggesting a potential price reversal or breakout.
4. Relative Strength Index (RSI):
The RSI is a momentum oscillator that measures the speed and change of price movements. Traders use the RSI to determine overbought or oversold conditions within a distribution pattern. When the RSI reaches extreme levels (e.g., above 70 or below 30), it may indicate a potential reversal or correction in price.
5. Moving Average Convergence Divergence (MACD):
The MACD is a popular trend-following indicator that consists of two lines, the MACD line and the signal line. Traders analyze the MACD crossover and divergence to identify potential trend reversals or confirm the strength of an ongoing trend. When the MACD line crosses above the signal line, it may indicate a bullish signal. A crossover below the signal line may indicate a bearish signal.
6. Fibonacci Retracement:
Fibonacci retracement levels are horizontal lines drawn on a price chart based on Fibonacci ratios. Traders use these retracement levels to identify potential support and resistance levels within a distribution pattern. Common Fibonacci retracement levels include 38.2%, 50%, and 61.8%, which are considered key areas where price reversals or bounces may occur.
7. Candlestick Patterns:
Candlestick patterns provide visual representations of price movements and market sentiment. Traders analyze various candlestick patterns, such as doji, hammer, engulfing patterns, and more, within distribution patterns. These patterns can indicate potential trend reversals, continuation patterns, or periods of indecision in the market.
8. Market Depth and Order Book:
Traders often examine the market depth and order book to assess the supply and demand dynamics within a distribution pattern. By analyzing the buy and sell orders at different price levels, traders can identify areas of congestion, potential breakouts, or significant support and resistance levels.
It is worth noting that no single indicator or tool can provide a definitive prediction of market movements. Traders often use a combination of these tools and indicators, along with their experience and market knowledge, to analyze distribution patterns and make trading decisions. Additionally, it is essential to consider risk management techniques and use proper position sizing to mitigate potential losses.
Common Mistakes When Trading Distribution
Shorting Too Early
Spotting distribution early is useful, but entering before support breaks exposes a trade to false breakouts and long sideways ranges. Waiting for confirmation costs a little price and avoids many stop-outs.
Ignoring Volume Behaviour
Volume shows whether a move has real participation. Ignoring the divergence between price and volume leads to misreading the range.
Emotional Trading
Euphoria near the highs makes it easy to ignore warning signs. Staying objective is hardest exactly when the market feels best.
Poor Risk Management
Distribution ranges are volatile. Excessive leverage or stops placed without a reason can lead to heavy losses.
Conclusion
Distribution patterns in crypto trading provide valuable insights into market sentiment, trend identification, and risk management. By analyzing these patterns, traders can make informed decisions, identify potential support and resistance levels, and develop effective trading strategies.
Reading distribution well takes practice across many market conditions, and it works best inside a clear plan with defined risk.
At ParadiseFamilyVIP, the ParadiseTeam combines technical analysis, on-chain insights, sentiment analysis, and an understanding of whale psychology with tested trading strategies. Members see the trades and the reasoning behind them.
If you are still building your trading capital, our free Telegram channels are the better place to start.
Distribution Patterns FAQ
What is a distribution pattern in crypto trading?
It is the way buying and selling activity is spread across different price levels. Analyzing this spread shows where volume concentrates, helping traders read sentiment and locate likely support and resistance zones.
What do normal, skewed, and bimodal distributions mean?
A normal distribution clusters activity around the average price, suggesting balance and limited movement. A skewed distribution shows buying or selling pressure dominating one side. A bimodal distribution has two volume peaks, signaling two trader groups and possible upcoming reversals.
Which indicators help analyze distribution patterns?
Volume profile maps liquidity across price levels, while moving averages, Bollinger Bands, RSI, MACD, and Fibonacci retracement add trend and momentum context. The order book and candlestick patterns round out supply-and-demand reading. Most traders combine several rather than relying on one.
How do distribution patterns support risk management?
They highlight price levels where buying or selling pressure may intensify, so traders can place stop-loss and take-profit orders more deliberately. This also makes the risk-reward ratio of a setup easier to assess before entering a position.
Is the distribution phase bullish or bearish?
It is generally bearish. A distribution range after a long uptrend often comes before a markdown phase, but it is not actionable until support breaks with confirming volume.
Crypto trading involves substantial risk of loss. This article is educational and is not financial advice. Past performance does not guarantee future results. Always do your own research.
What is different here
Most guides stop at the theory. The ParadiseTeam shares the live trades, and the reasoning behind each one, inside ParadiseFamilyVIP. Everything here is education, not financial advice.
Crypto trading involves substantial risk and is not suitable for everyone. Nothing here is financial advice; it is education only. Never risk more than you can afford to lose.







Join the discussion
No comments yet. Members, share how you are reading this.