
A double-bottom is a bullish reversal pattern that forms after a downtrend, showing two roughly equal lows separated by a moderate peak. The line across that peak is the neckline. A confirmed close above the neckline, ideally on rising volume, signals a potential long entry, with a stop placed below the second low.
Yello ParadiseSquad, we hope you are constantly honing your trading skills and implementing our regular trading tips and insights. The crypto markets are quite unstable for now, traders need to apply extra caution to execute trades. You may need to join our ParadiseFamilyVIPs to get regular trading signals and make greater profits.
That’s said, we did an article where we talked about the double-top pattern and how to use it to trade crypto. Today, we are talking about the double-bottom pattern. Let’s take a ride together!
When it comes to technical analysis in crypto trading, there are several patterns that traders can look for to identify potential buy or sell opportunities. One such pattern is the double-bottom pattern, which can be a useful tool for traders looking to enter a long position in a cryptocurrency.
In this article, we’ll explore the anatomy of a double-bottom pattern, how to spot it, and how to trade it in crypto trading.
What is a double-bottom pattern?
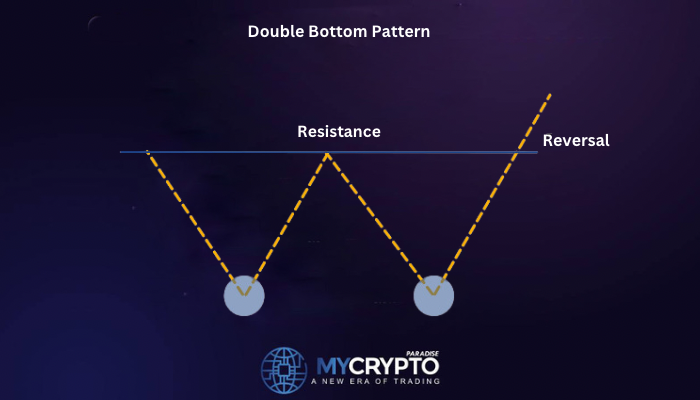
A double-bottom pattern is a bullish reversal pattern that forms after a downtrend. The pattern consists of two lows that are roughly equal in price, with a moderate peak in between. The two lows are connected by a straight line, which is known as the “neckline.”
The double-bottom pattern is considered a bullish reversal pattern because it indicates that the price has reached a point of support and is likely to reverse its downward trend. When the price breaks above the neckline, it is a signal for traders to enter a long position.
How to spot a double-bottom pattern
To spot a double-bottom pattern, traders should look for the following characteristics:
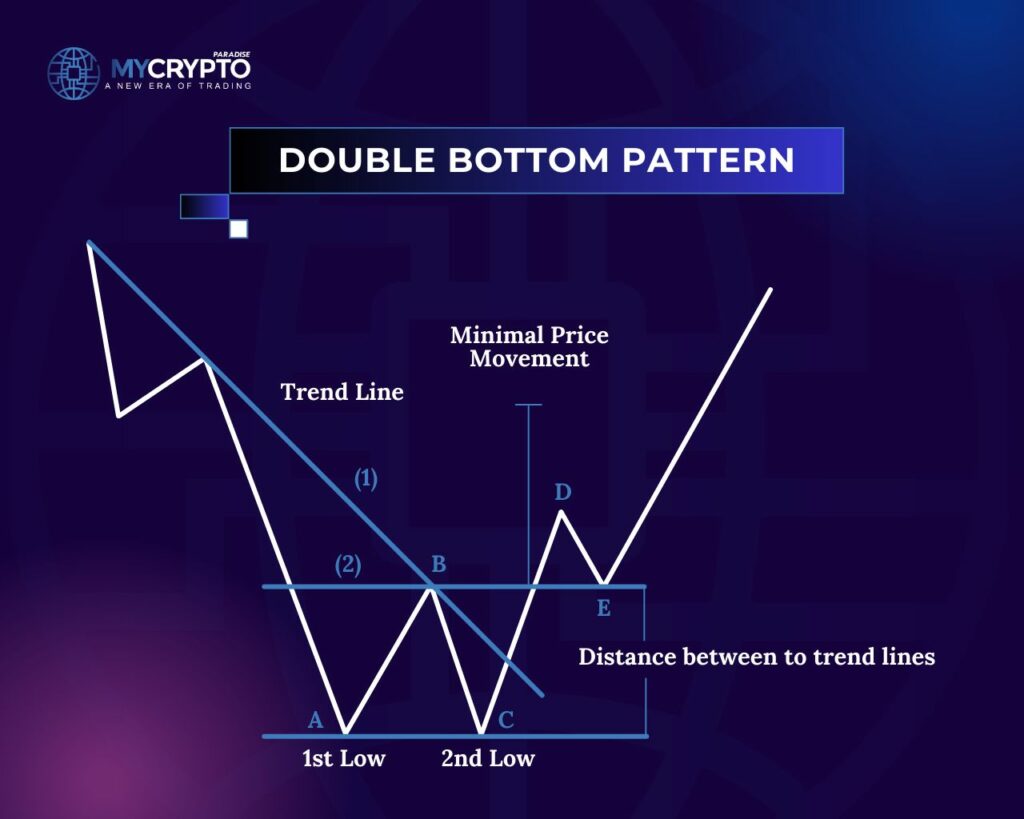
1. Downtrend: The pattern should form after a sustained downtrend, indicating that the price has reached a point of support.
2. Two lows: The pattern consists of two lows that are roughly equal in price.
3. Moderate peak: The two lows are connected by a moderate peak that does not exceed the previous high.
4. Neckline: The two lows are connected by a neckline, which is a straight line that connects the two lows. The neckline should be drawn horizontally.
5. Volume: The volume should be higher at the second low than at the first low, indicating that there is buying pressure at the support level.
Once these characteristics are identified, traders can look for a breakout above the neckline to confirm the pattern and enter a long position.
How to trade a double-bottom pattern
To trade a double-bottom pattern, traders should follow these steps:
1. Identify the pattern: Look for the characteristics of a double-bottom pattern as described above.
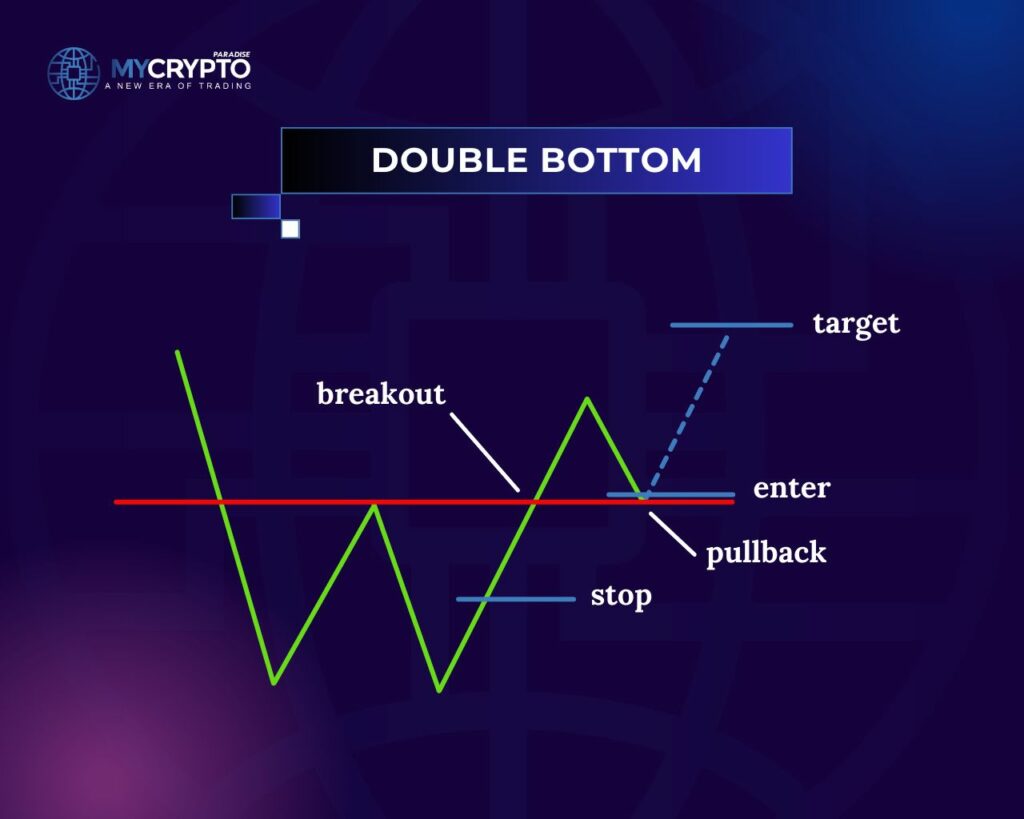
2. Set a stop-loss: Set a stop-loss below the second low to limit your potential losses if the pattern fails.
3. Enter a long position: When the price breaks above the neckline, enter a long position.
4. Set a take-profit: Set a take-profit level based on the height of the pattern. The take-profit level should be at least equal to the height of the pattern, measured from the neckline to the peak.
5. Monitor the trade: Monitor the trade closely and adjust your stop-loss and take-profit levels as necessary.
It’s important to note that not all double-bottom patterns will result in a successful trade. Traders should always use risk management strategies, such as setting stop-loss orders, to limit their potential losses.
Additional tips for spotting a double-bottom pattern
While the characteristics we discussed earlier are the most essential elements of a double-bottom pattern, there are some additional tips that can help traders identify the pattern more easily:
1. Look for symmetry: The two lows in a double-bottom pattern should be roughly equal in price and time frame. If one low is significantly lower or occurred over a longer time frame than the other, it may not be a true double-bottom pattern.
2. Watch the volume: As we mentioned earlier, the volume should be higher at the second low than at the first low. Additionally, traders should look for a spike in volume when the price breaks above the neckline, indicating that there is strong buying pressure.
3. Consider the context: While a double-bottom pattern is generally a bullish reversal pattern, it’s essential to consider the broader market context. If the overall market is bearish, it may be challenging for a single cryptocurrency to break out of a downtrend, even if it forms a double-bottom pattern.
We give free updates and analyses on trending coins like BTC and ETH. We also share secrete insights and free market updates on our telegram channels. Join them below:
My Binance Paradise – https://t.me/MCP_binance
My KuCoin Paradise – https://t.me/MCP_Ku
Tips for trading a double-bottom pattern
Once traders have identified a double-bottom pattern, there are some other tips they can follow to trade it successfully:
1. Wait for the breakout: While it can be tempting to enter a long position as soon as the second low is formed, it’s important to wait for the breakout above the neckline to confirm the pattern. Entering a position too early can result in losses if the pattern fails.
2. Use a trailing stop-loss: As the price rises, traders can use a trailing stop-loss to protect their profits. A trailing stop-loss moves up with the price, ensuring that traders capture as much profit as possible while limiting their potential losses.
3. Consider the timeframe: The timeframe of the chart can impact the accuracy of the pattern. Traders should look for double-bottom patterns on longer timeframes, such as the daily or weekly chart, to increase their chances of success.
4. Combine with other indicators: While the double-bottom pattern can be a powerful tool on its own, traders can increase their confidence in the pattern by combining it with other indicators such as moving averages, trendlines, and oscillators.
Certainly! Let’s explore some additional aspects of the double-bottom pattern and how it can be used in crypto trading.
Advantages of the double-bottom pattern
One of the primary advantages of the double-bottom pattern is that it is a relatively straightforward pattern to identify. Traders can use basic technical analysis tools, such as trendlines and support and resistance levels, to identify the pattern.
Additionally, the double-bottom pattern can be used in conjunction with other technical analysis tools, such as moving averages and oscillators, to increase the accuracy of trading signals.
Another advantage of the double-bottom pattern is that it is a bullish reversal pattern. This means that traders can use it to identify potential buying opportunities after a period of market decline. By entering a long position when the price breaks above the neckline, traders can potentially profit from the subsequent price increase.
Potential drawbacks of the double-bottom pattern
While the double-bottom pattern can be a useful tool for traders, it’s important to note that it is not always accurate. Like any technical analysis tool, the double-bottom pattern is based on historical price data and may not be predictive of future price movements.
Additionally, the double-bottom pattern can be subject to false breakouts, where the price briefly breaks above the neckline before falling back below it. Traders should always use risk management strategies, such as setting stop-loss orders, to limit their potential losses if a breakout fails.
Finally, it’s important to remember that the cryptocurrency market is highly volatile and subject to sudden price movements. While the double-bottom pattern can be a useful tool for identifying potential buying opportunities, traders should always conduct thorough market research and use fundamental analysis tools to make informed trading decisions.
Conclusion
The double-bottom pattern is a useful tool for traders looking to enter a long position in a cryptocurrency. By identifying the characteristics of the pattern and setting appropriate stop-loss and take-profit levels, traders can increase their chances of a successful trade.
However, it’s important to remember that technical analysis is not foolproof, and traders should always use risk management strategies to limit their potential losses. By combining technical analysis with fundamental analysis and market research, traders can make more informed trading decisions and increase their chances of success.
Double-Bottom Pattern FAQ
What is a double-bottom pattern?
It is a bullish reversal pattern that forms after a downtrend, made of two roughly equal lows with a moderate peak between them. It suggests the price has found support and may reverse upward.
How do you confirm a double-bottom?
Wait for the price to close above the neckline, the horizontal line drawn across the peak between the two lows. A volume spike on the breakout adds confidence that the move is genuine rather than a false breakout.
Where do you set the stop-loss and take-profit?
Place the stop-loss just below the second low to limit losses if the pattern fails. A common take-profit target is the height of the pattern, measured from the neckline to the lows, projected up from the breakout.
On which timeframe is a double-bottom most reliable?
Higher timeframes such as the daily or weekly chart tend to produce more reliable patterns. Combining it with moving averages, trendlines, or oscillators and checking the broader market trend further improves accuracy.
Crypto trading involves substantial risk of loss. This article is educational and is not financial advice. Past performance does not guarantee future results. Always do your own research.