


In short: Simon says Bitcoin sits at support near $80,100, where smart money appears to absorb short-term holder selling. He sees higher probability of a push toward $90,000 as the fifth wave, with $78,000 as downside risk. Weekly remains bearish since $121,000, so he waits for more confirmation.
Can Bitcoin recover to $90,000 from here?
Track it live: our live crypto funding rates updates in real time, so you can watch this shift for yourself.
Simon says the higher probability is still a push toward $90,000 before a larger rejection. Bitcoin is holding a support zone near $80,100. He frames this as the fourth wave, with a final fifth wave targeting $90,000. More confirmation is needed before he acts.
Above the market he marks resistance clusters at $82,500, then $89,000 and $90,000. He notes a possible extension toward $99,000. You can track these on the Bitcoin key levels page.
Why does Simon think support will hold?
Simon points to smart money quietly absorbing selling pressure. A tracked whale opened a Bitcoin long near $80,100 on October 24 and still holds it. On-chain data shows short-term holders realizing losses, echoing August before a bounce. Spot CVD shows buyers stepping into dips.
The crowd felt fear but has started recovering from a near-extreme. Simon notes they have not yet touched greed, which leaves room to the upside. Momentum on the RSI made a lower low while price held $79,000, hinting at absorption.
What do funding and liquidation data show?
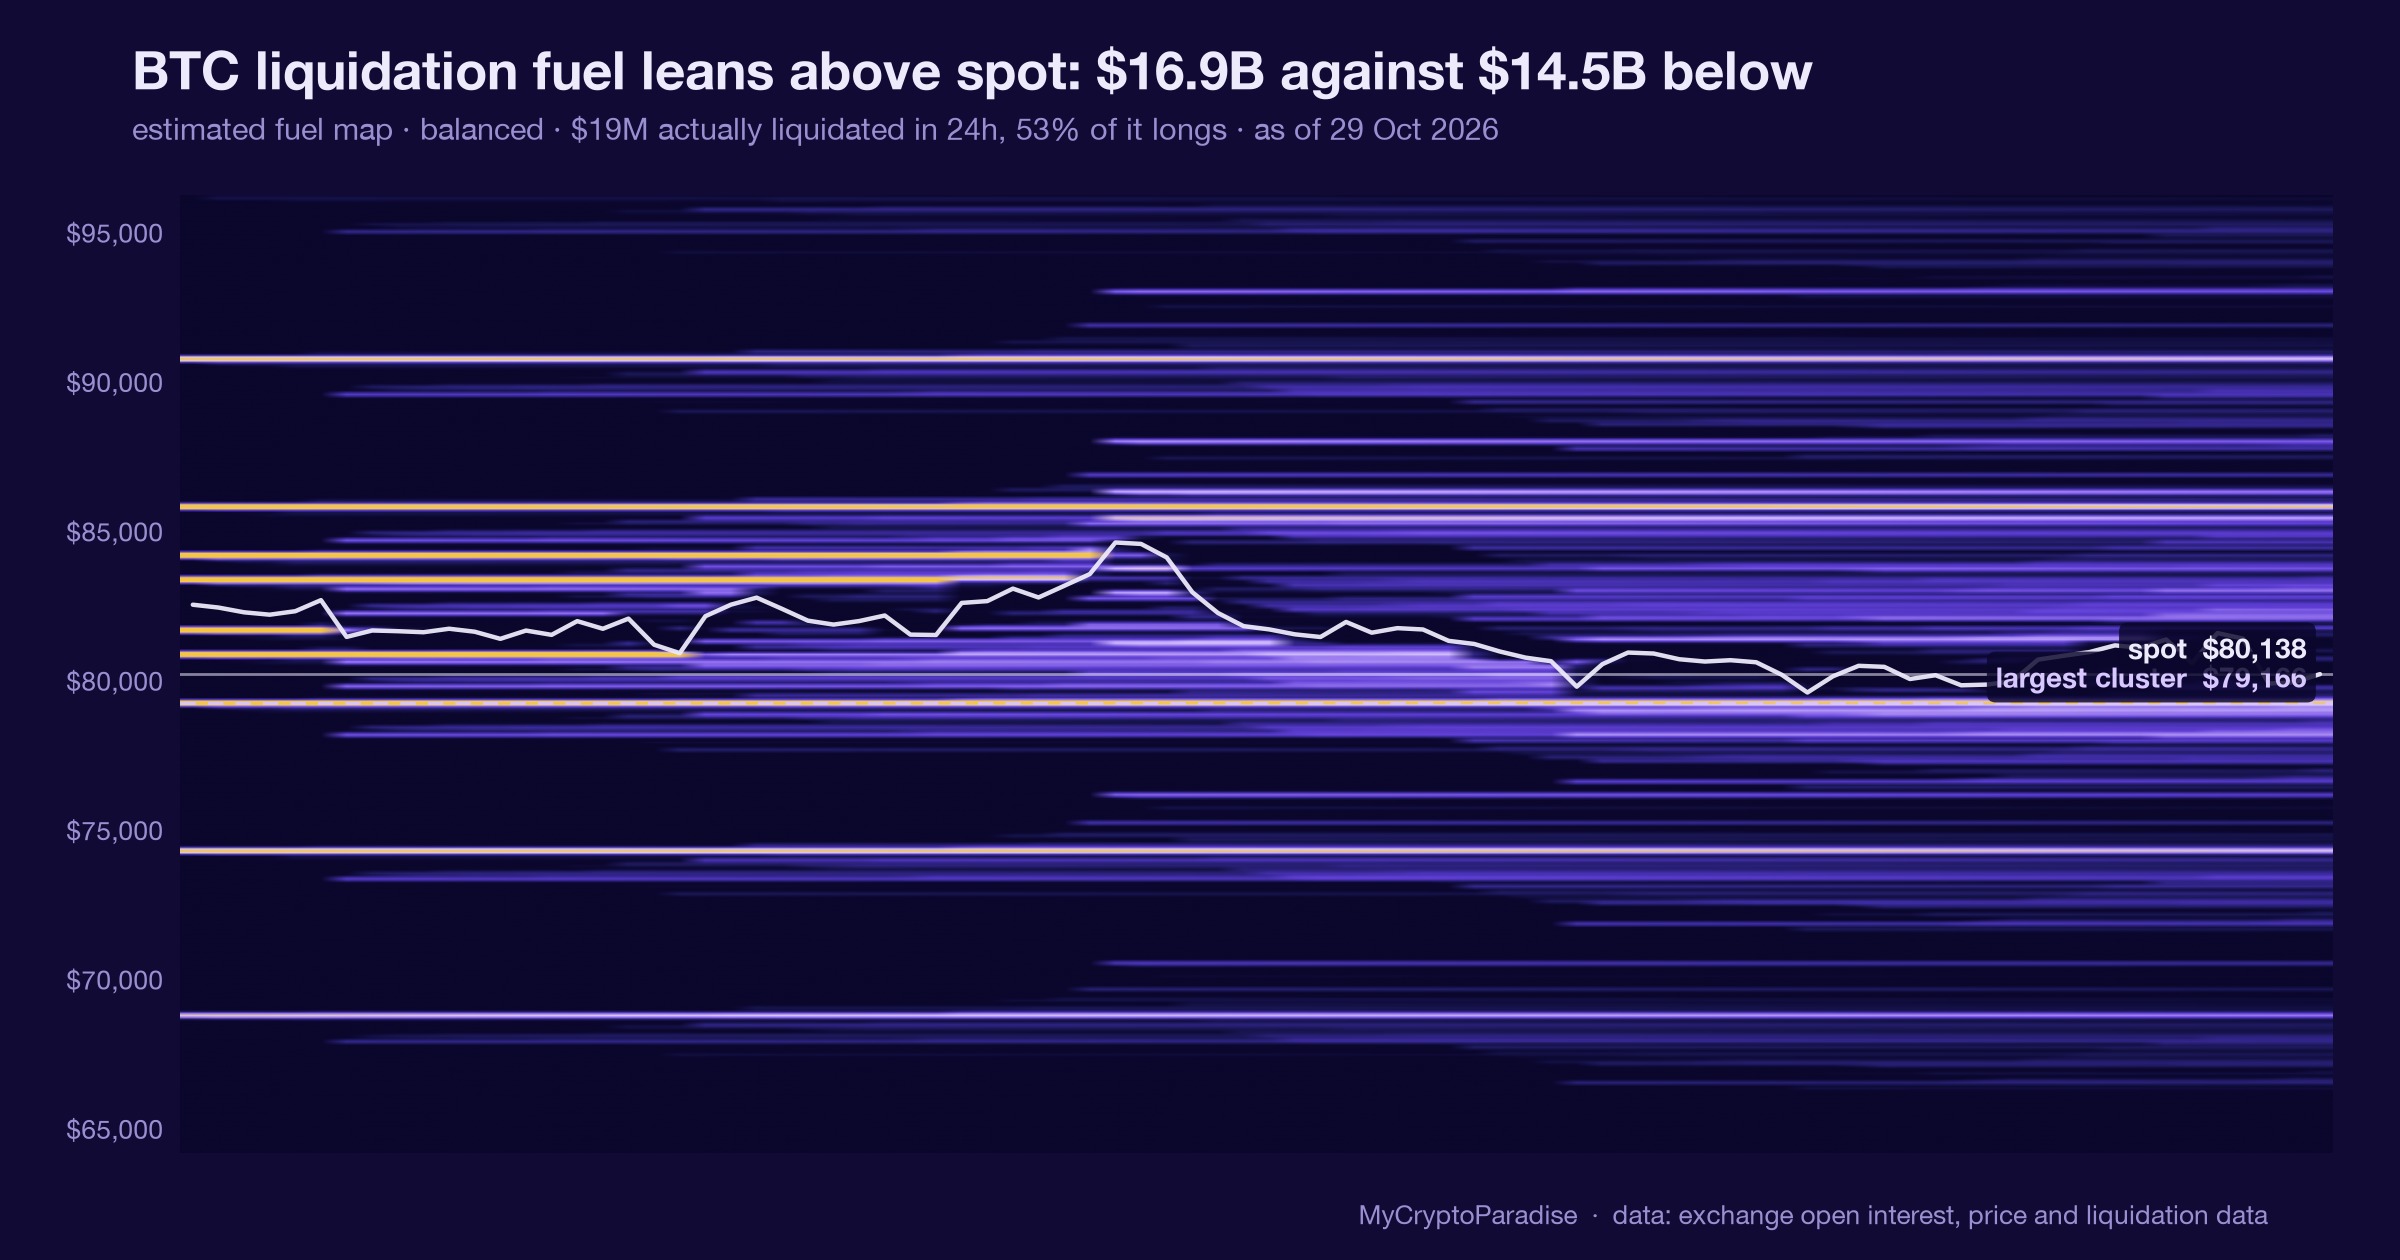
Funding rates are positive and longs are crowded, giving a 36% long squeeze probability on the one hour. Simon says a push to $78,000 would liquidate nearly $3 billion in longs. Above, a move to $89,000 would liquidate about $11 billion in shorts.
That imbalance matters. With far more liquidity above, Simon says market makers find it easier to push price up through clusters. You can follow positioning on the funding board.
Below, $78,000 lines up with a 0.786 Fibonacci level and heavy volume profile support. Simon says pushing below it is hard, since little liquidity sits there to work with.
Is Simon trading this long or staying patient?
Simon is patient. He wants a clear five-wave push up, then a corrective decline that holds $79,000 or $78,000. That setup would let him enter a tight-stop long targeting $90,000 first. On weekly and daily he stays bearish. He leans on bearish tactics there.
On the four hour and one hour he leans bullish, since bears keep losing momentum at support. He stresses capital preservation and surviving black swan events. He would rather miss a trade than risk capital on a weak setup.
He also notes the weekly stays bearish since $121,000, with a reaccumulation zone he watches at $55,000 to $44,000. His approach follows strict position sizing and capital preservation.
Frequently asked questions
Can Bitcoin reach $90,000 from here?
Simon says the higher probability is still a push toward $90,000, formed as a fifth Elliott wave before a larger rejection. Bitcoin is holding support near $80,100. He wants more confirmation, like a clean five-wave move up and a shallow corrective decline, before trading it with bullish tactics.
Where is Bitcoin support according to Simon?
Simon marks support at $78,000 and $79,000, with the current zone near $80,100. He says $78,000 lines up with a 0.786 Fibonacci level and heavy volume profile support. Pushing below it is hard, since little liquidity sits there for market makers to work with.
What does the long squeeze probability mean here?
Simon cites a 36% long squeeze probability on the one hour, driven by positive funding rates and crowded longs. He says a drop to $78,000 would clear those longs and reset funding toward neutral. Above, far more liquidity sits near $89,000, favoring upside moves.
Is Simon bullish or bearish on Bitcoin?
Simon is mixed. On the weekly and daily he stays bearish, still working bearish tactics since $121,000. On the four hour and one hour he leans bullish, because bears keep losing momentum at support. He waits for a clear invalidation before changing his medium time frame view.
MyCryptoParadise has run a professional crypto signals and trading-education service since 2016, led by founder Simon Mach and the ParadiseTeam. Simon records these sessions three times a week, and every episode lands on the Bitcoin video analysis hub.
Video transcript
Auto-captioned from the video audio and lightly cleaned, so it can contain transcription errors; the video itself is the record. It is speech, not a written article; for the structured breakdown read the sections above.
Short-term Bitcoin holders have started to realize their losses. The last time they were so aggressive, the Bitcoin market makers absorbed that selling liquidity, created a short-term bottom and then Bitcoin pumped. Given that Bitcoin is currently at support zone, can we see something similar happening behind the scenes?
Can Bitcoin push towards $90,000 now? Let's analyze the probabilities. Hello ladies and gentlemen, this is Simon from MyCryptoParadise. Welcome back, is great to be here. Today is Tuesday and that means that you're watching the first video of this week. So in the intro we have went through that the short-term holders are realizing their losses.
Last time that happened was in August and afterwards because the market makers absorbed that selling pressure. We have pumped right afterwards because the momentum started to slow down. There was no sellers left and then the only way to go was upside because the path of least resistance was to the upside.
In this video we will need to understand if something similar is happening right now also on the short-term time frame. So we understand that we are at support, we also understand that right now open interest is rising without the price moving. So what's going let's analyze first of all we will go through the whales okay so we understand in the past 24 hours it's basically 50-50 right what the smart money is
doing so we need to go a little bit lower because there is also not much divergence between the crowd and what the whales are doing so we need to go a little bit lower and we need to take a look at the whale leaderboard alright and let's take a look at some whale that for example in the past two years done pretty much and other things.
So, for example, Kiel right here, if we take a look at what kind of position he has on Bitcoin right now, we can see that on October 24, which is just a few days ago, he opened Bitcoin long position, and where he has entered, around the price we are at right now, $80,100.
And we can see that he's still in the long position on Bitcoin, right? So that's something that is bullish, because we can see the smart money is actually respecting the support, which is increasing the probability that it will halt, right? But this is not enough, let's take a look what the crowd is doing.
So on the daily timeframe, we can see that we are not in any extreme, no fear extreme, no greed extreme, but what is important is that we are much closer and we have actually started to recover from the fear almost extreme right and we have not yet afterwards touched the greed extreme which is usually what's happening right so as you can see for example back in June we have went into an
extreme fear right and then we have went through some zig-zags and then we have touched the area again and then the cycle resumed right and right now we can see since we We are at important support that pretty much that was nicely confluence with what the crowd were doing right so they were feeling fear so we can also understand that that is the reason they have started to realize their losses right
because they thought the price is going to go much lower so we have it confirmed on on chain we can see that they will realize in their losses and also we can see that sentiment wise they have actually really felt fear There is the difference.
Do I feel fearful and am I acting on it? Yes or no? If I'm acting on it, I'm going to start selling and opening some short positions. We can see that most of the people actually acted on it because they were aggressively selling, realizing their losses from the short-term perspective.
The next path is towards the next extreme, which which is extreme greed. We have not yet touched that. So that's increasing the bullish probabilities as well from the short term perspective. However, right now, if you take a look at the funding rates, they are quite positive, right?
They are quite positive and we can actually see that there is on multiple time frames, on one hour time frame, it's even bigger, long longspiece probability quite high 36% on Bitcoin right now and it's caused mainly because of the positive funding rates that we are seeing right now so longs are being crowded if we take a look however at our Bitcoin exchange liquidation map we can understand okay longs are being crowded
but clearly you can see with me the imbalance right if we will start pushing pushing to the downside towards around $78,000, we will get rid of those longs that are crowded right now and the funding rates will resume to neutral, maybe even negative if people will start shorting, right?
So if we will start pushing towards $78,000, we will liquidate, go in there almost $3 billion worth of long positions, right? but then there is pretty much no liquidity for the market makers to be able to slide the price action with, right? So it will be very hard after hitting $78,000 to continue further down.
However, if you take a look on the other side, there is a lot of liquidity to work with. So as you can see, if you will start pushing towards $89,000, almost $11 billion worth of short positions will be liquidated, all right? So we need to understand the difference between what we are seeing on the short term versus the medium to long term, alright?
So right now we understand that the funding rates are positive but what it's telling us right now is only what's happening from the short term perspective and if we take a look at the context, we can clearly see that the context is that if you'll get rid of this cluster of those long positions, the funding rates will resume back to normal, right?
but if we take a look at the medium to longer timeframe, we can understand that the funding rates look quite opposite, quite differently and that is also why we have those timeframes right here, accumulated month, year, etc. So this is important to watch out for.
Then if we take a look also what's going on on the price section, so we can see the open Open interest is increasing, but from the higher degree perspective, we are at multi-month low from the open interest. So this is not that crucial right now.
The data that we are watching from what the futures are doing is not as important as it was for example a few months ago back in September or July, right? So at this moment, not much new positions are being opened. So even though we can understand that some long positions are getting right now into the market, we can see that it's nothing that would move the market a lot.
So if we take a look, however, at the liquidity, we can understand this as a liquidity that can help create these kinds of domino effects. So given that above us there is much more liquidity above us, it's going to be much easier for for the market makers to push the price to the upside because of the domino effect, right?
So we need to understand there are some clustered short positions right now above us, right? And if you will start liquidating them, right? If you will push towards that liquidation level, they will need to be closed, right? And how you close the short position?
Well, you need to buy the contracts back, right? so it automatically pushes the price further, further towards the next liquidation cluster, and next and next, so the market makers will be able to just push the price a little bit, are able to push the price a little bit towards the next important cluster, that is for example right here at $82,500, right, and that will help to push Bitcoin towards the next one,
and then towards the next one, and that's how the domino effects are being created. However, for pushing the price thread outside, they will be able to do it maximum towards that 78,000 dollars, which is nicely confluencing with our technical support made with this Fibonacci retracement level 0.786, which is also being supported by this heavy VPVR volume profile.
So a lot of confluence at this level, also from the historic price section, as you can and see it worked as a support, then also as a resistance, very important level this one. So pushing below it, right, is going to be hard also from the liquidity perspective.
So for the market makers, it's not as profitable to right now fight this support as it is to fight the sell walls above us and start pushing towards that clusters to create the domino effect, much more profitable, right? So let's take a look.
First of all, we understand that $78,000 pushing down here is still structurally okay given that we are right now in this Bitcoin bullish structure. We can still push towards $78,000 without breaking the Elliott Wave pattern that we are watching where we are right now creating the fourth wave and the final fifth wave should push us towards $90,000 before the bigger rejection that we are watching on the higher-degree timeframes.
So, you know, on weekly timeframe, we are still bearish since 121,000 dollars. We are waiting for 55 to 44,000 dollars zone, right, to re-accumulate aggressively the bags that we have been distributing at the tops right here. So, still, weekly is bearish, but we also understand the probabilities and we have been discussing that in the previous video, I will not be repeating that same daily daily time frame on Bitcoin.
I'm not looking to trade daily with bullish trading tactics. I'm being patient for bearish trading tactics, even though I know there is a high probability before the big reversal, we can push towards $90,000. But simply, as I've explained in the previous video, it's not the probabilities and the risk around on the daily time frame is not good enough for me to play with bullish trading tactics.
So it's better to be patient. What we can see, however, what is a little bullish is this divergence. That is not yet confirmed. As you can see, the AI that we are having inside of these indicators still says no etch, but also saying bearish, pressing down, and on the lower timeframes, then you will see what it's saying on the lower timeframes, because it's not confirmed yet, but you can clearly see that
on the RSI we have created a lower low, but on the price section, we are holding that 79,000 shares. and it's very hard for the bears to push through it and create the lower low as we are seeing on the RSI. So it's not confirmed bullish divergence but we can clearly see that the price action is holding stronger and the momentum is kind of declining but is not able to push the
price below the previous low which is suggesting that somebody might be absorbing that selling and momentum, right? So we are back at the intro. There is right now high probability that the smart money very silently behind the scenes not to cause any noise is actually absorbing that selling pressure.
We need obviously more confirmations, but momentum is one of the key ones, right? And watching the smart players. We can see definitely that there is no extreme leverage in the market because of the open interest still kind of moving sideways at these lows.
So nothing dangerous from that perspective. What we also observe right now on the cumulative volume delta on the spot that somebody is actually buying the pushbacks to the upside. So that's bullish. CVD cumulative volume delta spot, that's smart money versus the open interest, futures, leverage, borrowed money.
That's dumb money, right? So having this kind of divergence from the higher degree perspective is important to watch. Nothing extreme, right? But it's also nothing extreme from the bearish side that would tell me, all right, we have broke below this previous low. Obviously smart money is a selling.
We don't see that, right? We can actually see that there has been the smart exchange. So the CVD is not rising much, but we are slowing down the momentum and that is how we are able to see the early bullish divergences, even though they are not confirmed yet.
But on the lower timeframes, on the medium time frame here, we can clearly see, right, that we are having a bullish cross already, bullish cross on the MACD, but on the RSI, we can see also a bullish cross, but no edge, still not no edge, no confirmed bullish divergences as well, okay?
But we can clearly see bearish, but firming, all right? And given that we are above support, this is telling me it's not probably a great idea to right now be in some over-revelaged short position, all right? So I would probably, if I would be in a short position, I would start covering.
And if I would think about a short position, I would think twice, until we can can reclaim this support from below and turn it into resistance, as we have already said in the previous video, that will start attacking the previous first wave and it will increase the probability that the bullish structure we are watching right now will be broken, right?
And that the push towards 90,000 dollars is actually decreasing on probability and we might Let's take a look at the one hour time frame and here we can clearly see already what we are seeing on the higher degree time frames. The momentum, right?
That the momentum is slowing for bears and even though they are pushing right they are not able to move the price much and it's clearly visible right here on the MACD again we can see that the price is creating lower low but clearly we have created a higher low right here and now we are creating I would say equal lows but we can clearly see that the momentum is going up and
up right so the bears are losing momentum at this moment, given that we are at support, it's going to be pretty hard for them to push through it, unless there is going to be some new fresh volume coming in, which we already said, if there would come some new volume, it would come from some smart money, and given that the smart money are watching what we are watching, you and me together,
they probably can understand, it's probably not going to be profitable much for me to push through those buy walls, given that there is not enough liquidity below to help me drive the price lower and lower. So the path of least resistance is actually the upside.
I'm going to be better off buying Bitcoin, helping the market makers trigger the clusters, right, and helping to push it towards the next important resistance, which is at $90,000, right? So structurally, this makes better sense, but we understand the markets can stay irrational longer than you can stay solvent.
That is why risk management is extremely important, ladies and gentlemen, it is possible, even though it's a lower probability right now, that we will start pushing to the downside, right? So we need to be prepared for absolutely everything for the Black Swan events, right?
And if the Black Swan event happens, our portfolio needs to be able to survive. That is why MyCryptoParadise focuses on capital preservation. We would rather miss a trade than risking our capital and the capital over our clients unnecessarily. So surviving the short-term volatility, the short-term randomness and being prepared for the big Black Swan events is absolutely crucial if you want to be long-term profitable.
Right now, the higher probability is still a push towards $90,000 before a larger rejection to the downside. But from a provisional training perspective, more confirmations are needed, at least for me, to be able to create some nice high probability and a great risk-reward long position.
So what I have said that I'm waiting for in the previous video is clearly push to the upside, right? I want to see an inhale from the market that will subdivide itself into five smaller waves and then I want to see exhale on decline in volume and corrective mode wave patterns, so only 3 or variations of thereof sub-waves and that will allow me to see also when I will get more confirmations
like from Candlestick parents etc and if this or this support will hold so either on that decline the 79 or 78 thousand dollars support will hold that will allow me to create a nice high probable long position catching the third wave where I will be able to place my stop loss quite tightly towards the enterprise and the exit target will be much further away, right?
First or second, I would place towards that $90,000. Third and fourth in this resistance zone, as we know, there is a possibility that we can even push towards that $99,000, right? So we will see the reversals we have established in the previous videos.
So better probability for me to right now work with bullish trading tactics, focus on bullish trading tactics on the medium time frame until I will see a clear invalidation that the market structure on the medium time frame is also starting to change into bearish market structure as we are seeing on the higher degree time frames as weekly or daily, right?
So weekly, daily, I'm still bearish and focusing on bearish trading tactics. However, medium time frame, four hour and low time frame, one hour, it's much better, better to focus on bullish trading tactics. Ladies and gentlemen, trade safe, trade with professional trading strategy, I will see you again on Thursday and until then, take care, cheers!
Please set up, please set up
Educational content, not financial advice. Crypto trading carries substantial risk; you can lose your capital. Past performance does not guarantee future results.












Join the discussion
No comments yet. Members, share how you are reading this.