


Did you catch our recent MCP YouTube stream here, where we warned ETH was about to skyrocket? Here’s why the big players are already moving.
Key Highlights:
- BlackRock sold 1,249 BTC and bought a staggering 27,241 ETH, signaling a sharp pivot toward Ethereum.
- Ethereum ETFs saw $321M in inflows last week, hitting 2025 records, while ETH’s exchange supply has plunged to a seven-year low.
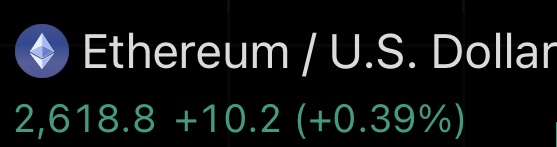
Yello Paradisers! Ethereum is back on fire, up 4.28% in the last 24 hours at $2,621, riding a wave of institutional money that’s not just trickling in, it’s flooding in. Last week, ETH-based ETFs attracted $321 million, far outshining Bitcoin, which bled $8 million in outflows.
And here’s the kicker: BlackRock, the world’s biggest asset manager, just sold over 1,200 BTC while scooping up more than 27,000 ETH, a massive vote of confidence in Ethereum’s next leg up.
If you watched our recent MCP YouTube analysis, you already know we’ve been calling this:
Ethereum is setting up for a breakout, and the smart money is getting into position.
Why the Setup Is Screaming “Bullish”
With ETH exchange supply dropping to 2017 levels, we’re not just seeing traders flip coins, we’re watching long-term holders stack for the future. Combined with record ETF inflows and BlackRock’s strategic reallocation, the market is flashing strong signals that ETH could push well beyond the $2,600-$2,700 range soon.
Meanwhile, Bitcoin is facing seasonal June weakness, and Ethereum is stepping into the spotlight, strengthening fundamentals, rising institutional demand, and growing confidence are laying the groundwork for what could become a major rally.
Don’t Just Watch, Act Before the Wave Hits
We’re unpacking BlackRock’s moves, ETF-driven momentum, and what traders should expect in our upcoming MCP YouTube stream.
For just $3/month, MCP News Private gives you exclusive deep dives, ETH positioning strategies, and institutional tracking tools, plus priority entry to ParadiseFamilyVIP, where top-tier members get insider signals before the big price swings.
Think about it: $3 is less than the fee on your last ETH swap, or it’s your front-row seat to the rally we’ve been calling before the market fully wakes up.
Join now. Because when BlackRock pivots, the smart money is already moving. Are you?
Video transcript
Auto-captioned from the video audio and lightly cleaned. It is what was said, not a written article; for the structured breakdown read the sections above.
While everybody is buying Bitcoin at the top, institutions are silently accumulating Ethereum. The Bitcoin major rally is already over. It's Ethereum season now. And if you don't want to miss the next big move, watch this video where I predict the next price action.
Hello ladies and gentlemen of the Paradise Club. This is Simon from Market to Paradise. Together, you and me. In the previous videos, we have been analyzing Ethereum. I have told you with the highest probability, we will retest this support level and then we will see an uptrend.
Then I have kept you updated about this idea and as you can see right now we have done exactly that. We have retested this level and then we have seen an uptrend and right now we are up by around 19%. However, the question is what's going to happen next?
Because right now we are below this ascending trend line. We are crashing at the moment. What's going to happen next? Well, in the previous and latest ones videos, I have told you about these resistance levels. This one and this one on low time frame.
So, if we shift our focus on low time frame, we actually see that we have hit already both of them. So, does it mean that we are going down right now? Well, in the latest video, in the last one that I've recorded for you just 2 days ago, we have been talking about this extremely important resistance area around $2,700, right?
That was on our medium time frame and as you can see we have got rejected from it. However, we have retested also the moving average trend line and we jumped above it. All right, with kind of nice volume. What does it mean? I will be explaining that in this video.
But first of all, let's take a look at something nobody for some reason is talking about and that is the decoupling that Ethereum is seeing versus Bitcoin. Look at this for example. It's only on smaller time frames visible. Right now we are looking at 4hour time frame.
So this is a candle top on Bitcoin that happened on 27th of May. All right. And as you can see the price action of Bitcoin since then is bearish. We have created a local top right here and then we have created a lower high.
However, as you can see on Ethereum, this is 27th of May. All right, this candle right here. And did we also created a lower high? Did we created a bare trend? No, we created a bullish trend. We have created another higher high and one more.
What does it mean? Well, Ethereum is having a bull trend. However, Bitcoin is having a bare trend. And this is exactly what I have been talking about when this wasn't happening just yet. All right, as a professional trader, you always need to be much earlier than everyone else.
So, understanding the context in the market is very important. And we have been talking about the money flow, how the money is flowing from Bitcoin into Ethereum into altcoins. We are having these cycles on our website mryparadise.com. It is perfectly explained for you.
So you can trade based on it. And as you can see, I will not go into the money flow in this video again because I have been updating that many times in the previous week. If you want, just watch the previous videos from the last week.
But as you can see right now, the Ethereum dominance is actually gaining strength versus the Bitcoin dominance. Okay. So even though the crypto total market cap is decreasing, Ethereum is having a bull trend. Why? because it's eating the volume from Bitcoin. As you can see, Ethereum dominance almost 5% increase just today and Bitcoin dominance lost volume.
All right, this is just confirming the bias of Ethereum decap from Bitcoin and I do believe still that the Bitcoin major trend is already finished. I've explained the exact price action and the scenario in the previous video in the last one. So, go and watch it if you haven't.
In this video, I want to fully cover Ethereum because the price action we are having on Ethereum is just so beautiful. So, let's have a look what's going on behind the scenes. Let's understand this move lower towards our support right now. So, what's happening?
First of all, during any crashes, you firstly need to ask yourself what's happening during the drops. Okay, that's your question that you need to ask yourself while analyzing the market. So, what is happening during this crash right here? As you can see on our order book depth, we are having an increased amount of buy limit orders below us.
Right? What happened previously during this crash when the order book depth was was increasing afterwards we have seen a surge to the upside and the same thing is happening right now as well. The price action is going down however the order book depth the buy limit orders are increasing.
This is good sign. Next thing what's happening during this crash with open interest. What you don't want to see is an increase open interest. That means that new contracts are being opened and together if you confirm it with a spot volume. This is a bearish sign, right?
However, what we can see right now is decreasing open interest. That means that this selling pressure with the highest probability isn't strong enough to break through all of these walls we are having below. So another thing is that you want to see what's going on with the walls on both spot and futures exchange.
This is on futures exchange and you can see we have multi-million orders right here exactly that support on which we'll be talking about in a minute about these supports below us and as you can see it's covered by millions millions and millions of limit buy orders not only on a futures exchange but also if we take a look on the order book of Ethereum on a spot exchange we can actually see
that below us until around $2,600 it's really full of buy limit orders and above us the resistances are very very thin, not as thick as the buy limit orders below us. Right? So basically all of this tells us that the higher probability is not suggesting that we will be able to crash through all of these buys.
Okay, we have also the VPVR right here and it actually suggests that the support above which we will be talking about in a few minutes will hold. Okay, another thing what you need to ask yourself dur during any crashes or upside movements is what you don't want to see.
You need to understand and ask yourself what I don't want to what don't I what I don't want to see as a whale in the market. Okay. So as a whale what you don't want to see if you want to play a bullish side on the uptrends you don't want to see a market buying versus distribution on a limit orders.
Okay. So the CVD plus is showing us the market buying versus market selling. The order book suit is showing us distribution versus accumulation with limit orders. Okay. So as you can see as we have went to the upside on May 23 we have had increase of market buying.
However there was a distribution going on by the crypto whales. Okay. And because of that we have resulted in a downward pressure afterwards. It wasn't sustainable. This kind of thing is not sustainable for a continuation. Again what happened right here? The same thing.
All right. We have an increase of market buying. Probably there was loads of fear of missing out etc. However, there was a distribution going on and it resulted at with a selling pressure to the downside. This was actually the $2,700 level about which we have been talking about in the previous video and I told you with the highest probability we will see some kind of a reaction to the downside, right?
However, what you want to see in a downtrend, that's another question you need to ask yourself. So, in a downtrend is the opposite, right? You want to see panic selling on market orders and some kind of an uptake of accumulation. And we have seen exactly that right here on the CVD right here on the order book suit and this is also the reason why after that we have seen a surge to
the upside right and what can we see right here so we are having a downward pressure we know that we are at a support we will be talking about that support in a minute however what's going on so we are having a market selling pressure all right so panic selling however we can see some kind of an uptick from order book suit from accumulation perspective of limit orders and this is actually
bullish Right. So we can see that with the highest probability the support at which we are at right now will probably hold. However, this is not enough. Right? We need to take a look therefore at some charts to understand the price action development to increase our probabilities of a bullish or bearish side.
Okay. So what we can see right here we are looking at a channel that I'm analyzing for you for around few weeks already. you know that after this bare trend we have started a new uptrend that I do believe will sustain much much longer.
However, this can change any time. Okay, that is why constant monitoring of the price action is extremely important. So as a professional trader, you can adjust your trading style immediately if something changes. Right? So as you know we are in this impulse. However, right now it all looks quite normal.
We are subdividing itself into five smaller waves. 1 2 3 4 5. This fifth wave is right now in creation. All right. However, can we sustain the fifth wave to hit around $3,500? Well, let's firstly let's have a look at the impulse and how it subdivides itself.
All right. Because right now you have something very textbook like you know that we are updating you with the Paradis team about every single wave. And right now I do believe that we are in the fifth wave. And as you know the fifth wave in order for you to be able to correctly determine that this is really a fifth wave of an impulse you need to be able to calculate also the
five smaller waves. All right so each motive mode wave of an impulse which means the first third and the fifth one subdivides itself into five smaller waves. All right. And each of them has its own guidelines and rules that needs to be always respected in order for you to make a better trading decisions and understand the price action development correctly.
So let's have a look what we have right now. We have been analyzing the subways of the first, second, third, fourth wave as well. And right now let's take a look at the fifth wave. Okay. So I do believe that the fourth wave finished right here in that expanded triangle that we have been updating for you in the previous videos.
And right now there is a possibility that we are having a fifth wave that will take us towards this next resistance right here. So from the bottom at this support level we have started a new fifth wave ladies and gentlemen. And if everything goes well we can go towards $3,500 something around this level.
But it's not going to be that easy. Right now we are below this ascending trend line ladies and gentlemen and we have a very high risk of creating a shooting star candle. That would be very bad. But firstly let's calculate a subwave. So this was the first wave.
Second wave right here we have created a nice bullish hammer candlestick pattern that helped us again to increase and understand that the probabilities are on a bullish side. Right. And if everything goes well we are about to start finishing the third wave right here around $3,000.
All right. That's the next resistance. How did I calculated the next medium time frame resistance? Well, I've taken a look at the previous price action. I've placed my Fibonacci retracement tool from the local top to the local bottom. And as you can see here, exactly right here, I will place a horizontal line to that level around $2,990.
There is a Fibonacci level 1.618. And this is very the most important actually Fibonacci sequence level from all of them. All right. So this will act very strongly. However, we cannot go there if this daily candle which is closing in 7 hours will close as a shooting star because that would be a great sign of a market local top and a reversal about to happen.
All right. So, what I don't want to see is exactly what we have prepared for you on our website markettoparadise.com where you can see all of the candlestick patterns and match them with the market price action. So if we will see a shooting star it will decrease the probabilities for bulls and we will be looking for a reversal to the downside.
Okay. So right now the daily candle is closing within 7 hours. It is starting to look like a shooting star. We are also below this ascending trend line ladies and gentlemen. So if it's going to close as a shooting star there will be a higher probability that we will have some higher price action to the downside some kind of reversal and then we will need to recalculate what's going to happen next.
Definitely what I wouldn't like to see is a close below the lower degree secondary wave of our new impulse that is trending inside of that fifth higher degree wave. Right? So I do believe that right now we are starting the third wave. However, if something happens for example the shooting star that will be a high probability that this is going to be breaking the count that we are having right now and
something else is happening and we will need to reanalyze. So monitoring the market is extremely important. And that is exactly what we are doing inside of paradise summary VIP where we are sharing our personal trade setups with you with the exact entry and exit targets within a larger strategy system that is back tested by more than 9 years of data that we are having and thanks to which we know that we
will be long-term profitable during every cycles in the market. Why? Because we have an edge, right? Which is extremely important for long-term professional profitable trading. So right now what we are looking at on this daily time frame on this high time frame chart is bullish.
As long as we don't close this candle as a shooting star and we don't break below this support level which is the end of the secondary wave from the Eliot wave theory rules. this would actually broke the structure and we would be looking for a reversal lower right however right now it seems okay as far as this doesn't close as a shooting star and I do believe that we can very soon
start hitting this next resistance that is positioned at around $3,000 right so the preferable price action right now given that we hold above this moving average trend line and above this support and we don't close this shooting star that would increase the probabilities of a reversal given that this will hold.
We can say with a nice amount of probability that we will go towards $3,000. All right? But from the lower time frame price action, we need to be careful, okay? Because we can actually get much earlier signs than this shooting star or a closure below this support by looking at what's going on on the lower time frames.
So because of that, let's zoom in inside of 4hour time frame and let's have a look what's happening right here. So after we have hit this target, we have went to the downside. We have retested the moving average trend line and then we jumped above this resistance on the medium time frame.
However, we have not been able to reclaim it. As you can see, we got a successful break to the upside. Then we started to go down. However, we have not been able to shift this resistance into support because as you can see the retest wasn't successful and we have dropped below.
Okay, this is unsuccessful reclaim which is bearish. For a bullish continuation, we need to reclaim this resistance. Have a successful retest for a continuation higher for a bullish continuation. Okay, from a medium time frame, what I don't want to see is an early sign of closing below $2,600.
All right. If we will have a bearish reclaim that means break the retest this into a resistance then there will be an increased probability that we will have a reversal lower. Together with that we need to be careful because we have right now a bearish divergence forming right here.
As you can see the price action is making a higher high. However, the momentum is not there on the MACD histogram indicator. You can see that we are creating a lower high and basically that means that the bullish momentum is not as strong as we would like to have for a bullish continuation and the bears can take over.
That is why it's extremely important to hold this support zone. Okay, that is also why we are seeing loads of buy limit orders right here because the bulls know that if we will break below this below the $2,600 it will be bad. Okay, it will increase the probability that we will continue lowered.
Therefore, we need to secure this support zone heavily if we want to continue to the upside. For that, we need to therefore zoom in inside even lower time frame to understand even better the probabilities and early indications of what can happen next. Immediately on a 1 hour time frame, we can actually see that we are having a bullish divergence.
Same indicator make the indicator. As you can see, the histogram is making lower low but the price so far is holding well. Okay, that is also the thing that we have been talking about in the previous videos and what can actually confirm what we have been analyzing right here.
Right, there is a panic selling that means retail loads of people are creating the panic momentum, right? Selling momentum. However, the price is not following because somebody is accumulating the selling pressure, right? And that is what's creating this bullish divergence. The momentum is there, right?
Loads of market selling. However, the price action is not following. Henceforth somebody big is accumulating the selling pressure the liquidity it's being eaten by some big boys right so this is a bullish divergence henceforth one hour time frame from this kind of perspective is bullish another thing what is bullish is the understanding of the price action development so from the higher degree perspective this was the first wave and I'm talking about
this one right then we had a secondary wave and we have been updating you about the subwaves so we know that it was a classic ABC henceforth It was correct by the Elliot wave theory rules and we have with the highest probability set all right this is going to be the bottom.
Together with that we have been creating the head and shoulders pattern. The inverse head and shoulders pattern where this was the left shoulder, this was the right shoulder, this was the head and then we had started break upside. Right? And basically the third wave of an impulse as you know from our website is subdividing itself into five smaller waves.
1 2 3 4 5 right. So by being able to calculate the waves properly you can understand if we are intact with the price action the favorable price action development or not. So after the secondary wave we have actually created first wave, secondary wave, third wave, fourth wave, fifth wave.
Okay. And I do believe that it was a first wave of the third wave. What I mean by that we have created this wave right here of the larger third wave. All right. And I do believe that right now we are finishing the secondary wave.
And if the rules will comply with us, we are about to have a third wave. So let's have a look at this. Okay. So this was the first wave that finished right here. I've put the number one right here. Then we had and still have an an ABC correction.
And I do believe that if we will not close first of all below the fourth wave right here, below this area right here below the 2,600 basically the probabilities are increasingly bullish for a continuation much higher. Okay. If however we will start reclaiming this support into resistance, the probabilities will decrease and the probabilities of a bullishness on this 1 hour time frame will absolutely disappear if we will start crossing and reclaiming
below this bottom of the secondary wave. All right. So what I don't want to see definitely is a reclaim of this support into a resistance. That would be very bad and we would need to recalculate. However, if right now we are stopping and we are successfully defending that $2,600, ladies and gentlemen, after a reclaim of this moving average trend line, I do believe that I can with a high probability, a high
conviction say that we are about to have a search to the upside towards around $3,000 to be exact towards exactly this level right here that we have calculated by using the Fibonacci retracement tool. So I do believe that everything right now pointing to the upside and if we will not have any bearish confirmations we will start going towards this resistance right here towards that $2,990 and we will form the third wave
of our impulse. All right and about the upcoming price action what's going to come after this I will keep you updated in the next videos. So in this video we have discussed what we don't want to see right for this bullish scenario to be intact.
What we want to see for confirmations so breaking reclaiming of the $2,700. We want to see a reclaim of the $2,700 for sure. Okay, we have been talking about the Ethereum and Bitcoin decap and in the next videos I will keep you updated not only about the price action but also about the money flow and something very interesting coming in the next video.
you know that I updating you about the market situation every Tuesday, Thursday and Saturday. So I will see you again on the weekend on Saturday.
Educational content, not financial advice. Crypto trading carries substantial risk; you can lose your capital. Past performance does not guarantee future results.














Join the discussion
No comments yet. Members, share how you are reading this.