


Listen: the breakdown
Market briefing: Bitcoin ETF inflows hit a third straight week near $241M, yet Bitcoin held flat near $85,766, stalling under $87,400 resistance as traders await key macro data.
- US spot Bitcoin ETFs drew roughly $241M last week, a third straight weekly inflow.
- Bitcoin traded $82,560 to $87,219 and closed near $85,300, leaving the week roughly flat.
- Price stalled near $87,400 twice as fresh demand met heavy supply at resistance.
Bitcoin ETF inflows just notched a third straight week, yet price barely moved and stalled near resistance. Is this quiet accumulation before a break, or a trap?
US spot Bitcoin ETFs drew roughly $241M in net inflows last week. That was their third consecutive weekly gain. Institutional money kept arriving, steady and unhurried. The buying did not pause for a round number or a headline.
Yet price barely budged. Bitcoin traded between $82,560 and $87,219 all week. It closed near $85,300, essentially flat.
The contrast is the real story. Fresh demand met a wall of supply near $87,400. The advance stalled there twice. Buyers pushed, sellers answered, and the tape went sideways.
No single catalyst explains the stall, so we treat that as our read, not a confirmed cause. We see absorption, not weakness. Markets paused ahead of key macro data, including ISM readings and FOMC minutes. Traders wanted clarity before committing size, and that caution capped the range.
Bitcoin was trading near $85,766 as of the latest print, down about 0.8% on the day. The grind simply continued.
Market capitalization now sits near $1.74 trillion. The structure looks like coiled consolidation, with demand building beneath a firm ceiling. A move like this rarely stays quiet forever.
Why steady fund inflows tighten Bitcoin supply
ETF inflows are not just sentiment. They are structural demand. Each dollar in a spot fund buys real Bitcoin. That supply then leaves the open market and sits with custodians.
Three straight weeks of inflows tighten the available float. Less coin trades freely. When demand persists and supply shrinks, upward pressure tends to build over time.
The transmission runs through liquidity. ETFs convert traditional capital into spot bids. Those bids absorb sellers near resistance. That is a key reason $87,400 held without a collapse back toward the lows.
Macro is the counterweight here. Markets await ISM data and FOMC minutes. Both shape rate expectations. Easier policy loosens liquidity and favors risk assets like Bitcoin.
So two forces meet in this range. Steady fund demand pushes up. Macro uncertainty pins price down until the data lands. The result is a coiled range, not a clean trend.
For traders, the quiet signal is accumulation beneath the surface. Retail sees a boring chart. Larger players keep adding through the fund wrapper. That divergence usually resolves in the buyer's favor, though never on a guaranteed schedule.
How inflows ripple from Bitcoin to alts
Read through the inflows, the near-term lean is constructive. Sustained institutional demand rarely reverses in a single session. It builds a floor under price.
Start with BTC. The $82,000 zone has held as support. Buyers keep defending it. Fund inflows reinforce that floor with real spot bids.
Resistance sits at $87,400, then the $88,000 to $90,000 band. A clean break opens room toward $99,000. Until then, Bitcoin coils.
ETH follows BTC's lead in this setup. A confirmed BTC breakout would lift ETH first. Ether tends to catch the second wave of rotation once Bitcoin leads.
Alts sit last in line. They stayed subdued all week. Thin liquidity means they need BTC strength before they move. No breakout, no alt rotation.
The cascade is simple. Inflows firm BTC, BTC leads ETH, and ETH feeds alts. Each step needs the prior one to confirm. Skip a step and the move stalls.
Smart money appears to be absorbing supply near resistance. That looks like accumulation, not distribution. A tight range is often where larger players build positions while retail waits for a signal that already passed.
The $87,400 break that decides direction
The decision point is $87,400. A daily close above it, on rising volume, would confirm the buyers. That outcome validates the inflow-driven read.
Watch volume closely. A breakout on thin volume often fails. Real demand shows up as expanding participation, not a quiet drift higher.
The $88,000 to $90,000 band is the harder test. Price has stalled near there before. A rejection with heavy selling would flip the short-term picture.
Invalidation sits below $82,000. A decisive break of that support, on strong volume, ends the consolidation. That would open downside risk toward lower macro zones.
Macro data is the trigger. ISM readings and FOMC minutes land soon. Softer inflation signals or dovish minutes would ease liquidity and favor the upside.
Hawkish surprises do the opposite. They tighten conditions and pressure risk assets. Forecasters sound confident in both directions, as they always do.
Also track the ETF flows themselves. A fourth straight inflow week strengthens the bull case. A sudden shift to outflows would be the first real crack in the demand story.
What three inflow weeks mean for positioning
The ParadiseTeam reads this as quiet accumulation into a defined range. Bitcoin was near $85,766 at the latest print. Fund inflows keep arriving while price stays flat.
Support around $82,000 carries real weight. It holds moving-average, Fibonacci, and historical confluence. Buyers keep defending it, and the inflows add genuine bids beneath price.
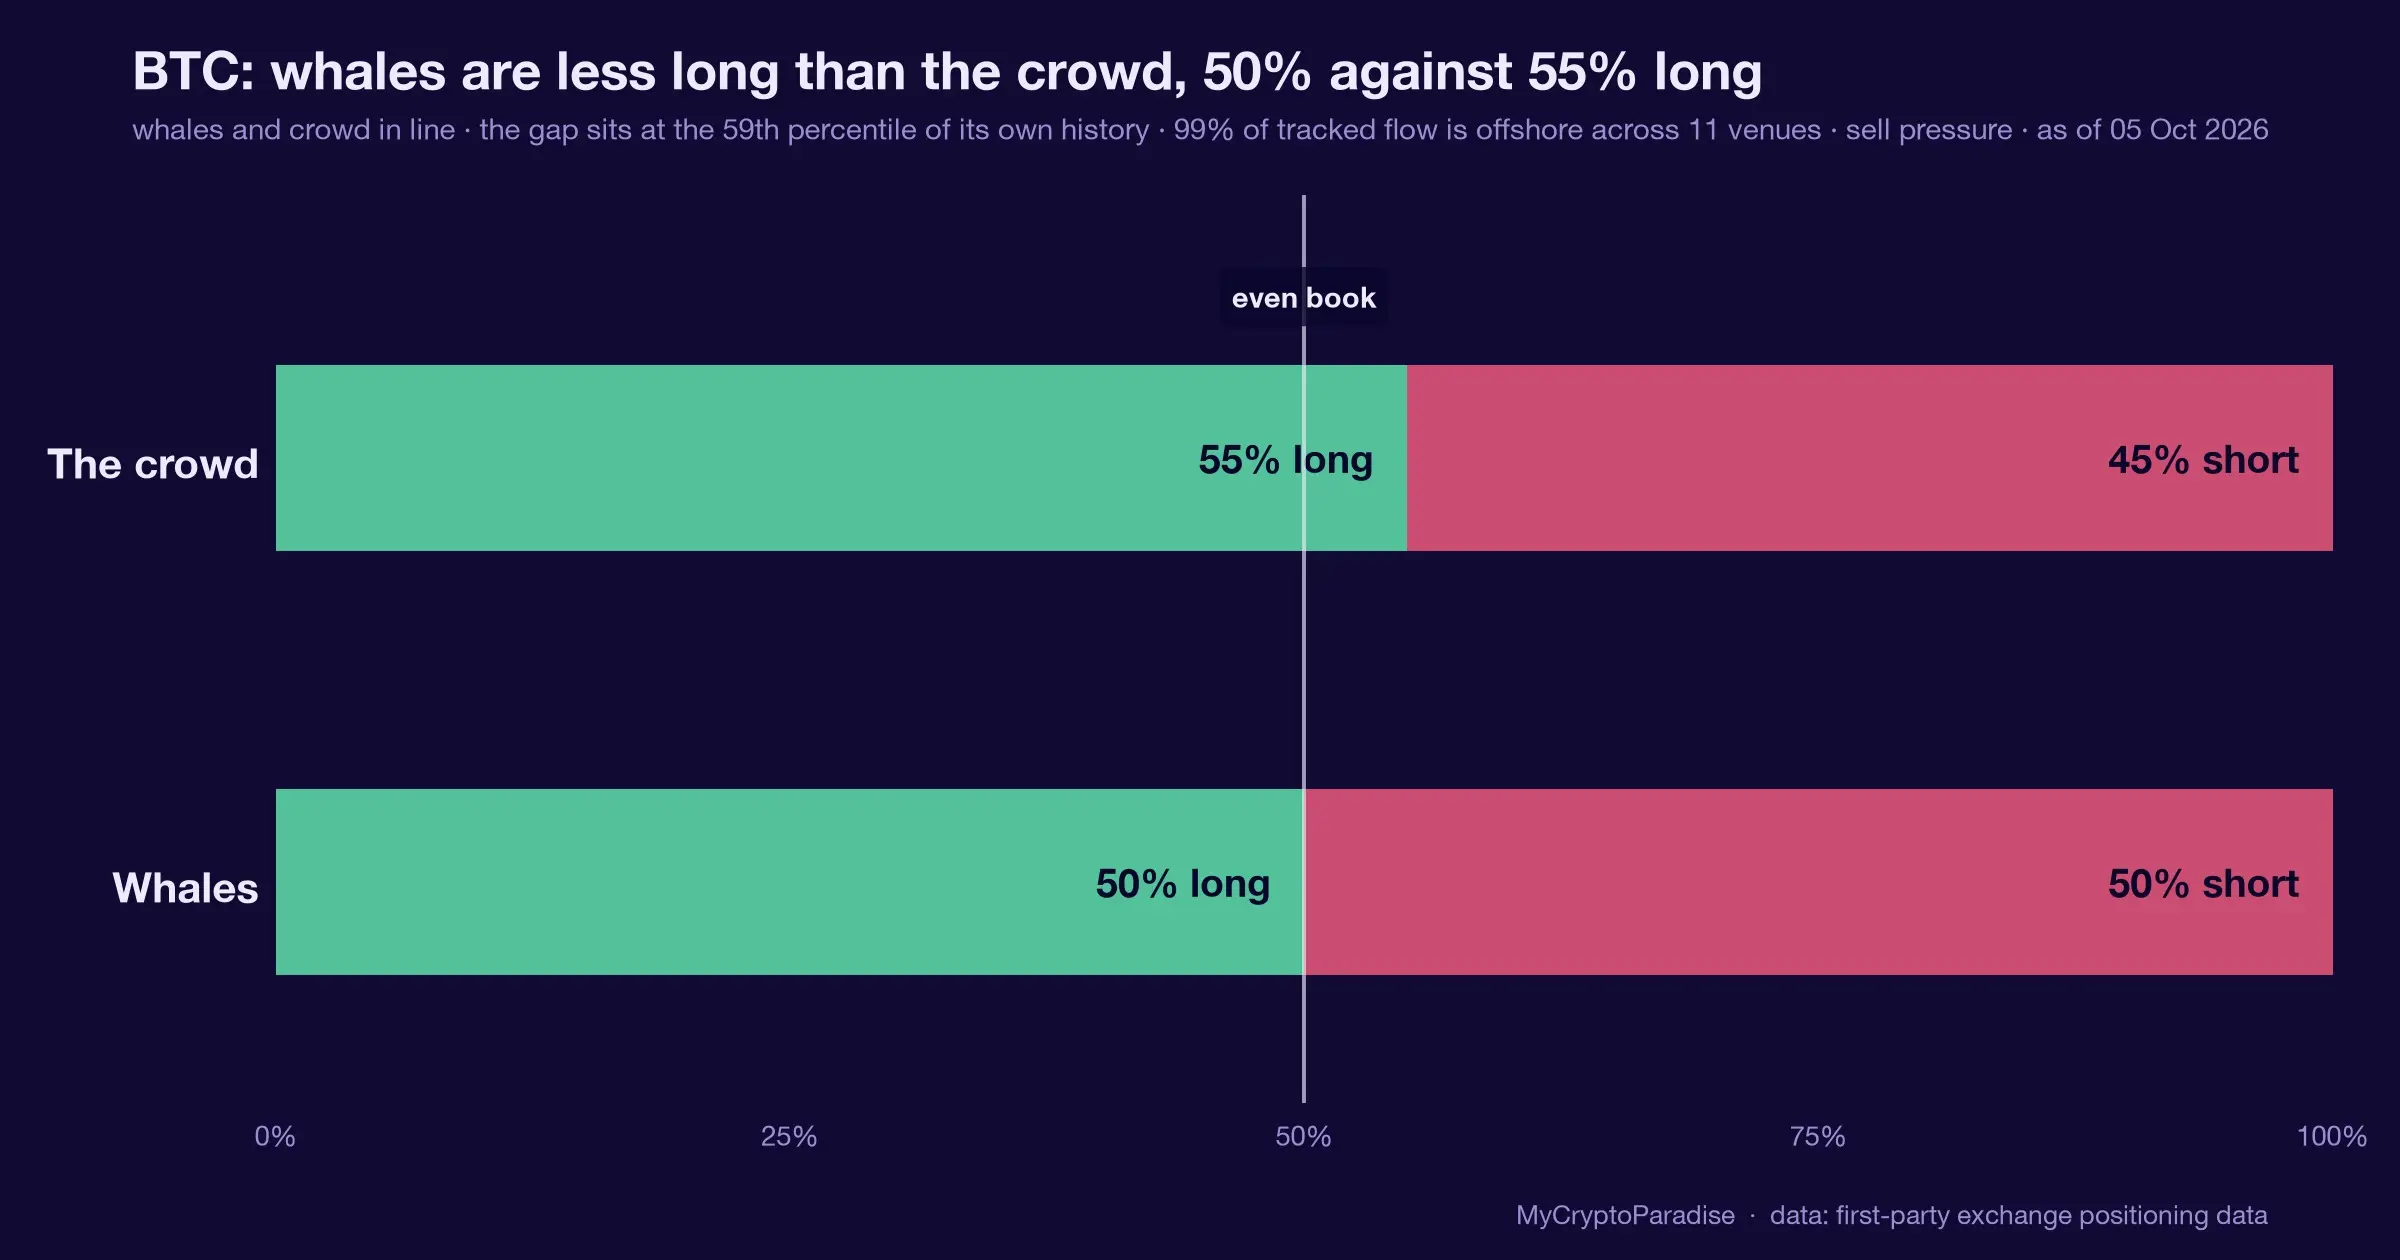
The caution is above. Resistance at $88,000 to $90,000 is where strength has met selling. Whales have leaned net sellers into that zone. Strength there can become distribution, not a breakout.
So the ParadiseTeam holds a split view. Short term, a bounce from support looks reasonable while retail stays fearful. Fear plus absorption often precedes a squeeze higher.
Longer term, the macro picture stays cautious. A rejection at $88,000 to $90,000 could trigger a deeper flush. The lens maps that risk toward $55,000 to $44,000 if support fails.
Stops matter in this range. Many longs sit below $82,000. A sweep there would hunt them before any real move. The inflow data favors the upside, but position for both paths and respect the range. Probabilities, not certainty, guide the read.
The read behind this: we framed this story through our own market analysis, Can Bitcoin Bounce From Support?
Track it live: our Crypto Fear and Greed Index and the live crypto funding rates both update in real time, so you can watch this shift for yourself.
Related coverage
For exact entries, targets, and stop losses with full risk management, that is what ParadiseFamilyVIP is for. New to reading these moves? Start with our crypto trading strategies guide.
ParadiseTeam is monitoring the market situation closely, and we are taking these developments into consideration while building our trading tactics inside ParadiseFamilyVIP.
Crypto trading involves substantial risk. Prices are volatile and you can lose money. This article is educational and is not financial advice. Past performance does not guarantee future results.
Does Bitcoin break $87,400 before it loses $82,000 support?
Follow this topic: Bitcoin ETF news











Join the discussion
No comments yet. Members, share how you are reading this.