

In short: A $51M Bitcoin whale short prompts Simon and the ParadiseTeam to stay bearish on both the daily and weekly time frames. Simon reads this rally as a likely fake-out inside an ending diagonal, still expecting a move toward the $44,000 zone. He wants a clean reclaim of $82,000 to $84,000 before turning bullish.
What did the $51M whale short signal about Simon’s Bitcoin bias?
Track it live: our live crypto funding rates updates in real time, so you can watch this shift for yourself.
The mysterious $51M short arrived while Simon and the ParadiseTeam stayed bearish on both the daily and weekly time frames. Simon had been bullish for months from $61,000, targeting $79,000. Once that level hit, he flipped bearish and has not changed his view.
Simon still reads the weekly chart as a macro bear trend. Price touched weekly resistance near $82,000 and printed a shooting star candle, a sign bears are defending aggressively. The upper boundary of that zone sits at $88,000. You can follow more of this bias on the Bitcoin analysis hub.
Why does Simon think this is not the start of a bull market?
Simon sees a very low probability that this is the beginning of a bull market. He points to Google Trends demand, wave structure, and a missing capitulation. Each signal tells him the bear-market work is not finished yet.
In early June, Bitcoin fell around 30% and search demand spiked hard. In mid-August, Bitcoin pumped around 30%, yet demand made a lower high. Bigger interest on crashes than on pumps is classic bear-market behavior.
Simon also notes the smart money has not absorbed a real capitulation. He references poorly managed institutional risk and the net profit-and-loss pattern seen since 2011. Retail trading volume is near a five-year low.
What level does Simon need to reclaim before turning bullish?
Before switching to bullish tactics, Simon wants a proper reclaim of the $82,000 to $84,000 zone on the daily time frame. A clean reclaim there would invalidate the ending diagonal structure. Until then, he treats the current breakout as a probable fake-out.
A breakout alone is not enough. Simon wants a retest of the level on declining volume, which would show bulls defending it. That base would let him set a tight stop-loss and target weaker resistances above. For his rules on levels and capital, see this position sizing guide.
What are funding rates and volume telling the ParadiseTeam?
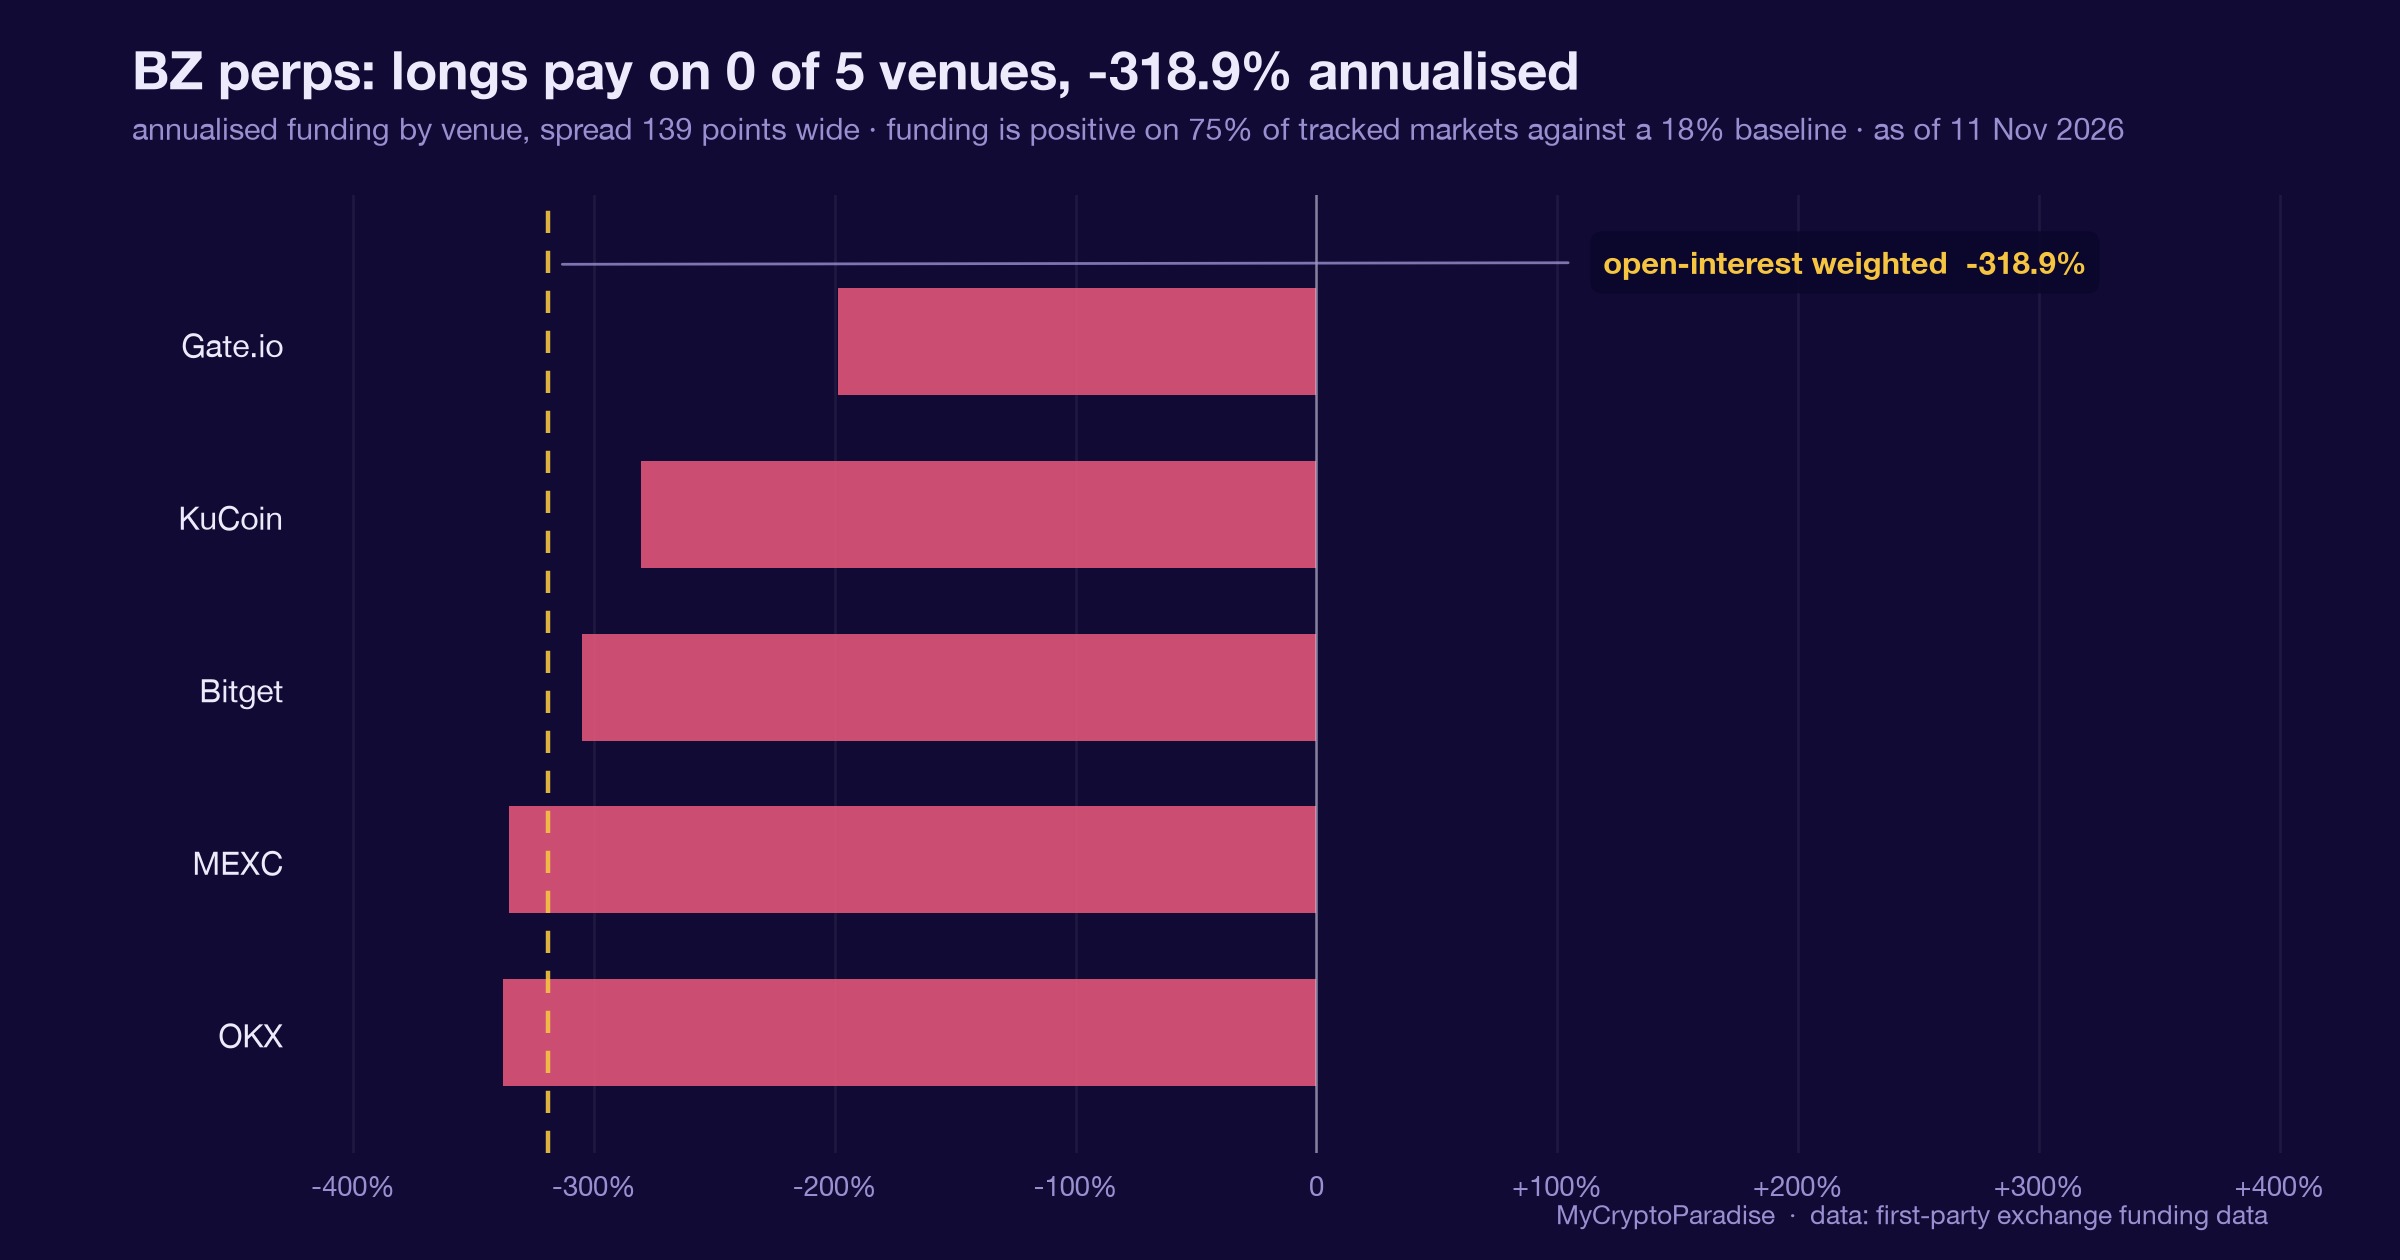
The funding board shows Bitcoin near neutral, with roughly 0% squeeze probability in either direction. Ethereum still carries long-squeeze risk. Altcoins hold the crowded long positions as money rotates out of Bitcoin.
Simon also watched real spot volume closely. On the reclaim candle, cumulative volume delta showed aggressive dumping, not shorting. That is real money offloading bags, which lowers the odds of a genuine reclaim toward new highs.
How is Simon trading this market right now?
The ParadiseTeam is playing defense. They closed a sky swing position at all targets for 37% profit using 1x leverage, then stepped back to the sidelines. Simon is waiting for confirmation rather than chasing this late altcoin rally.
He compares it to poker where sharks eat sharks, so protecting capital comes first. Simon wants a first five-wave impulse to the downside as his confirmation. Then he plans to watch the next corrective move as a shorting opportunity for a larger third wave down.
Frequently asked questions
What is the $51M Bitcoin whale short?
It is a large short position worth $51 million opened by a mysterious trader against Bitcoin. Simon uses it as a talking point, not a signal to blindly follow. His own bearish daily and weekly bias comes from wave structure, volume, demand data, and the missing capitulation.
Where does Simon think Bitcoin is headed?
Simon still expects a move toward the $44,000 zone, the level he has called since around $121,000. He believes an ending diagonal could push price below the previous low near $58,000. Longer term, he sees $169,000 as the next all-time high around the middle of 2027.
What would make Simon turn bullish on Bitcoin?
Simon wants a proper reclaim of the $82,000 to $84,000 zone on the daily time frame, confirmed by a retest on declining volume. That would invalidate the ending diagonal and let him play bullish tactics. Without confirmation, he treats the current breakout as a likely fake-out.
What are funding rates showing right now?
On the funding board, Bitcoin sits near neutral with roughly 0% squeeze probability either direction. Ethereum still carries long-squeeze risk. Altcoins hold the crowded long positions as money rotates out of Bitcoin. Simon reads this rotation as a reason to stay cautious on late altcoin trades.
How is the ParadiseTeam trading this market?
The ParadiseTeam is defensive and mostly on the sidelines. They closed a sky swing position at all targets for 37% profit with 1x leverage, then stopped chasing altcoins. Simon is waiting for a first five-wave impulse down before hunting a short in the next corrective move.
MyCryptoParadise has run a professional crypto signals and trading-education service since 2016, led by founder Simon Mach and the ParadiseTeam. Simon records these sessions three times a week, and every episode lands on the Bitcoin video analysis hub.
Video transcript
Auto-captioned from the video audio and lightly cleaned, so it can contain transcription errors; the video itself is the record. It is speech, not a written article; for the structured breakdown read the sections above.
There is a mysterious Bitcoin whale that has just opened a Bitcoin short position worth $51 million. What does this whale know and where the price of Bitcoin is headed next? Let's analyze the probabilities. Hello ladies and gentlemen, this is Simon from MyCryptoParadise. Welcome back, it's great to be here.
Today is a Saturday and that means that you're watching the last video of this week. so previously we talked about that Bitcoin is bullish at $61,000 we expected a pump towards $79,000 we were bullish for months on the daily time frame after we have hit $79,000 I have hit bearish and I can tell you that I am still bearish on the daily time frame and also I do believe that on the
weekly time frame we are still in a macro bear trend a lot of people think that in a bull market that this pump is the beginning of the bull market. If we take a look at the Google Trends, let me show you Google Trends, we can actually analyze what's happening with the demand for Bitcoin during pumps and dumps.
We can assume if we are in a bear market or a bull market. So let's take a look right here at what happened like beginning of June. and we see that in the beginning of June, we have seen this beautiful uptick in Bitcoin searches on Google, okay?
What happened during this time, during the beginning of June? Well, what happened was that we have crashed by around 30%, right? If you have been around, you know that we have been calling for this crash. We have dropped by around 30%, ladies and gentlemen.
And that was the beginning of June. and what happened? A lot of demand increased for Bitcoin, right? Let's take a look right now at this uptick in Bitcoin searches. As you can see, it's clearly lower high. So this uptick in Bitcoin searches was much smaller than the one during Bitcoin crash.
All right. So what happened in the middle of August, I would say? Well, we have pumped, right? So We have pumped, how much did we pumped? Again, by around 30%. So Dump 30% created much bigger demand for Bitcoin than the same length of pump.
So as you can see, this is clearly a situation that is happening in bear markets. So in bear markets, people are much more interested in cheaper prices, okay? In bull markets, people are driven by fear of missing out. So they are much more interested in when Bitcoin is creating higher prices.
So this is also one of the way how we can determine, it's just another indicator, how we can determine if you're in a bull market or in a bear market. And right now, we can see that much more interest is happening when Bitcoin is actually crashing, okay?
So this is just another indication that with the highest probability, this is not a beginning of a bull trend just yet, okay? From the technical perspective, I don't believe that we have completed the final fifth wave also. So from technical perspective, I'm also not really convinced that this is the beginning of a bull market.
As you know, from around 121,000 dollars we have started to call for the price 44,000 dollars to be a bottom of our bear market and then we can start pushing towards the new all-time high as we have analyzed a year ago 169,000 dollars I believe is going to be the new all-time high for the next bull market that I believe will begin in the mid of 2027 but until then there's still
a very high probability in the formation of an ending diagonal and that we will crash below the previous low, ladies and gentlemen, that was created at $58,000 and we will need to touch that $44,000. At least the zone, the exchange of the hands zone, you know, that the smart money are waiting for this time, the smart money have not been accumulating and absorbing the selling pressure from the capitulation of the bad
risk managers from the institutions like MicroStrategy that really did not manage their risk well because the capitulation has not happened yet, okay? So there is nothing to be absorbed. So I've been sharing with you the graph, right? What's happening with the Net Analyze Profit and Loss since 2011.
Ladies and gentlemen, since 2011 we always have this kind of capitulation, the smart money absorbs that, the price action slows down and then we can start the new bull trend every single time. In every major bear market this has happened and still right now it's not yet happened and people are calling for a bull market.
Bull market might have started but there is a very little probability at this moment for that. I don't have and so I have these kind of intuitions what what might happen next but I take it just as another indicator all right so I'm not just relying on my instincts and basically almost nothing other than that we have hit like important level it was the previous support of that previous higher degree fourth
wave other than that like from my perspective my analysis we have not done anything necessary for the bear market to be finished, okay? I might be wrong, right? And if I'm gonna be wrong, I first want to seek some confirmations. So for example, at least properly reclaiming this resistance on my weekly time frame that is having upper boundary at $88,000 lower boundary.
We have already touched at around $82,000 and as you can see right after touching it, we have created a huge shooting star candlestick pattern that is usually visible at the top of some uptrends as you already know it's showing us that the bear are extremely defensive of this resistance level and that they are not playing any games with bulls they are very aggressive as you can see so that's the weekly time
frame i'm still bearish on the weekly time frame on the daily time frame you know that we are creating this kind of expanded flat pattern, right? ABC, the sea wave might have already finished, you know that we expected that the fifth wave might be truncated but because we were also watching the momentum indicators and we were waiting for something very important to happen after this barrage cross and that is the retest
of the red line, all right? So for a proper reclaim of a resistance or reclaim from the downside of a support, I'm not satisfied enough with just a breakout, what we have got for example on the weekly timeframe, a breakout about the moving average trend line on the weekly timeframe.
I'm also interested in retesting it properly and showing me that the bulls can defend such important level as the moving average trend line on the weekly timeframe. Likewise, right here I have been saying to you, Most likely, this is a fakeout until I get enough confirmation.
Volume was extremely weak, right? Plus, we have not reclaimed the proper level. And voila, what happened afterwards? Of course, we have crashed. This was a fakeout. In my opinion, there is a very high probability of this breakout being a fakeout as well. Even though we have got quite nice volume above the moving average volume trend line, I still need to see a proper reclaim, okay?
Because as a professional trader, I want to minimize this kind of fake-out moments, right? Like, first of all, I know at this moment I don't have a very great risk reward on my trade, right? Second of all, I don't have enough probabilities because there are no confirmations.
Technical perspective is also telling me we have not not created the kind of things that we need to create for macro bottoms creations, etc. So I would much rather really miss a trade or two than risking my capital and the capital of our clients unnecessarily.
That is why as a professional trader confirmations are extremely important because it doesn't diminish the fakeouts, sometimes you're gonna get caught in a fakeout, right? It doesn't completely get rid of it, but it decreases the probabilities of you getting caught in a fakeout, right?
So that is why I would much rather wait for a proper confirmation of reclaiming this resistance level on the weekly timeframe. That would tell me, okay, the bulls are already defending this level, they are re-accumulating here rather than here. And if I will get enough confirmations that the big boys and the smart money are already getting back to the market.
Well, I'm going to be playing with them, right? I'm not going to fight them. I'm going to be playing with them. So however, right now, I don't have any confirmations of that. We knew that this was basically created by a squeeze, right? We have been talking about it.
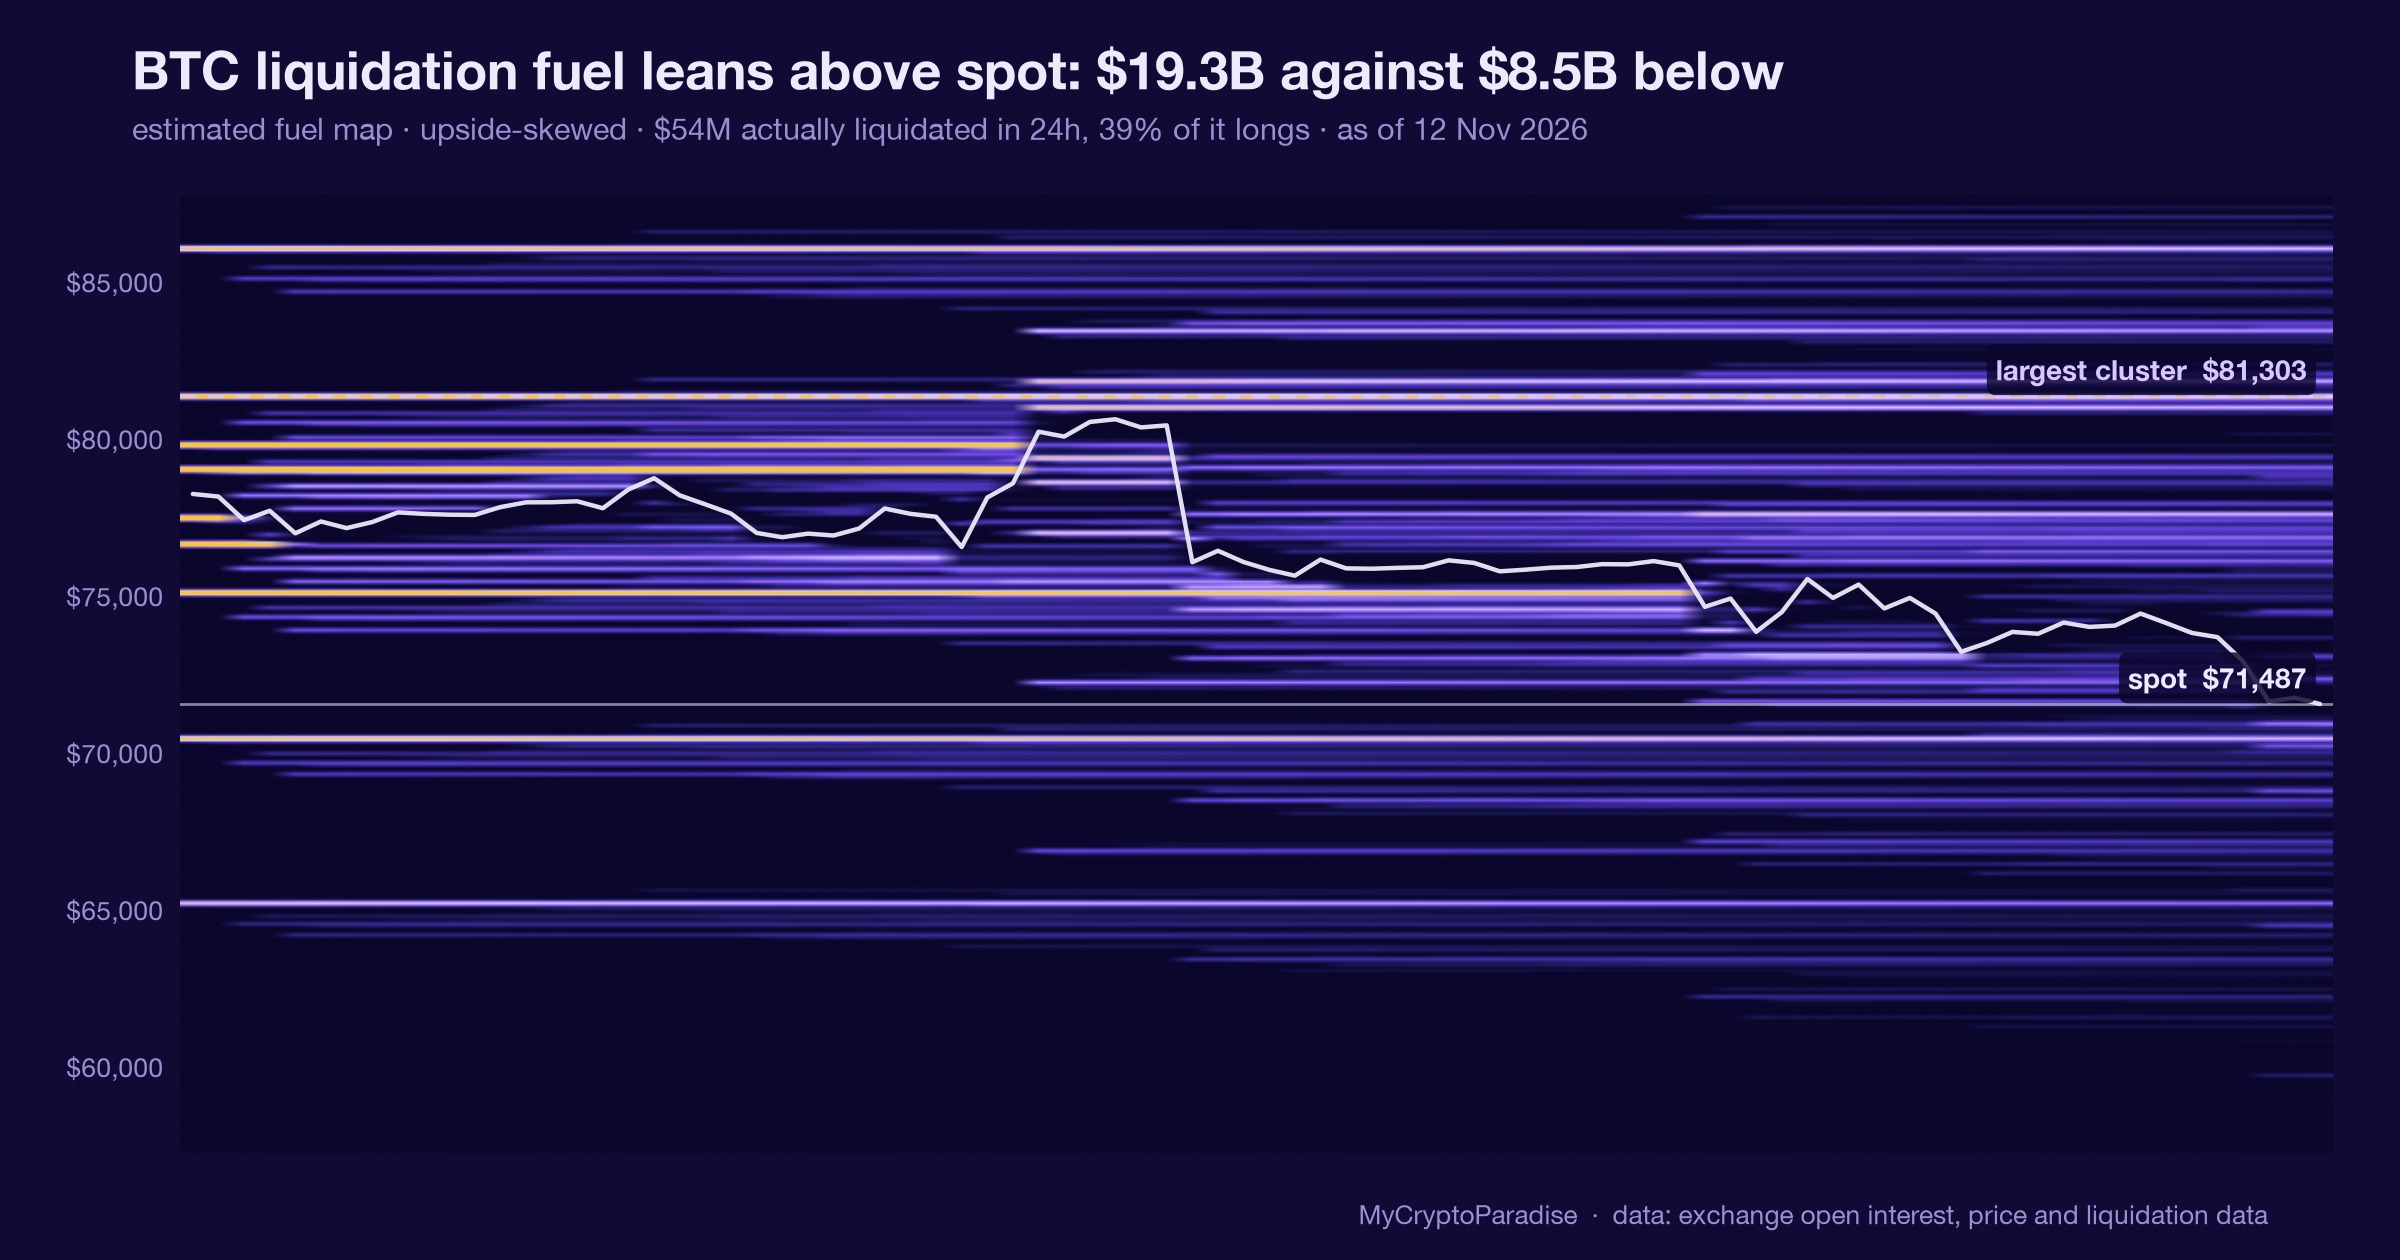
We have seen what was happening with the open interest. So this was a huge short squeeze happening. And we have been watching also what was happening during funding debt with the cumulative volume delta, right? So the long positions have been offloading, the cumulative volume delta on the spot has been absorbing all of that and that's how this move happened, alright?
So ladies and gentlemen, I'm still bearish on the weaker time frame and I'm bearish on the daily time frame as well. So at this moment what we can see on the MACD is that the blue line crossed below the red redline and right now we have created this kind of reclaim that we were waiting for, right?
So the fifth wave could have been truncated but given that we have touched the important next resistance level that we have charted already previously right here, right? And that 82,000 there is and we had it already right here marked. This is extremely important resistance zone because if on the daily timeframe we will start but reclaiming that 82-84 thousand dollars, it's gonna invalidate this very structure that we are at right now, that's
the ending diagonal structure, and I'm gonna start playing with bullish trading tactics, right, but until we can properly reclaim this level, why would I be playing with bullish trading tactics, right? If we're gonna reclaim it, not only it will be very high probability of continuation higher, right, because we will, the path of and the least resistance will be on the upside, but also I will be able to create a beautiful trade
with very tight stop-loss, because we will reclaim a very important zone right here, so it will be a strong base where I will be able to place my stop-loss, right, and my exit targets will be able to be placed much higher, because I will understand that the next resistances above us are going to be much more weaker.
So at this moment, however, we are not yet there. So what we can see is a reclaim on the MACD histogram. This is a bearish cross. This is a first sign of being very, very careful, all right? Because something similar, what happened back in April might again start.
As you can see, back in April after this bearish cross, we have started to crash by that 30%, okay? We don't have any bearish divergence just yet on the histogram, but this is already a big warning sign I will tell you in a minute from a lower time frame what kind of confirmations I'm waiting for but at this moment let's also take a look at the RSI, the same thing happened bearish
cross, retest, looking to the downside on this candle with the RSI line right now the more than average RSI trend line is going to be acting as a resistance. So we have double confirmation right here, okay. Stochastic RSI is heaven on the opposite side, a bullish cross, however at this moment we are not in the zone, we are not looking to the upside and you understand that sometimes it can happen but
if you don't have a confluence with other indicators what's usually happening is just very slow sideways price action. We will get the Stochastic RSI into an overbought mode again and then we will be able to start going down, right? So one indicator will really tell you nothing.
You need to contextualize all of your indicators into the market price action with other indicators, what's going on behind the scenes, what are doing the smart money versus the retail and then give each indicator some kind of a value. Right now, Stochastic RSI telling me like the bulls might be for a while defending some important level.
For example, right now we might be defending the $79,000 but the other indicators are telling me like bears are getting ready, okay? Bears are getting ready. We can see that the momentum is already decreasing right here. We just need to start getting the bears in and it will take a while in my opinion because right now what we can see is that actually the Bitcoin dominance is decreasing.
So the money are flowing from Bitcoin into what? Well, it might be out of the market completely but if we take a look at the other's dominance, all right, we can see that it's actually flowing into altcoins. So I would however be still confirmation on the Bitcoin into some nice swing plus short position, that's my kind of style.
I want to wait for confirmation that the bulls, that the bears are really can control the price action on the today opposite side. So how am I going to assume that? Well, first of all, I need to understand what kind of development of the price action is happening right now.
So we know that the sea wave is a motive wave structure, that means that it subdivides itself into 5 small waves and so far we have created 1, 2, 3, 4th one with the highest probability finished right here in the end almost touching the moving a very strong line that I was looking for but it seems like the $76,000 was enough and we've actually created this double 3 formation, the WXY, alright?
As you know from the from the elote wave perspective, this is a corrective wave structure, WXY, this is the bullish one, this is the bearish one, WXY, all of them are corrective mount wave structures and that means that there is a high probability that right now we are completing the fifth wave, that we were thinking might be a truncated one, because really the $79,000 was extremely The important level that we were
waiting for months to be hit and as you can see for many days we have been defending that quite well to fake house right here that again exactly that 79,000 dollars working absolutely perfectly but with this push we are right now changing it into a support okay but I don't feel of this as very conference reclaim because take take a look at the volume.
What needs to happen with volume on a successful reclaim? And we don't want to watch volume on a futures exchange, we want to watch it on a spot exchange. So let me put right here, because that's the real volume that really matters. It's not the borrowed money, right?
It's the real money. So it's the smart money that is going to tell us the truth. So we take a look on Binance as that exchange is having most of the volume and on the spot. So take a look at this, break out above that important 79,000 dollars, take a look at the volume.
Nice volume, I'm not saying anything, it's not a bad volume, above the moving average volume trend line, but then what we need to have for a proper reclaim is the retest of that important level on decline in volume. Alright, on a decline in volume.
But take a look at this, this candle was actually pretty damn powerful. Okay? And on the cumulative volume delta, we can actually see that it wasn't shorting, it wasn't aggressive shorting, it was actually aggressive dumping bags on spot, that's real money, okay? Which is decreasing the probability that this is a real reclaim and that we can continue to create a new alt-time high and start pumping towards $169,000.
It's decreasing the probability, ladies and gentlemen, decrease in the probability, because you need to understand that at the bottom, the smart money are always being positioned in themselves. So that's why volume is extremely important to watch and what's going on behind the scenes is extremely important to watch.
As we were watching it together back in 2023 and we have been calling for the upcoming bull market on this secondary lower-degree time frame, and that was our confirmation at $19,550 As you remember, if you have been in our free Telegram channels, you remember that, right?
So let's take a look right now at the volume again and what's happening versus the open interest and cumulative volume delta because it's interesting. So spot volume has been selling aggressively on this candle, any positions went in, no positions has been closing, right?
So no borrowed money on this dump. that tells us that some big players actually dump in their bags, okay? So positions started to get closed. But where the positions went? Well, it went into the altcoins. So if we take a look on the funding rates, okay, we can see that the funding rates on Bitcoin are getting kinda neutral.
At this moment we actually have zero percent probability of any squeeze upside or downside. The funding rates are getting neutral on Bitcoin and also kinda on Ethereum, but Ethereum still has a high probability of a long squeeze to be honest. If you can see 30% probability on the weaker time frame.
On the forward time frame it's lower, it's only 12% probability, but who is having the high positive funding rates? Altcoins. You can see altcoins are really a lot of positions, long star being crowded on the altcoins, that positions from Bitcoin went into altcoins, it didn't disappear, so long star being crowded but on the altcoin side and as we already know how the money is flowing from the market and into the market,
as you can see money flow right here, it goes from total to Bitcoin, then from Bitcoin to altcoins and then from altcoins out of the market and that's visible on the total crypto market cup, right? So it's this kind of circle. So I would be, first of all, I would be careful about getting caught in this kind of altcoins, as you have seen, we are no longer really interested with ParadiseFamilyVIP into
some aggressive positions in altcoins. It was a very small ride and as a professional trader, you should really take what the market gives you and then again defend yourself. And given even that we understand that the retail right now, the trading volume from retail and overall trading volume in the crypto market is at all time low.
Okay, I've shared with you the Google Trends, right? It's at all time low. Let's take a look at past five years. Take a look at that. We are almost at all time lows, very, no interest at all from retail almost. Okay. So what does it mean?
It means that, let's imagine that you go to the casino and you you play poker and at the poker table they are no longer the kind of drunk tourists that are very easy to play out in poker. Right now you are playing the poker against high skilled poker players as well.
All of those poker players are defending their chips extremely well, they are playing only strong hands, they are being very protective of their stakes, they are are being very careful when they risk a lot. And that is why you need to really adjust to it, right?
So you need to get in and then immediately start protecting your capital again. That's the condition of this current market. And if you understand the condition of the market, you can really play the poker professionally against other professional players, right? Of course, market is cyclical and I do believe that a lot of drunk tourists will come to do the poker table again and it will be much more fun and much more
easier to make a lot of money because we will be able to really strip down the drunk tourists. But right now you need to be very protective, you need to be much smarter than the other professional poker players. Right now sharks are trying to eat sharks, so that is why you need to play smarter, so you need to be more defensive, ladies and gentlemen, and a lot of poker players, these professional
poker players, they might be very good at the game, but if they are not better than you, they're gonna go get out of the table, they're gonna lose everything. So right now, it's very easy to get trapped, okay? And get eaten, even though you are very good, get eaten by the other sharks.
That's why you need to be much smarter and you need to be much more productive. that is why we are okay with this small rally on altcoins and now we are again being protective and we are observing, we are observing sidelines, yeah? Observing if we will get that confirmations of reclaiming this important resistance, perfect!
But right now we can see that there are hints that the retail is not really interested in the higher prices, they are much more interested in the crashes, right? And henceforth, right now, during this push to the upside, sharks are playing. So they are maybe doing some smart traps, right?
So I would be very careful. I would be very careful with altcoins trying to catch this kind of late rally, okay? And yeah, and with Bitcoin as well. So this was the double three, ladies and gentlemen, and right now we might be creating the final fifth 5th wave, which again because we have created the 80, we have already touched the next important level 82,000 dollars, there is much higher probability that the
final 5th wave will be truncated, that means it will not go above the previous high, okay? So that's just right now the highest probability, because we have created 1, 2, 3, right now 4th and now we will be creating 5th wave. Once the 5th wave will be finished, you know that it subdivides itself into 5 small waves, with that probability this is going to be an ending diagonal because of the context.
I will be watching for the confirmation that I promised you to tell you about. So, I will be watching for the confirmation that the bears can control the price action and I want to see first impulse in the opposite direction, right? So, the impulse will be five waves to the downside.
If I'm going to get that, I'm going to be watching the next corrective mode wave as a hawk and I will be treating that as a shortened opportunity in expectation of catching the next higher degree third wave. Ladies and gentlemen, I will keep keep you updated about that until then trade safe, trade with a professional trading strategy I hope these videos are helping you okay and I will catch you in the
next one, Cheers!
Educational content, not financial advice. Crypto trading carries substantial risk; you can lose your capital. Past performance does not guarantee future results.









Join the discussion
No comments yet. Members, share how you are reading this.