

In short
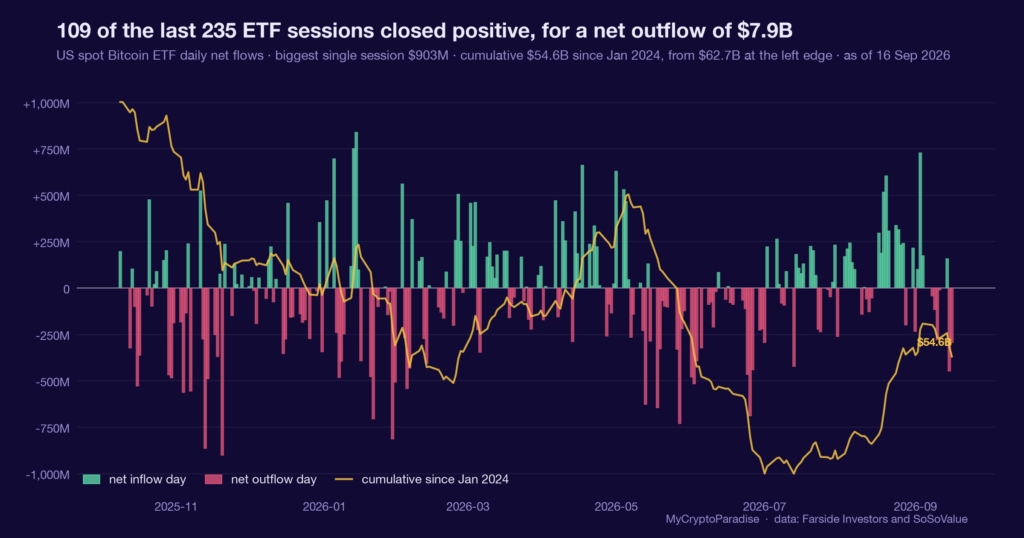
A Bitcoin ETF net flow is the day’s creations minus redemptions across the US spot funds, and our ETF-tide grade turns that stream into a 0-to-100 read of demand pressure. On 16 September 2026, the funds bled $296 million, BlackRock’s IBIT leading the exit at $144.1 million, the second straight outflow day and a five-day net of minus $882 million. The tide grade slipped to 47 from 50, a three-point move that keeps it near neutral. We called it neutral with a defensive lean, explicitly not a reversal, because our own up-rate sits at 51 percent across 22 effective windows: a coin flip, not an edge. Flows and price moved together, down 1.3 percent, so there is no divergence to trade. This piece shows you how to read ETF flows yourself, grade and all.
Key facts
- Latest session net flow
- -$296.0M
- Net flow over the last five sessions
- -$882.2M
- Cumulative net flow since January 2024
- $54.63B
- What would prove this read wrong
- Two consecutive net inflow days that push the five-day net positive and lift the ETF-tide grade back above 50, replacing the mild outflow tilt with fresh demand.
- Reading taken
- 16 September 2026
- Source
- Our MCP Insights tools, from Farside Investors and SoSoValue. Upstream data published by Farside Investors
A net flow measures conviction, not price
A spot Bitcoin exchange-traded fund (ETF) holds coins for its shareholders, so every dollar in or out forces the fund to buy or sell real Bitcoin. Net flow is the daily balance of those purchases against redemptions.
That makes it a cleaner read of allocator conviction than a single price candle, which any leveraged trader can push around for a few hours. Flow is slower, and slower is harder to fake.
A gauge built from settled money tells you who is committing capital, not who is loudest on the tape.
The exit on 16 September was broad but shallow
On 16 September 2026, the US spot funds shed $296 million on net, per our MCP Insights ETF flow data. BlackRock’s IBIT led the exit at $144.1 million, with Fidelity’s FBTC down $52.7 million and ARK’s ARKB down $84.4 million.
It was the second straight outflow day, dragging the five-day net to minus $882 million. Our ETF-tide grade, which scores demand pressure from 0 to 100, slipped to 47 from 50, a three-point drop inside a 17-point error band.
A three-point slip on a gauge with a seventeen-point band is a drift, not a verdict. The honest word for it is barely.
What is different here
The ParadiseTeam grades every ETF flow against its own tide model, complete with an up-rate and an error band, instead of headlining a single red day. That discipline is why a $296 million outflow reads here as a coin flip, not a top, and why the number arrives with its own margin of doubt attached.
Do not read a BlackRock exit as a top
The obvious misread is that BlackRock selling $144.1 million marks distribution by the largest holder. It does not. Over the trailing 30 days, IBIT still took in $3.07 billion on net, and its cumulative haul since launch stands near $63.8 billion.
One red day inside a month of net creations is noise around a still-positive trend. The flow that matters is the multi-day balance, and even that has only tipped mildly negative.
This is one input. It sits alongside funding, open interest (OI) and spot absorption, and today it agrees with them rather than fighting them. A single fund’s worst day is a data point, not a thesis.
The tide has drifted, not turned
Since the ETF-tide series began on 9 April 2024, days at this grade have resolved higher about 51 percent of the time across 22 effective windows. That is a coin flip, and we refuse to dress it as more.
Twenty-two effective windows is a thin sample. A number with no error bar is decoration, so ours carries a 17-point band, and inside that band a move from 50 to 47 changes almost nothing.
A gauge that admits it has no edge here is more useful than one that manufactures a call from a three-point wobble.
The defensive lean is small and cheap
With flows and price falling together, down 1.3 percent over five days, there is no divergence to exploit and no forced-seller cascade to fade. The tape and the flow agree, which is the least tradable of all configurations.
So the defensive lean is small and it is cheap: trim size, wait for the flow to pick a side, and let the invalidation do the work rather than a forecast. The imbalance here is mild, and mild deserves one line of risk, not a position.
The highest-probability move for most is no trade, held until two clean inflow days say the buyers came back.
Reading ETF flows yourself, step by step
- Open the Bitcoin ETF flow tracker and read the latest net total, then note whether it is the first or a repeat outflow day.
- Check the five-day net, not one session: a single red day inside a positive week is noise, a negative five-day balance is a trend.
- Split the total by fund, because one issuer’s redemption can mask net buying everywhere else, or the reverse.
- Read the tide grade beside its error band, and treat any move smaller than the band as drift rather than a change of regime.
- Compare flow direction with price direction: agreement means low information, while divergence is the only configuration worth a second look.
Most readers skip the error band and react to the grade’s exact number. A three-point move inside a seventeen-point band is the step where false conviction is manufactured.
Every number above is checkable against the live data. Start with the Bitcoin ETF flow tracker, then cross-read the MCP Insights hub and the Crypto Fear and Greed Index.
Act and invalidate
| Scenario | What confirms it | What kills it |
|---|---|---|
| Outflows fade | One clean net inflow day | A third straight outflow day |
| Redemptions broaden | Outflows spread beyond IBIT and ARKB | Tide grade climbs back above 50 |
| Chop continues | Flows and price keep moving together | A flow-versus-price divergence opens |
Posture: Defensive and patient while the five-day net stays negative. The lean is small: one line of risk, not a position, until two inflow days or a grade back above 50 flips it.
Frequently asked questions
Does a BlackRock outflow mean the top is in?
No. On 16 September, IBIT redeemed $144.1 million, yet its trailing 30-day net was still a positive $3.07 billion. One red session inside a month of creations is noise around a trend, not a change in the trend itself.
What is the ETF-tide grade?
It is our 0-to-100 read of net demand pressure across the US spot Bitcoin funds, carrying an up-rate and an error band. On 16 September it sat at 47, down three points from 50, which keeps it near neutral rather than bearish.
Why not claim a historical outflow frequency?
Because base rates for ETF flow regimes are not wired into our data yet. Our own tide up-rate covers 22 effective windows since April 2024, and that is a thin sample. We quote it, and we call it a coin flip.
Is there a trade in this outflow?
For most readers, no. Flows and price fell together, down 1.3 percent over five days, so there is no divergence to fade and no forced-seller cascade to catch. The patient posture is to wait for the flow to pick a side.
What would change this neutral read?
Two clean net inflow days that push the five-day balance positive and lift the tide grade back above 50 would flip us constructive. A third and fourth straight outflow day that broadens beyond IBIT would harden the defensive lean instead.
Crypto trading involves substantial risk and is not suitable for everyone. Nothing here is financial advice; it is education only. Never risk more than you can afford to lose.
The private Extras feed, where the ETF-tide grade, five-day net flow and per-fund breakdown update daily with their invalidation levels attached, is part of PRO Paradiser, the intelligence layer behind the ParadiseFamilyVIP strategies.














Join the discussion 1
Still waiting on a clearer signal from the charts myself... A 47 grade is just a coin flip, as they say, too much noise for me to commit either way.