

In short
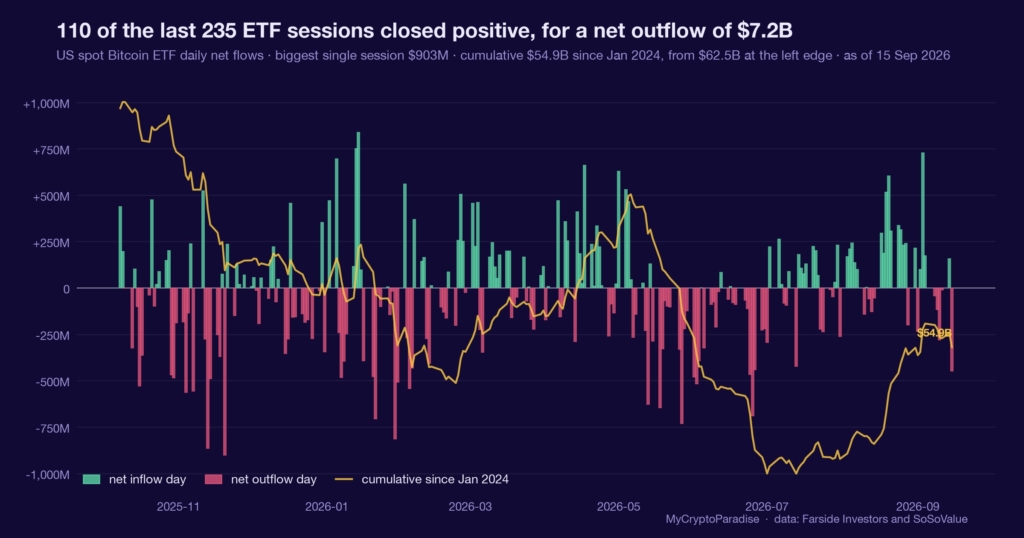
A spot Bitcoin exchange-traded fund (ETF) flow is the daily net of share creations minus redemptions, a clean proxy for how much new money entered or left. The on-chain feed reported synchronized inflows on 14 September: plus $160.04M into BTC funds and plus $121.02M into ETH, lifting total assets above $100.09B. Our MCP Insights ETF flow data tells the fuller story. As of 15 September the latest session prints a $450.3M net outflow, the five-day net sits at minus $706.4M, and our ETF-tide grade holds at exactly 50 out of 100. So we called it neutral, explicitly not a trend restart. Flows and price stayed aligned, with price down 1.21 percent over five sessions, so no divergence edge exists to trade. This piece shows you how to read ETF flows yourself, and why one green day is not a tide.
Key facts
- Latest session net flow
- -$450.3M
- Net flow over the last five sessions
- -$706.4M
- Cumulative net flow since January 2024
- $54.93B
- What would prove this read wrong
- Two consecutive net inflow sessions that push the five-day net positive and lift the ETF-tide grade back above 50, replacing the current coin-flip reading with a committed uptide.
- Reading taken
- 15 September 2026
- Source
- Our MCP Insights tools, from Farside Investors and SoSoValue. Upstream data published by Farside Investors
A flow is money moving, not a mood
A spot fund creates shares when a market maker delivers Bitcoin to it, and redeems them when it takes Bitcoin back. Net flow is the difference across a session: positive means the fund grew, negative means it shrank.
That mechanism matters because a flow number is a settled fact, not a sentiment survey. Nobody guesses at it: the shares either exist or they do not.
So a single day of inflow tells you demand won one auction. It does not tell you the tide turned. A gauge that measures one session should never be read as a trend.
The tide turned the day after the headline
The on-chain feed reported plus $160.04M into BTC funds on 14 September, lifting total net assets above $100.09B, alongside plus $121.02M into ETH funds. We could not independently verify those single-day figures, so we attribute them to the feed.
Our MCP Insights ETF flow data, as of 15 September, reads the fuller picture. The latest session prints a $450.3M net outflow and the five-day net sits at minus $706.4M. The ETF-tide grade holds at 50 out of 100, with an up-rate near 51 percent across 22 effective windows since April 2024.
At the fund level our latest reconciliation splits sharply: BlackRock’s fund pulled plus $134.3M and Fidelity plus $53.3M, while ARK and Bitwise both redeemed. Over 30 days BlackRock’s fund still absorbed roughly plus $3.55B. Concentration, not conviction, is carrying this tape.
One green day is the easiest number to overweight
The obvious misread is to take 14 September as a trend restart: two synchronized inflows, assets over $100B, institutions back in. The very next session undid most of that case.
Read against the five-day net of minus $706.4M, that inflow was one auction inside a week that leaned the other way. Our Bitcoin ETF flow tracker shows the daily prints and the cumulative curve, so the trailing net is easy to check yourself.
A read that quotes only the confirming day is marketing. The disagreeing days are what size the risk.
What is different here
The ParadiseTeam does not report a green flow day and call it demand returning. We re-verify the feed against our own tide, weight the five-day net over the one-day print, and publish the grade even when it lands at 50, because a coin flip that admits itself is the honest read.
A coin-flip tide sizes a bias, it does not set one
With the tide grade at 50, our own data assigns this flow read no edge, and refuses to manufacture one. Base rates for ETF flow regimes are not wired into our data yet, so we claim no historical frequency.
This is one input. It sits alongside funding, open interest and spot absorption, and on its own an ETF flow reading is a probability weight on a bias, never the bias itself.
So the neutral call is not indecision. It is the accurate description of a 50 grade: wait for the tide to commit before paying for a direction. A gauge that admits it has no edge is more useful than one that always finds a signal.
Reading ETF flows yourself, step by step
- Start with the net flow for the session, not the gross creations, so redemptions are already netted against new demand.
- Pull the trailing five-day net; a single green day inside a red week is noise, not a trend change.
- Check the fund-level split: broad inflows differ from one issuer carrying the whole number while others redeem.
- Compare flows against price direction; aligned moves offer no divergence edge, while a split flags smart-money disagreement.
- Read the tide grade last, treating 50 as a coin flip and waiting for it to commit before sizing anything.
Most skip the five-day net and react to the daily headline. One session is an auction result; the trend lives in the trailing window where the tide actually turns.
Every number above is checkable against the live data. Start with the Bitcoin ETF flow tracker, then cross-read the MCP Insights hub and the Crypto Fear and Greed Index.
Act and invalidate
| Scenario | What confirms it | What kills it |
|---|---|---|
| Tide commits higher | Two green days, five-day net positive | Grade slips back under 50 |
| Outflow deepens | Second outflow day, five-day net widens | Fresh inflow above the five-day trend |
| Chop, no edge | Grade pinned near 50, flows track price | Clear flow-price divergence opens |
Posture: Neutral and patient while the tide grade sits at 50 and flows track price. No flow-driven trade earns its risk until the five-day net and the grade agree on a direction.
Frequently asked questions
What is a Bitcoin ETF net flow?
It is the daily net of share creations minus redemptions for spot Bitcoin funds. Positive means the funds grew that session and took in Bitcoin; negative means they shrank. It is a settled figure, not a sentiment estimate, which is why it is worth reading closely.
Did Bitcoin ETFs see inflows on 14 September?
The on-chain feed reported plus $160.04M into BTC funds and plus $121.02M into ETH funds that day. We could not independently verify the single-day figures, so we attribute them to the feed rather than to our own reconciliation.
Why call the read neutral after an inflow day?
Because our MCP Insights ETF flow data, as of 15 September, shows a $450.3M outflow the next session and a five-day net of minus $706.4M. With the tide grade at exactly 50, our own data assigns the flow no directional edge.
What would turn this ETF flow read bullish?
Two consecutive green sessions that push the five-day net positive and lift the tide grade above 50 would do it. Until the grade and the trailing net agree, one inflow day is an auction result, not a change in the tide.
Is a single ETF flow reading enough to trade?
No. One flow reading is a probability weight on a bias, not the bias itself. It sits alongside funding, open interest and spot absorption, and a grade of 50 explicitly tells you it carries no edge on its own today.
Crypto trading involves substantial risk and is not suitable for everyone. Nothing here is financial advice; it is education only. Never risk more than you can afford to lose.
The private Extras feed, where the ETF flow tide, its five-day net and the fund-level split update with invalidation levels attached, is part of PRO Paradiser, the intelligence layer behind the ParadiseFamilyVIP strategies.












Join the discussion 1
So many headlines focused just on that one inflow day.. how often do we see those single-day spikes reverse so quickly into net outflows like this..?