


Chart Patterns Explained
In short
An ascending triangle is a bullish continuation pattern characterized by a flat horizontal resistance line and a rising trendline connecting higher lows. This pattern indicates that buyers are consistently stepping in at higher prices, suggesting potential upward movement. A breakout above the resistance line, particularly with strong trading volume, often signals a likely upward continuation in price.
Crypto traders are always looking for opportunities to enter or exit the crypto markets. In order to make profits, professional crypto traders make use of top trading signals and other essential tools. A reliable option for such signals is the ascending triangle pattern. This article will discuss the ascending triangle candlestick pattern. We will also discuss how traders can make significant profits by generating top crypto signals from this pattern.
How to Trade Crypto Signals: What is an Ascending Triangle Pattern?
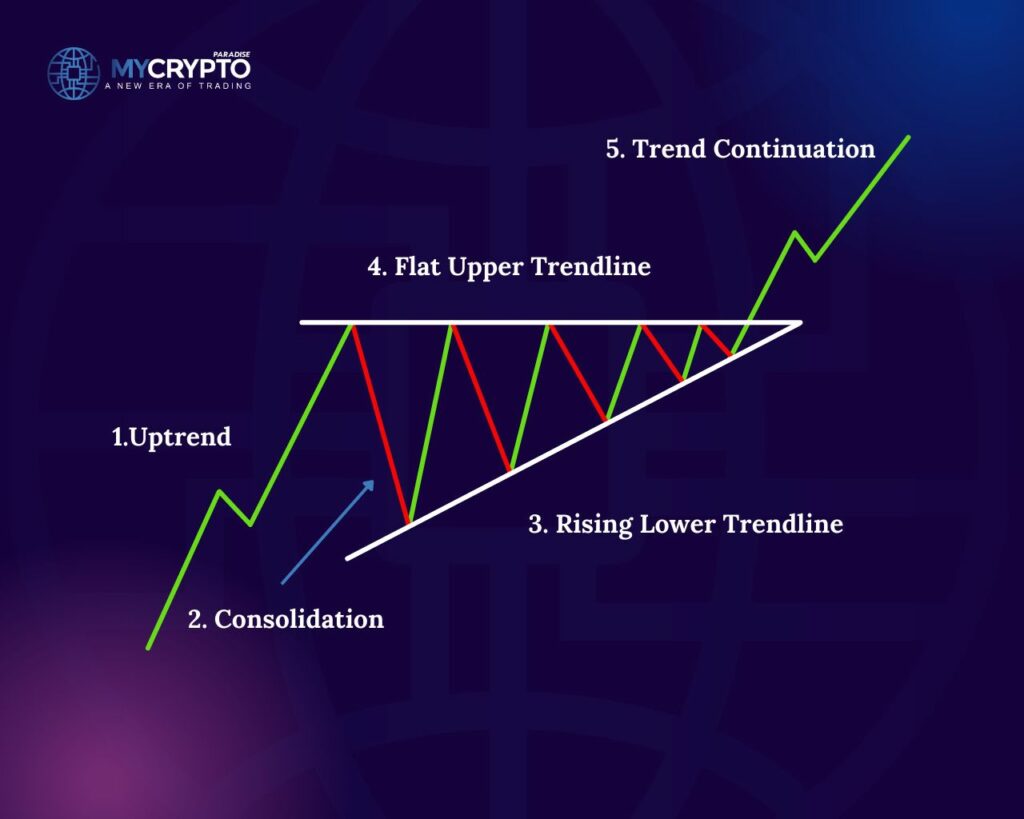
Ascending triangle candlestick pattern is an important bullish pattern. It usually results from the price of a crypto asset making higher lows. This is usually accompanied by a resistance which travels from left to right on the upside of the formation. Traders should expect to observe a horizontal trendline tracing a breadth of the resistance level. The higher lows below should be rising, as the two lines described are seen converging in an attempt to form a triangular shape.
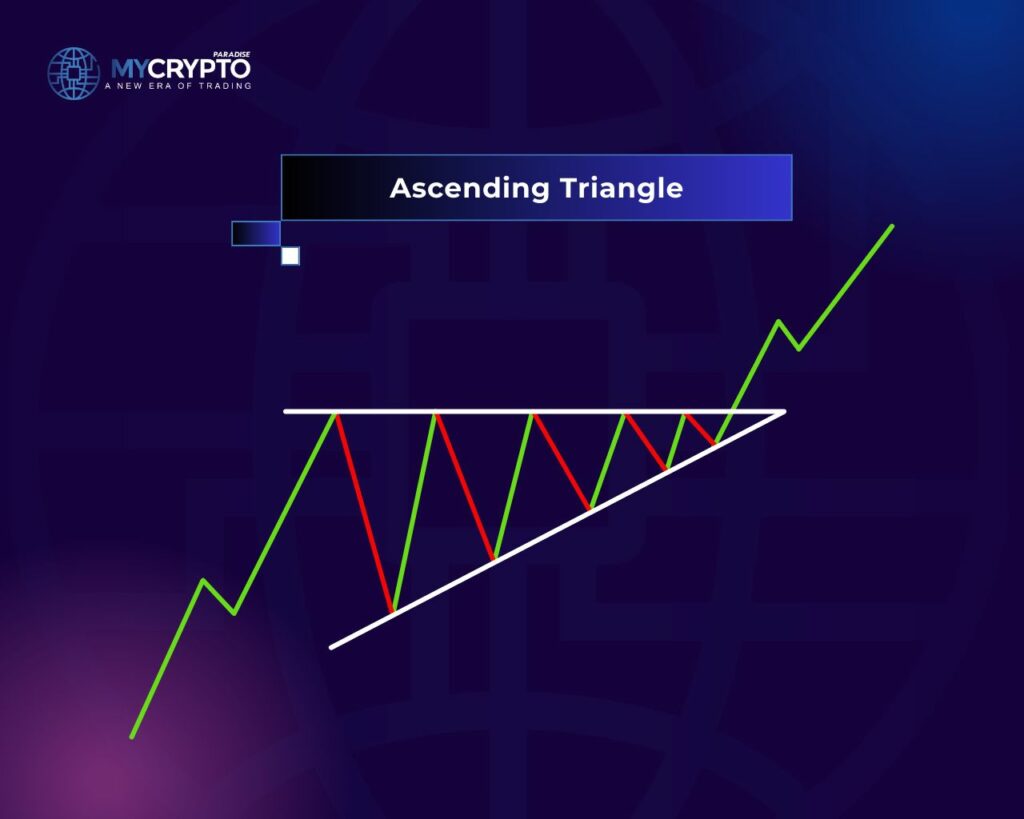
In an ascending triangle candlestick formation, buyers are showing great interests in buying the crypto asset at higher prices. Although this seems impressive, you should also note that the sellers are not able to push the price below the dynamic trend line below. In case the buyers take control, the price will break out of the triangle. This may result in a continuation of price increase.
How to Identify an Ascending Triangle Pattern

Identifying an ascending triangle pattern is relatively easy. You need to look for an asset that is making higher lows and facing resistance at a horizontal level. Once you have identified the higher lows and the resistance level, draw a horizontal trendline along the resistance level and a rising trendline along the higher lows. The two trendlines should converge to form a triangle.
It is important to note that not all triangles are ascending triangles. There are three types of triangles: ascending, descending, and symmetrical. An ascending triangle has a rising trendline, while a descending triangle has a falling trendline. A symmetrical triangle has a horizontal trendline and two converging trendlines.
Best Trading Signals: Ways to Trade with Ascending Triangle Pattern
The ascending triangle pattern is a reliable trading signal because it shows that buyers are willing to buy the asset at higher prices, and sellers are unable to push the price below the rising trendline. When the price breaks out of the triangle, it is a signal that the buyers have taken control, and the price is likely to continue to rise.
There are two ways to trade the ascending triangle pattern: breakout trading and pullback trading.
Breakout Trading
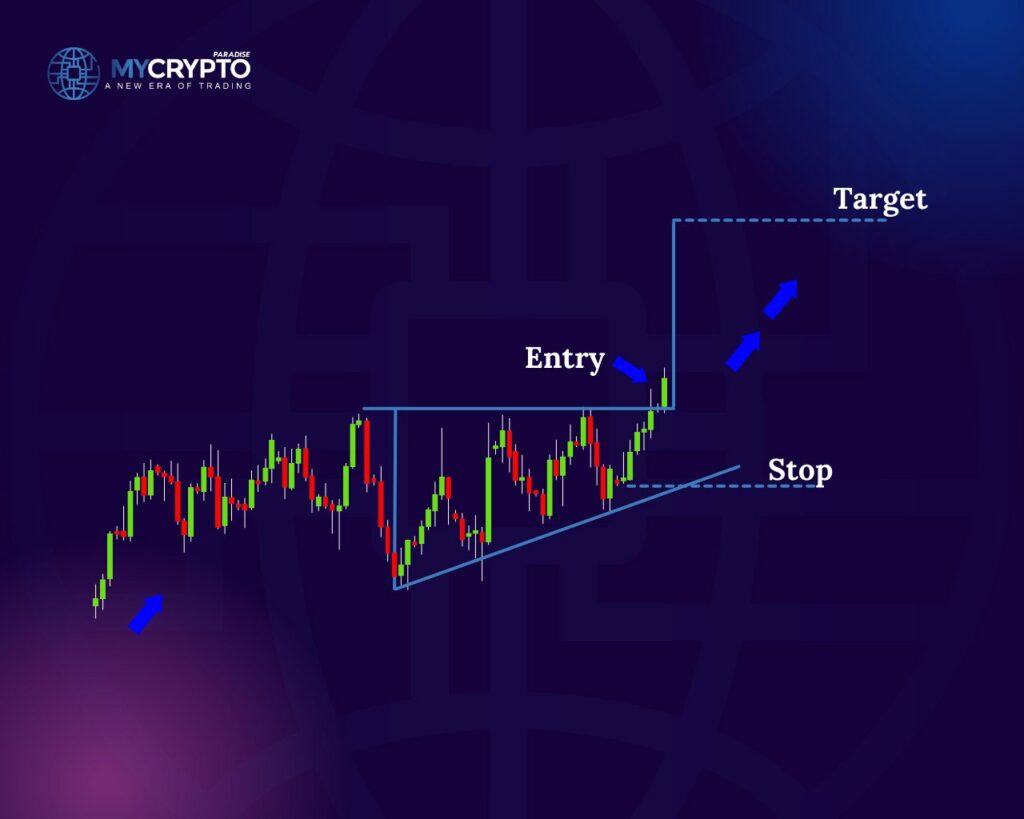
Breakout trading involves buying the asset when the price breaks out of the triangle and closes above the resistance level. The breakout should be accompanied by high volume, which indicates that there is strong buying pressure. The stop loss should be placed below the rising trendline to protect against a false breakout.
The profit target should be equal to the height of the triangle, measured from the resistance level to the rising trendline, and added to the breakout level. For example, if the height of the triangle is $10, and the breakout level is $50, the profit target would be $60 ($50 + $10).
Pullback Trading
Pullback trading involves waiting for the price to pull back to the rising trendline after the breakout and buying the asset at a lower price. The stop loss should be placed below the rising trendline to protect against a false breakout.
The profit target should be the same as the breakout trading strategy, which is equal to the height of the triangle, measured from the resistance level to the rising trendline, and added to the breakout level.
How to Properly Measure the Potential Targets When Trading with Ascending Triangle
Traders can measure potential price targets when trading an ascending triangle pattern. They can do this by measuring the height of the triangle and adding it to the breakout level. They can also use Fibonacci retracements and extensions. These are good tools to identify probable regions of support and resistance and price targets. Nevertheless, traders should use these tools simultaneously with other technical analysis tools. They should always practice proper risk management techniques.
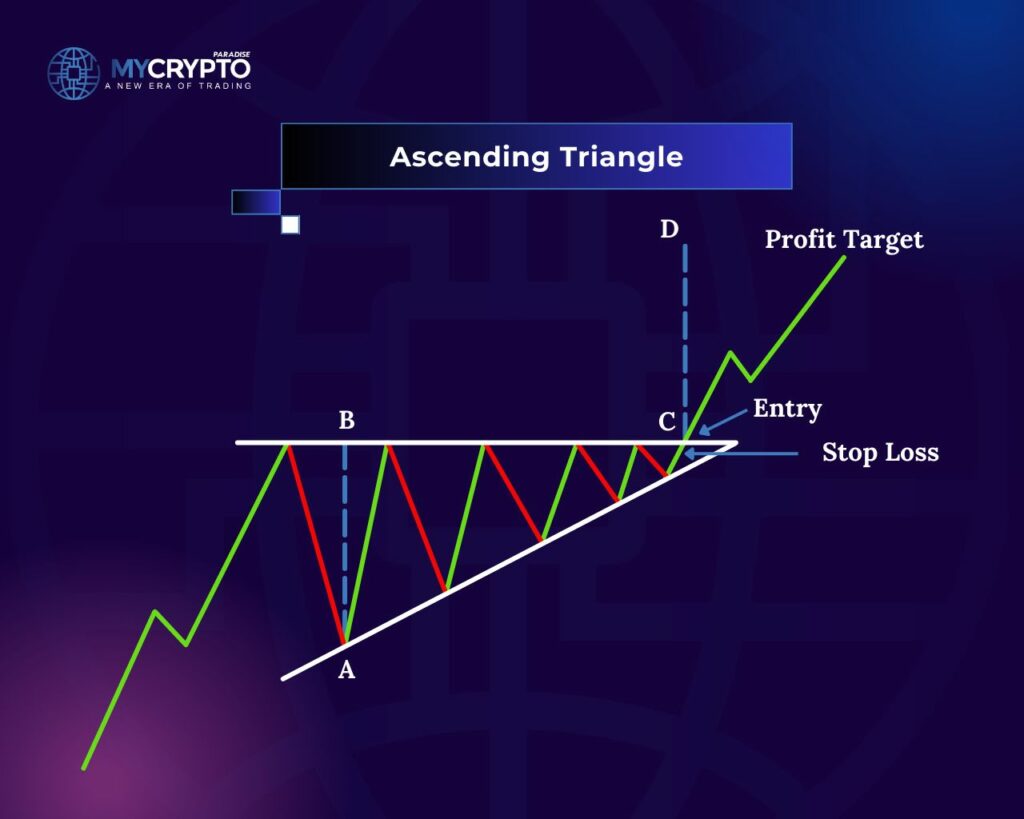
You can use the height of the triangle in a very simple way. The height of the triangle is the distance between the horizontal resistance level and the rising trendline. To calculate the potential price targets, traders can add the height of the triangle to the breakout level.
As given above, let’s say that the height of the triangle is $10, and the breakout level is $50. The potential price target would be $60 ($50 + $10).
Traders can also use Fibonacci retracements and extensions to identify potential price targets. Fibonacci retracements are levels where the price may retrace before continuing in the direction of the trend. Fibonacci extensions are levels where the price may extend beyond the previous high or low.
To use Fibonacci retracements and extensions, traders should first identify the swing high and swing low of the pattern. The swing high is the highest point reached during the uptrend, and the swing low is the lowest point reached during the uptrend. Traders can then draw Fibonacci retracements and extensions from the swing high to the swing low.
The Fibonacci retracement levels are 23.6%, 38.2%, 50%, 61.8%, and 78.6%. Traders can use these levels to identify potential areas of support and resistance.
The Fibonacci extension levels are 127.2%, 161.8%, and 261.8%. Traders can use these levels to identify potential price targets.
What are the Probabilities that the Ascending Triangle Pattern will Result in a Profitable Trade?
The most important thing is to implement the strategy properly. With careful implementation, the ascending triangle pattern is a promising pattern. The pattern is totally bullish and reliable. Using it correctly will improve your chances of making good profits.
As per whether it’s reliable or not, that will depend on several factors. For example, the strength of the trend is something to consider. Other things include the volume of trading, as well as duration of the pattern. When the pattern forms during a strong uptrend, and there is a high volume, traders are more likely to make substantial profits from this. The reverse is the case when the pattern forms a weak trend accompanied by a low trading volume.
Traders who use the ascending triangle pattern should also use other technical analysis tools, such as trend lines, moving averages, and momentum indicators, to confirm the pattern and identify potential entry and exit points.
In addition, crypto traders should always use proper risk management techniques, such as setting stop-loss orders and taking profits at predetermined levels, to minimize potential losses and maximize profits.
Conclusion
The ascending triangle pattern is a reliable trading signal that can be used to generate profitable trades. The pattern forms when the price of an asset is making higher lows, but is facing resistance at a horizontal level.
The ascending triangle pattern is formed by drawing a horizontal trendline along the resistance level and a rising trendline along the higher lows. The two trendlines converge to form a triangle, with the horizontal trendline acting as the resistance level and the rising trendline acting as the support level.
MyCryptoParadise gives free updates and analyses on trending coins like BTC and ETH. We also share secret insights and free market updates on our telegram channels. Join them below:
Ascending Triangle FAQ
What is an ascending triangle pattern?
It is a bullish chart pattern with a horizontal resistance line across the top and a rising trendline connecting higher lows. The converging lines show buyers willing to pay higher prices while sellers cannot push price below the rising support.
How do you set a price target on an ascending triangle?
Measure the height of the triangle from the resistance level to the rising trendline, then add that height to the breakout level. For example, a $10 triangle height with a $50 breakout gives a $60 target. Fibonacci extensions can offer additional reference levels.
How should you trade an ascending triangle breakout?
Enter when price breaks and closes above resistance on high volume, which confirms strong buying pressure. Place a stop loss below the rising trendline to guard against a false breakout. Alternatively, wait for a pullback to the rising trendline to enter at a lower price.
Is the ascending triangle a reliable signal?
Reliability depends on context, including trend strength, trading volume, and pattern duration. It tends to perform better during a strong uptrend with high volume, and weaker in low-volume conditions. Confirm with other indicators and apply proper risk management.
Crypto trading involves substantial risk of loss. This article is educational and is not financial advice. Past performance does not guarantee future results. Always do your own research.
What is different here
Most guides stop at the theory. The MyCryptoParadise team shares the live trades, and the reasoning behind each one, inside ParadiseFamilyVIP. Everything here is education, not financial advice.
Crypto trading involves substantial risk and is not suitable for everyone. Nothing here is financial advice; it is education only. Never risk more than you can afford to lose.


Join the discussion 1
Wow nice! Helpful! Thanks for share