


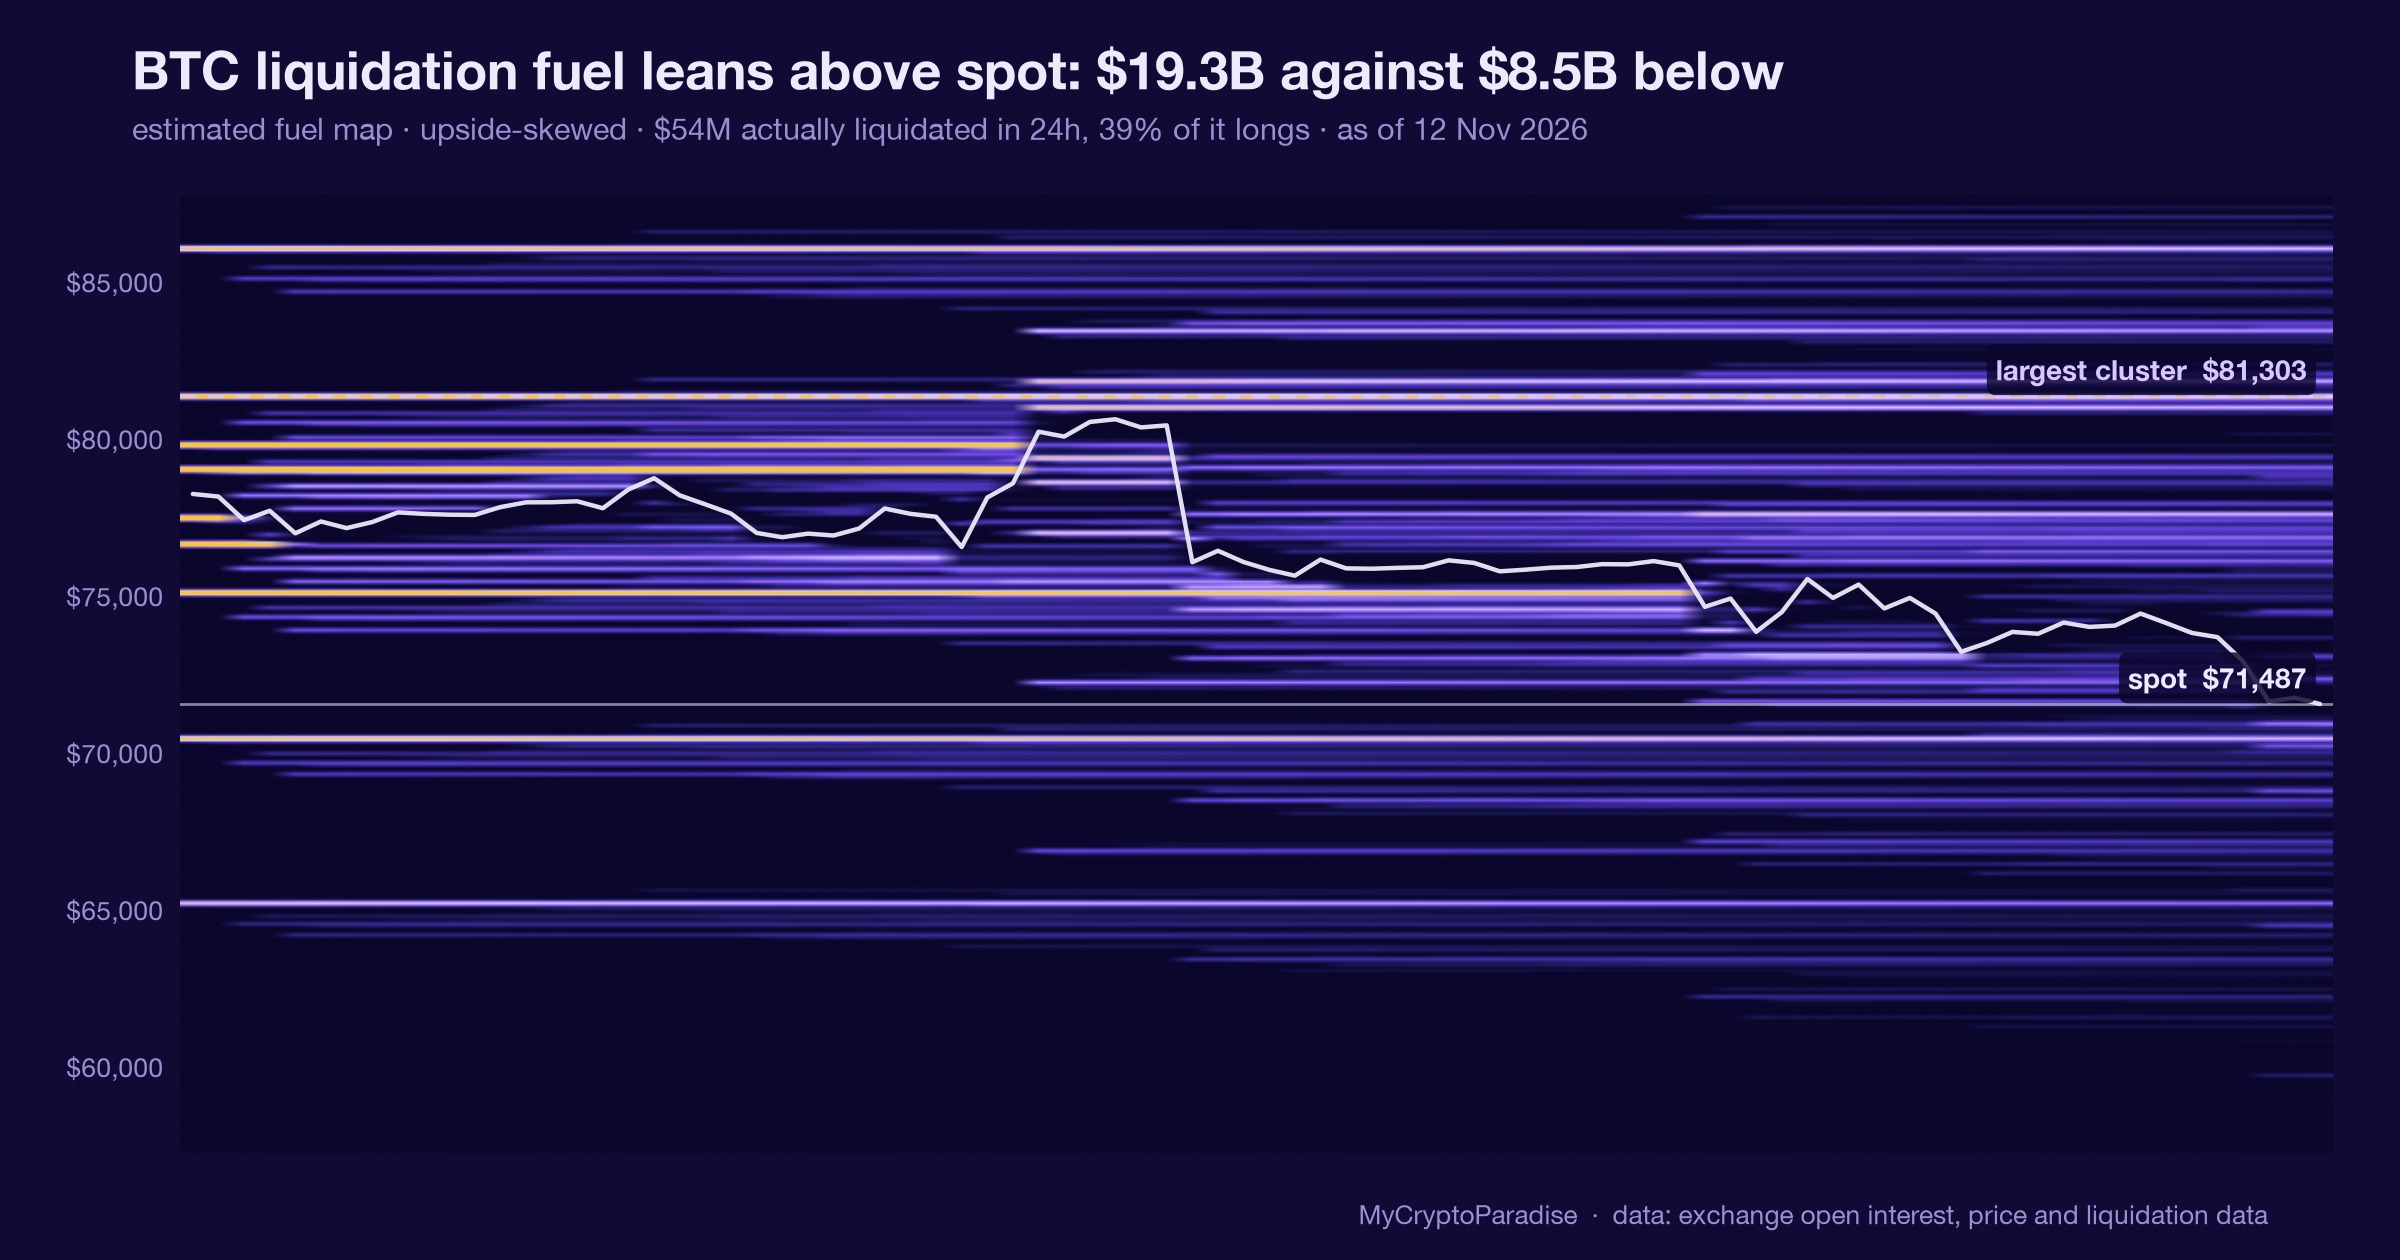
In short: Simon stays bearish on Bitcoin. He expects price to keep sliding from $71,420 toward the $69,000 support, the 0.618 Fibonacci level. A wick to $67,000 is possible. He is not catching this falling knife yet because funding stays positive, whales are selling, and no bullish divergence has confirmed a bottom.
Will Bitcoin’s drop end at $69K?
Track it live: our Crypto Fear and Greed Index updates in real time, so you can watch this shift for yourself.
Simon’s base case is that Bitcoin keeps falling toward $69,000 before any bounce. That price is his 0.618 Fibonacci retracement. It lines up with historic price action. Current price sits at $71,420, so the drop is not finished. He notes $76,000 flipped to resistance, opening this path lower.
He does not expect $69,000 to break easily. He calls it a strong multi-timeframe support. You can track these marks on the Bitcoin key levels page.
Why won’t Simon catch the falling knife?
Simon stays bearish because the setup still favors sellers. Funding rates are very positive and longs stay crowded. Those longs are funding the crash. Whales are mostly selling, so smart money is pushing price down.
There is no bullish divergence on the daily or one-hour timeframe. The market is near extreme fear, yet retail keeps trying to catch the bottom. See positioning on the crypto funding board.
What happens if $69,000 breaks?
Simon does not expect $69,000 to fall, but he maps the downside anyway. The 0.786 Fibonacci sits at $64,000. A volatile visit could wick toward the 1.618 level near $67,000. That would liquidate late longs with stops above $67,000.
His deeper target is the exchange of hands zone. He puts it at $55,000 and $44,000. That is where he waits for his next reaccumulation.
What confirmation does Simon want before going long?
Simon wants a confirmed bottom before he buys. He is watching for a finished leading diagonal, which would signal a trend change. He also wants funding to reset and whales to support a reversal.
On the one-hour chart he needs a reclaim of $74,000 first. Until then he avoids new shorts here and sizes any long small. His risk framing is covered in this position sizing guide. More breakdowns sit in the video analysis hub.
Frequently asked questions
Where would Simon place a stop loss on a long?
Simon ties stop placement to the possible wick toward the 1.618 Fibonacci level. That wick could liquidate late longs with stops above $67,000. So he would set a stop below $67,000. He adds a little extra breather to survive noise before the real move.
Is Bitcoin still bearish on the weekly timeframe?
Yes. Simon has stayed bearish since $121,000. He expects five moves down toward $44,000 before a push to new highs. He presumes that future all-time high near $169,000. On the weekly he is not bullish and waits for the exchange of hands zone.
Why is positive funding keeping price falling?
Positive funding means longs are crowded and paying to stay in. Those leveraged longs keep fueling lower lows as retail catches the knife. Simon wants retail to turn fearful and start shorting instead. Short liquidations above the market would then fuel a reversal. That fuel is missing now.
What is the secondary wave target Simon mentioned?
Simon said the secondary wave could take price up to $87,000. That is the start of the possible first wave now forming. It is a bounce level within a larger structure, not a trend reversal. He still treats the main trend as bearish right now.
MyCryptoParadise has run a professional crypto signals and trading-education service since 2016, led by founder Simon Mach and the ParadiseTeam. Simon records these sessions three times a week, and every episode lands on the Bitcoin video analysis hub.
Video transcript
Auto-captioned from the video audio and lightly cleaned, so it can contain transcription errors; the video itself is the record. It is speech, not a written article; for the structured breakdown read the sections above.
Bitcoin is testing support as volume and momentum fade, fear is moving towards extreme and big buy walls are defending the demand zone, bounce or breakdown. Let's analyze the probabilities. Yello Ladies and Gentlemen, this is Simon from MyCryptoParadise. Welcome back, it's a great video, today is Thursday and that means that you are watching the second video of this week so previously we have established that with the highest probability Bitcoin will start crashing
towards $69,000 because that was after we have lost the $76,000 and turned that into resistance the next major support right so first proper support from the daily time frame perspective $69,000 are we there yet no as you can see we are right now at $71,420 we are not yet at our magical 0.618 Fibonacci retracement level that is nicely being confluenced with the historic price action and with other important confluences that we
went through in the previous videos and that is sitting at 69,000 dollars. So very quickly on the weekly timeframe we are still bearish, you know that we are staying bearish since 121,000 dollars because we are expecting that 5 moves to take us towards 44,000 dollars before we can start pushing towards the normal time high that will be presumably at 169,000 dollars so we went through the weekly time frame in detail in
the previous video so i will not be spending time on it in this one we have went through the net analyze profit and loss and other data that will tell us and help us to understand when the macro bottom is in on the daily time frame we are bearish as well as you know the on the time we were aggressively bullish and what does it mean aggressively bullish that means that it's
not like defensive re -accumulation what we have done at 61 000 dollars that we would be holding towards the new all -time high that we believe that we believe that is going to be at 169 000 dollars the aggressive approach is the one that once we reaccumulate something right we are not planning to hold it for very long time that is why we call it aggressive reaccumulation because we are treating it
aggressively okay so we when we turned bullish on the daily time frame for a while and once we have turned at once we have turned to this resistance at 79,000 there is you know that we have turned again bearish right so on the daily time frame I'm bearish for still I'm bearish still I don't think it's a smart idea from the daily time frame perspective to be catching the falling knife which
a lot of people are right now doing right longs are catching the knife it's visible on our AI indicator right and we will understand why is it not the smart idea to do so at this moment to catch the falling knife until we can reach our daily time frame support or right demand zone so as you know 0.619 Fibonacci retracement level on the daily time frame is at $69,000, 0.786 is at
$64,000 both levels are Important and we are creating this zone with the highest probability before we can Before we can finish the the possible leading diagonal that we are right now doing That we are forming with leading diagonal this first motive wave structure before we can hit this zone from From my personal opinion, from the lower time frame perspectives and from the daily time frame perspective as well, it doesn't make much
sense to be catching the falling knife. Of course, every trader has different trading tactics, this is just my personal opinion right now. Okay, so daily time frame, I think that we have still room to go a little bit lower before we can start creating the secondary wave, right?
The secondary wave can take us up to 87,000, which is the start of the possible first wave that we are right now forming from the price action development perspective. What we are talking about is exactly this, is the possible first wave that we are right now creating in the higher degree time frame pattern that I've I've been talking about in the previous video but what is right now important is to understand
the first wave is a motive wave structure and I will explain to you in this video why we are with us probability 4 -minute inside of a leading diagonal. What is important about leading diagonal is that the fifth wave cannot be truncated all right so in impulse and ending diagonal fifth waves can be truncated in leading diagonal it cannot all right and there is from my own research quite a high likelihood
that usually the fifth waves are being extended which supports the price action that we are seeing at this moment and we I will explain it to you on the lower time frames so right now daily time frame on the daily time frame I'm still bearish all right I don't see like take a look at this our AI indicator MCP RSI intelligence that pro priorities has access to they have access to it
already strongly bearish we are not seeing any bullish divergence on the daily time frame okay so given that we are not at the demand zone from the daily time frame perspective and there is lack of bullish dollar agencies it's just increasing the the kind of the kind of probabilities for playing with bulls right so I'm not playing with bulls under the time frame I'm staying bearish right here let's zoom in into
for our time frame what we are seeing here from our beautiful indicator right here we can see strong downtrend right and when we are in a strong downtrend and we are not reaching an important demand zone from the higher degree perspective it's really not a great idea to be catching the fallen knives at least from my trading tactic perspective okay and we can see exactly this a lot of people are doing
right now so long sketch in the knife without proper confirmation that we are forming a bottom all right on the medium time frame and that is also the reason why the funding crates are having the same problem that I have shared with you in the previous video and that is also keeping me from catching the knife right now okay and the problem is that the funding crates are still positive Very positive,
the lungs are still being crowded and they are funding this price crashes okay so there is still enough fuel to keep on going as long as the retail will continue to catch the falling knife. We understand that we are already entering an extreme fear on the one hour time frame but the problem is that even though that there is a fear in the market it's not stopping a lot of people from
trying to long the price at this moment they are trying to catch the bottom without any confirmations so there are fueling and funding this continuous lower lows and this bearish trend on the medium time frame okay it's one thing when you feel fearful and second thing when you actually start shorting and betting on that fear that you have, right?
So you might feel fearful, right? And it's a different thing when you are fearful but you are still trying to catch the bottom and it's a different thing when you are fearful and you finally start to short because you believe that it's gonna go even lower and right now we are in this kind of situation that yes in the market the sentiment right now on social media is bearish but a lot
of people are still trying to catch the bottom right which is this kind of divergence and it helps us to understand that we can go even lower all right from the sentiment perspective so we are not we are already in extreme right but we can go a little bit lower still as long as this sustain that the sentiment is fearful but people are still trying to catch the bottom all right we
need to get fearful we need to get the retail fearful the masses needs to feel fearful and they need to believe that the price action their downside will continue so they can start creating short positions and as they will create the start creating the short positions with leverage, right?
It will create those liquidation levels above us, above the market price, and then the market makers will be able to push it, and as a domino effect, it will help with the path of least resistance to the upside because those short positions will be fueling the reversal.
At this moment, we don't have the recipe, we don't have the recipe and the fuel to create the reversal at this moment. It might change, you know, that markets are very dynamic and that is why with the ParadiseTeam we are monitoring the market 24 -7 and in ParadiseFamilyVIP you see exactly our personal trade setups with clear exit and entry targets.
So once we decide to do something within our trading strategy, with our trading tactics, you will know about it, right? So at this moment what we can see on the for our time frame from the price section from the technical perspective basically and price action perspective is that this was a big sign that we went through in the previous video right and the big sign was that the bears increased its volume
on the brake below that key level that previously worked as a support $76,000 right so we have created lower high but a higher high in volume right and that helped us to understand given that also we have got this reclaim then take a look at this bullish volume non -existent below the bullish below the moving average volume trend line right and that helped us to understand all right this is a successful
reclaim from below with the highest probability there will be a continuation to the downside that's what I've told you in the previous videos right we can still see that we are below the important movement average trend line and from our AI indicator we can clearly see that we are still in a strong downtrend right now we can see that the bearish volume is already decreasing as we are creating lower high right
we are also creating lower high on the volume so the bears Bears are not as strong as they have been on the push below the $76,000 but they don't even need to be that strong right now, given that what I have told you, there are no proper supports on the daily time frame between the $76,000 and $69,000.
So even though the bears are not that strong and they don't even need to be that strong because there are almost no demand levels below us until that $69,000. Okay, so even though the volume is declining and fading, the volume is fading, still they're able to create lower lows and lower highs.
And as long as this trend continues, really the next important level that I will be waiting for is that 69,000 dollars. But from, so right now from the medium time from perspective, for me personally, until I get a little bit more confirmations it doesn't really make sense to catch the falling knife until some of the data starts to change.
Yeah whales are also mostly selling so who is actually pushing the price down right now is the smart money which is again decreasing my confidence in bulls that they can start taking over right until I start seeing that the funding rates are returning that the whales are supporting a reversal and that the extreme fear is actually Supporting what the retail is actually doing until then I'm really not looking for Catching the
falling knife and I want to see a proper bottom creation first from the Perspective of lower time frames Let's take a look at something that I've already hinted a little bit a few minutes ago And that is that we are creating the extended final fifth wave.
So we are in my opinion in the final phase of the bear trend and very soon we might start seeing the Reversal so from the lower time frames we can see that we are already entering a support All right support zone. So from the lower time fan perspective because take a look at this I've taken my Fibonacci retracement tool.
If you are in proper laser membership, you have those tools Automatically creating those levels for you But take a look at this from the low to the high of the final fifth wave. All right of that higher degree sea wave. I have nicely charted the Fibonacci retracement levels and as you can see after we have lost this zone right here the next important zone was created right here and from the lower
time frame perspective we are already entering into that zone because the upper boundary is actually at around $71,500 right here and as you can see the price is already entering this demand zone from the lower time frame perspective, okay. The lower boundary 1.618 for gonadial choice meant level is nicely confluencing because it's very close to 69,000 there's all right so we can assume 69,000 to 67,000 there's will be the key support
all right the key support if we start losing the 69,000 there's which I don't believe we will lose because it's very multi time frame strong level, support level. What I believe however might happen is that if we will start seeing some volatility during our visit towards 69,000 dollars, given that bears will be able to push it that low, there might be a wake towards 1.61 Fibonacci retracement level from the time frame
perspective so we might liquidate some late longs that might have stop losses above 67,000 dollars. Given that we understand that there is this possibility if we decide to open a long position after confirmations we will need to place our stop loss based on that with acknowledgement of that right So personally, I would definitely place it at least below 67,000 hours with a little bit extra breather if I would be entrained along
position. Okay. So not only bias is important, but also understanding where you should be placing your exit targets and when you should be place where you should be placing your stop loss is like the same importance as your entry target. or bias bullish or bearish right because you need to make sure that you are being secured from the noise before the real move happens right so that is why the great stop
losses are such stop losses that when the price hits that level it doesn't start to go in the direction you initially thought so but the trend resumes, alright, and continues against you. That's the proper stop -loss and analyzing stop -losses properly is one of the key things of a long -term profitable professional traders, ladies and gentlemen.
So it's not just about bias, bullish or bearish, it's also about where you place your stop -loss and where you place your take -profit targets. So the trading tactics around your biases is similarly important as the bias you have all right so right now what we can see is the possibility that we are creating a leading diagonal which once we confirm that it was finished the leading diagonal it will confirm for
us that we are changing the trend because it's it would be the first motive motive structure all right so that would come from that from the higher degree perspective indeed we are changing the trend and then from the daily time frame perspective I would like to also see the corrective mode wave up side and that would really put a lot of probability points for me and allow me to trade with aggressive
bearish trading tactics in anticipation of catching the next big move that with the highest probability given that I will get all of those confirmations will be turned outside and it will increase the probability that we are on the way towards our exchange of the end zone that is sitting at that 55 and 44 thousand dollars alright that is the key demand zone exchange of the end zone you know exactly what I'm
talking about if you have watched the previous videos. So right now, take a look at this. The leading diagonal subdivides itself into five smaller waves, right? Each needs to respect its own rules and its own guidelines of the market breathes. So, first wave needs to be Motive Wave Structure and it was, it subdivided itself into five smaller waves.
1,2,3,4,5 perfect secondary wave corrective, 3rd wave motif, 4th wave reactionary corrective mode wave structure and right now what I have told you in the beginning of the video that the ending that the leading diagonals they don't have the 5th wave truncated right never and usually they are based on my own research extended ones take a look at this so far it's the largest sub -wave of that leading diagonal and we can
see that it's so far subdivided itself into 1, 2, 3, 4 hard degree waves alright intermediate waves and right now we are counting also the minor sub -waves of that final fifth wave one two right here three four and right now we might be finishing the minor fifth wave which will finish the intermediate fifth wave which will also finish the primary fifth wave all right so so far we have created one
two three four and right now we might be finishing the final fifth of the fifth of the hard degree fifth all right once that's finished and as you can see it's Beautifully, the momentum is slowing down as we are entering the support and as we are finishing the pattern All right which is Beautiful and it's increasing the probability that we are in a final phase of this of this medium time frame
bear trend So what we can see the volume is fading the momentum is fading on The RSI we don't have a proper probably the points that would help me to understand let's start catching the reversal but once we get that ladies and gentlemen if you are in prison VIP and I will get those confirmations or somebody else from the ParadiseTeam you can be sure that you will know about that if you
will start entering some position so at this moment we are in this demand zone so if you have not created a short position before I would avoid entering a new short position right here okay right now I'm starting to look for bullish trading confirmations and I'm planning to play with bullish trading tactics I'm not usually playing against the major trends ladies and gentlemen given that I understand that we are probably changing
the main trend from bullish to bearish I will be probably focusing more on being aggressive on the bearish confirmations, but I might also take some long position if I get enough confirmations, but obviously it will be with not a big size, given that we understand the hard degree trend.
So on the one hour time frame Here we can see that still the momentum is a strongly bearish even though that on the for our time frame We can see that it slowly starts to fade but still there are no Confirmations of some bullish divergence from the low time frame from the one hour time frame perspective So I am waiting for $16,000 and at this moment it still seems like we will
be able to continue a little bit lower. Alright there might be some shakeout in the low time frame but until we can reclaim at least this lower time frame local high which is at $74,000, nicely conferencing with this resistance I am Really not interested into kitchen falling knife me personally at least and I'm I'm focusing on the swing longer longer term swing trading setups and position Okay, so, you know on the
weekly time frame we had done the aggressive positioning After we have distributed at 109 and 120 and around 121 thousand there's all of our Bitcoin we have done aggressive the last aggressive positioning at $61,000 but then once we have hit $79,000 we have again moved most of our Bitcoin to USDT and right now I'm waiting for another rare accumulation and this exchange of the hand zone I'm not bullish on the weekly
time frame zone still bearish on the daily time frame there might be some nice opportunity once we get to this zone and we will have some confirmations but again given that I understand that we are probably changing already the trend I will not be very aggressive on that setups even if I will decide even if I would decide to enter some long position for our time frame you already know and on
the on the one hour time frame I have right now told you exactly what I'm waiting for Alright so ladies and gentlemen I will keep you updated again on Saturday until then trade safe trade with professional trading strategy because if you don't have a strategy then your strategy is to fail so I will see you safely again on Saturday until then take out.
Cheers.
Educational content, not financial advice. Crypto trading carries substantial risk; you can lose your capital. Past performance does not guarantee future results.









Join the discussion
No comments yet. Members, share how you are reading this.