

Listen: the breakdown
Developing story update (November 13, 2026, 10:47 UTC):
This is insane. Bitcoin has $14 BILLION in upside liquidation liquidity compared to just $660 MILLION on the downside. That's over 20x more liquidity above the current price. A massive short squeeze could be coming.
Developing story: This story is still unfolding. We are tracking it and will update this article as more details are confirmed.
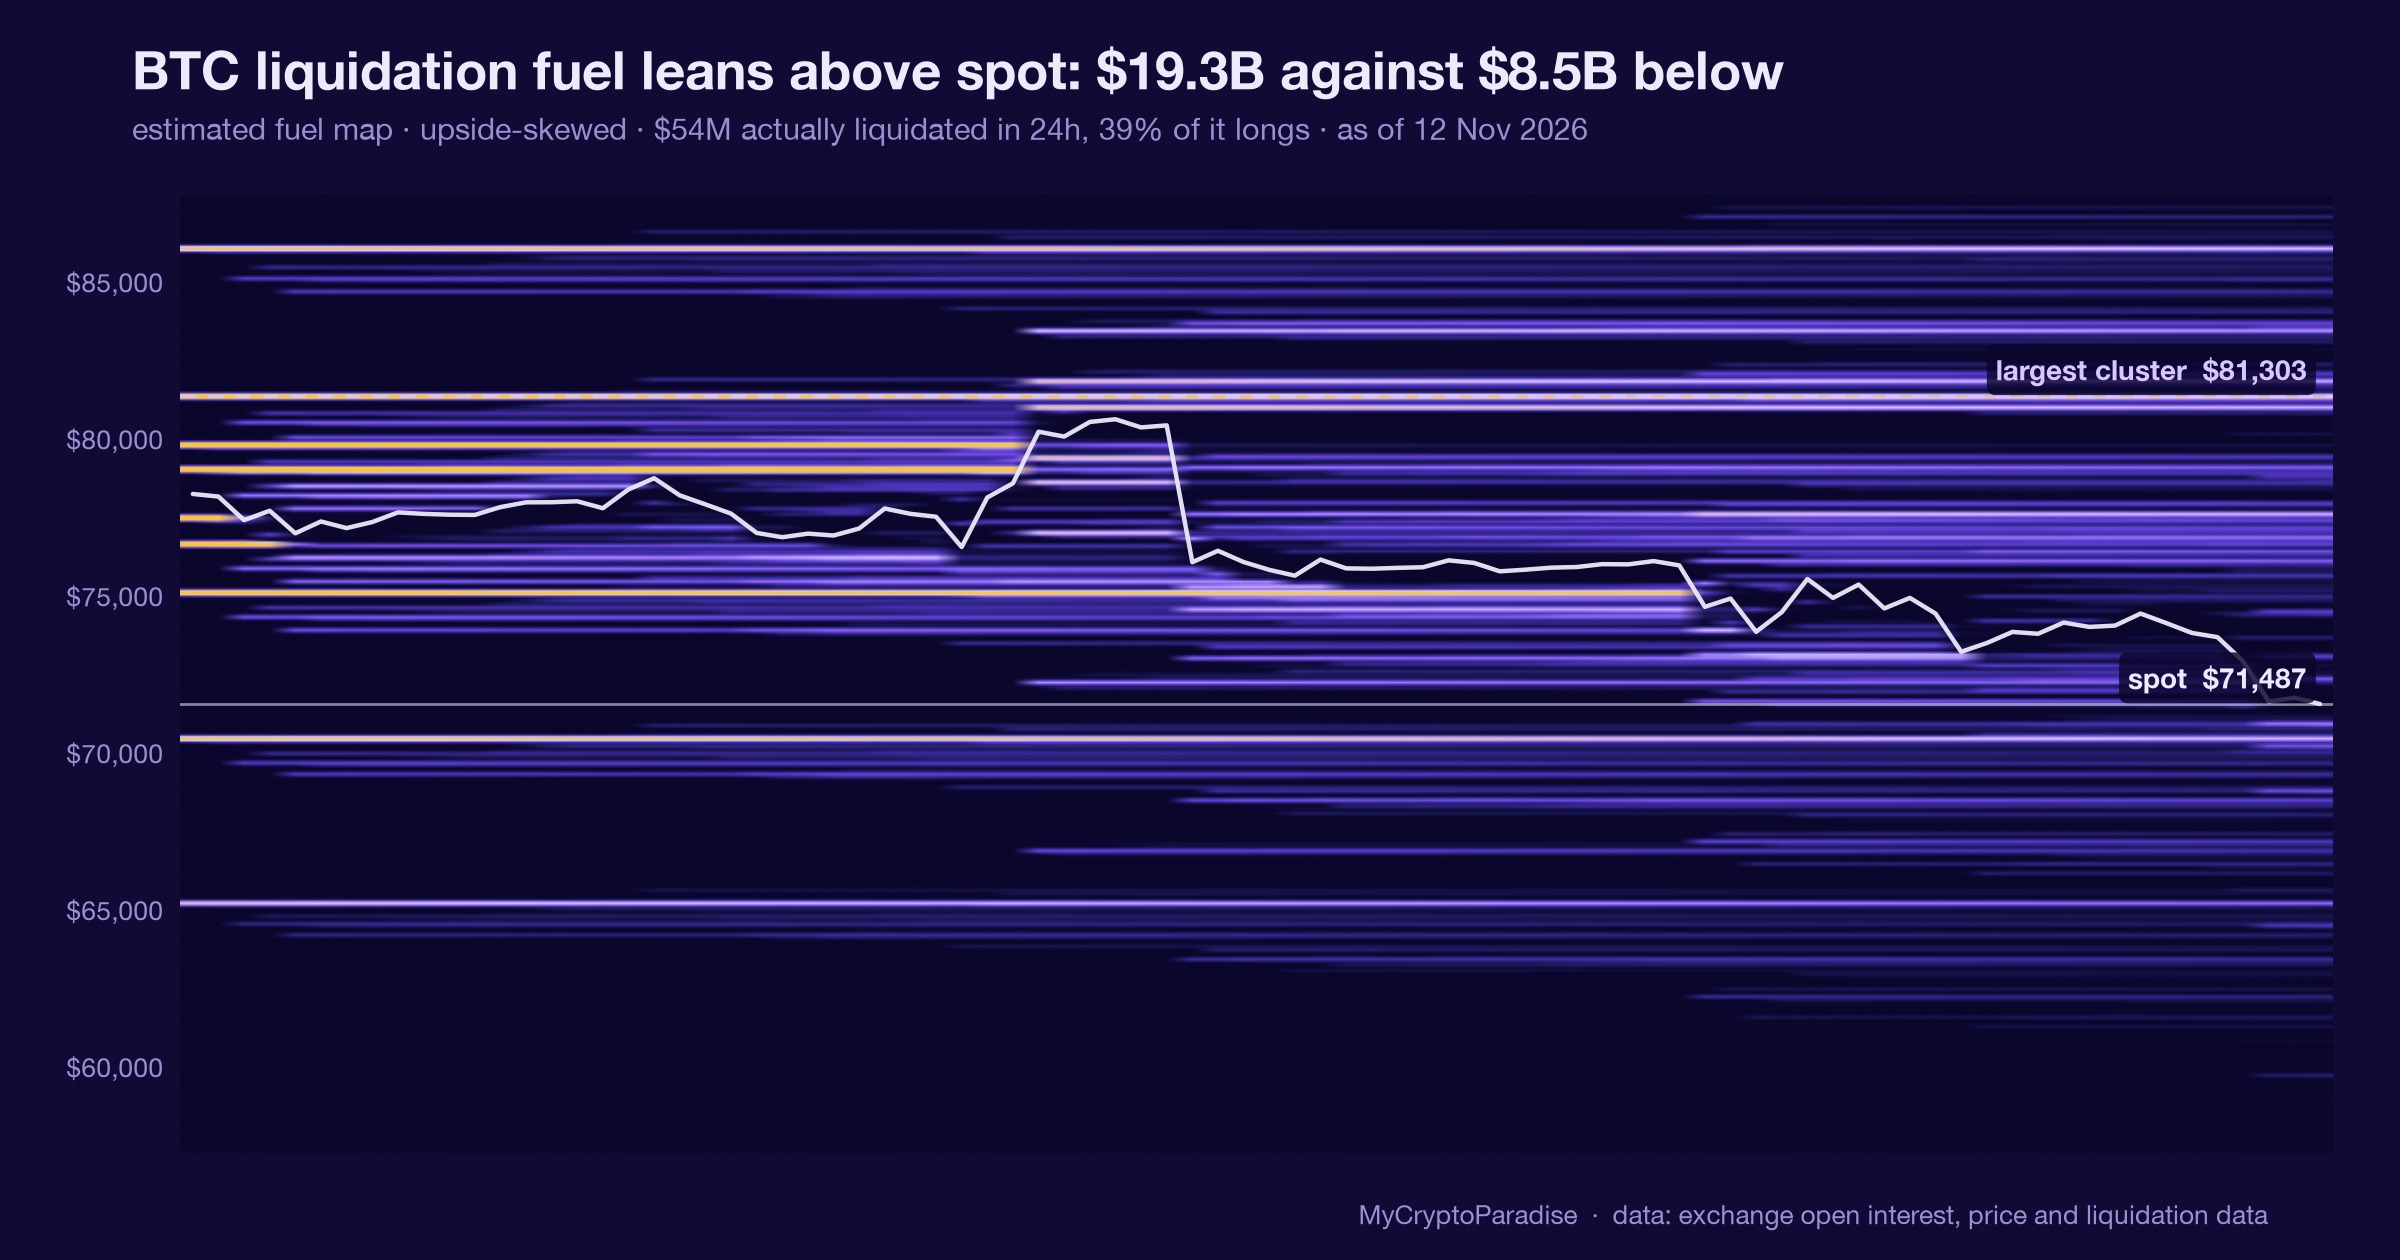
Market briefing: Bitcoin was trading near $68,755, down more than 6% on the day, after $1.4 billion in longs were liquidated. The latest Bitcoin liquidation heatmap now shows the heavier leverage sitting above price, not below it.
- BTC fell below $70,000 near $68,943, with $622M liquidated in four hours, mostly leveraged longs.
- Total crypto liquidations hit $1.4B in 24 hours; $1.26B of that was long positions alone.
- The heatmap shows liquidity building at $76.5K to $77K above price, yet clusters still sit near $67K to $68K.
The Bitcoin liquidation heatmap now shows most leverage resting above the market after a $1.4 billion flush of longs. Has the downside truly been swept, or only paused?
Bitcoin lost the $70,000 handle in a hurry. Price slid to roughly $68,943 as liquidations tore through the market, around $622 million of them in a single four-hour window. Almost all of it was leveraged longs, the same crowd that had leaned one way for weeks.
Zoom out and the number grows. Total liquidations across crypto reached $1.4 billion over 24 hours, and $1.26 billion of that was long positions alone. ETH and XRP bled alongside BTC, which is what sympathy looks like when leverage unwinds.
The heatmap is now the thing everyone is debating. A one-week liquidation map shows significant liquidity building higher up, around $76.5K to $77K, with the heavier leverage concentrations sitting above price rather than beneath it. The popular read is simple: the downside is done, and the fuel now rests overhead.
We would add a caveat. Another slice of the same data still shows live long-liquidation clusters parked near $67K to $68K. A move under $67,000 would push cumulative long-side liquidation intensity across major exchanges toward $276 million. So the floor is not as clean as the headline suggests.
BTC also closed below its 20-week and 50-week moving averages on the way down, trading near $71,421 at one point before sliding further. That is a structural break, not a rounding error.
There was no single confirmed catalyst on the day. The slide lines up with rising Fed rate-hike odds and CPI-driven volatility, which is our interpretation, not a verified trigger.
Leverage, not conviction, drove this flush
Mechanical selling and genuine selling are not the same thing, and the difference matters here. A liquidation cascade is automatic: once price hits a cluster of stops, exchanges close those positions for the trader, which shoves price into the next cluster. That is self-feeding downside. It explains how $1.26 billion in longs vanished without a fresh piece of bad news.
The macro backdrop gave it room to run. Rising Fed rate-hike odds and CPI-driven volatility thinned risk appetite everywhere, so fewer willing buyers were there to absorb the forced sells. Tighter expected liquidity does that to every risk asset, and crypto sits at the far end of the risk curve.
Breaking the 20-week and 50-week moving averages matters because systematic funds and trend-followers watch those lines. Losing them can invite a second mechanical wave from a completely different crowd.
Here is the part the heatmap actually changes. When the deepest resting liquidity flips to above price instead of below it, the short-term incentive flips too. Stops and unfilled short liquidations overhead become a target for any bounce. Markets have an old habit of drifting toward the money.
That is why a brutal flush can quietly set up the opposite move. The leverage that pushed BTC down has largely been purged, and a lighter book is easier to lift than a crowded one.
Where the remaining fuel now sits
BTC sets the tone, and right now it is setting it for the whole complex. The flush cleared crowded longs, and a market that has just purged its leverage is lighter and easier to carry higher. With the heaviest resting liquidity near $76.5K to $77K, bounces tend to get drawn upward, because that is where short liquidations and stops are waiting.
ETH and XRP fell in sympathy, which tells you this was positioning, not a story about any one coin.
Open interest, the total value of live derivative bets, dropped sharply as those longs closed. Lower OI after a flush means less fuel for more forced selling, so the path of least resistance can quietly reverse. That is the bullish mechanic inside an ugly red candle.
Alts are the high-beta tail of this move. They dropped faster than BTC and, if BTC reclaims lost ground, they can snap back faster too. That cuts both ways, so size matters more than conviction here.
The honest tension is the floor itself. Our own data still shows long clusters near $67K to $68K, so the swept-downside story is only partly backed. A fresh break under $67,000 would hand sellers roughly $276 million in further long liquidations to feast on. The squeeze setup is real, but it is not yet confirmed, and treating it as a settled bottom is how retail gets caught twice.
The open cluster still parked at $67K
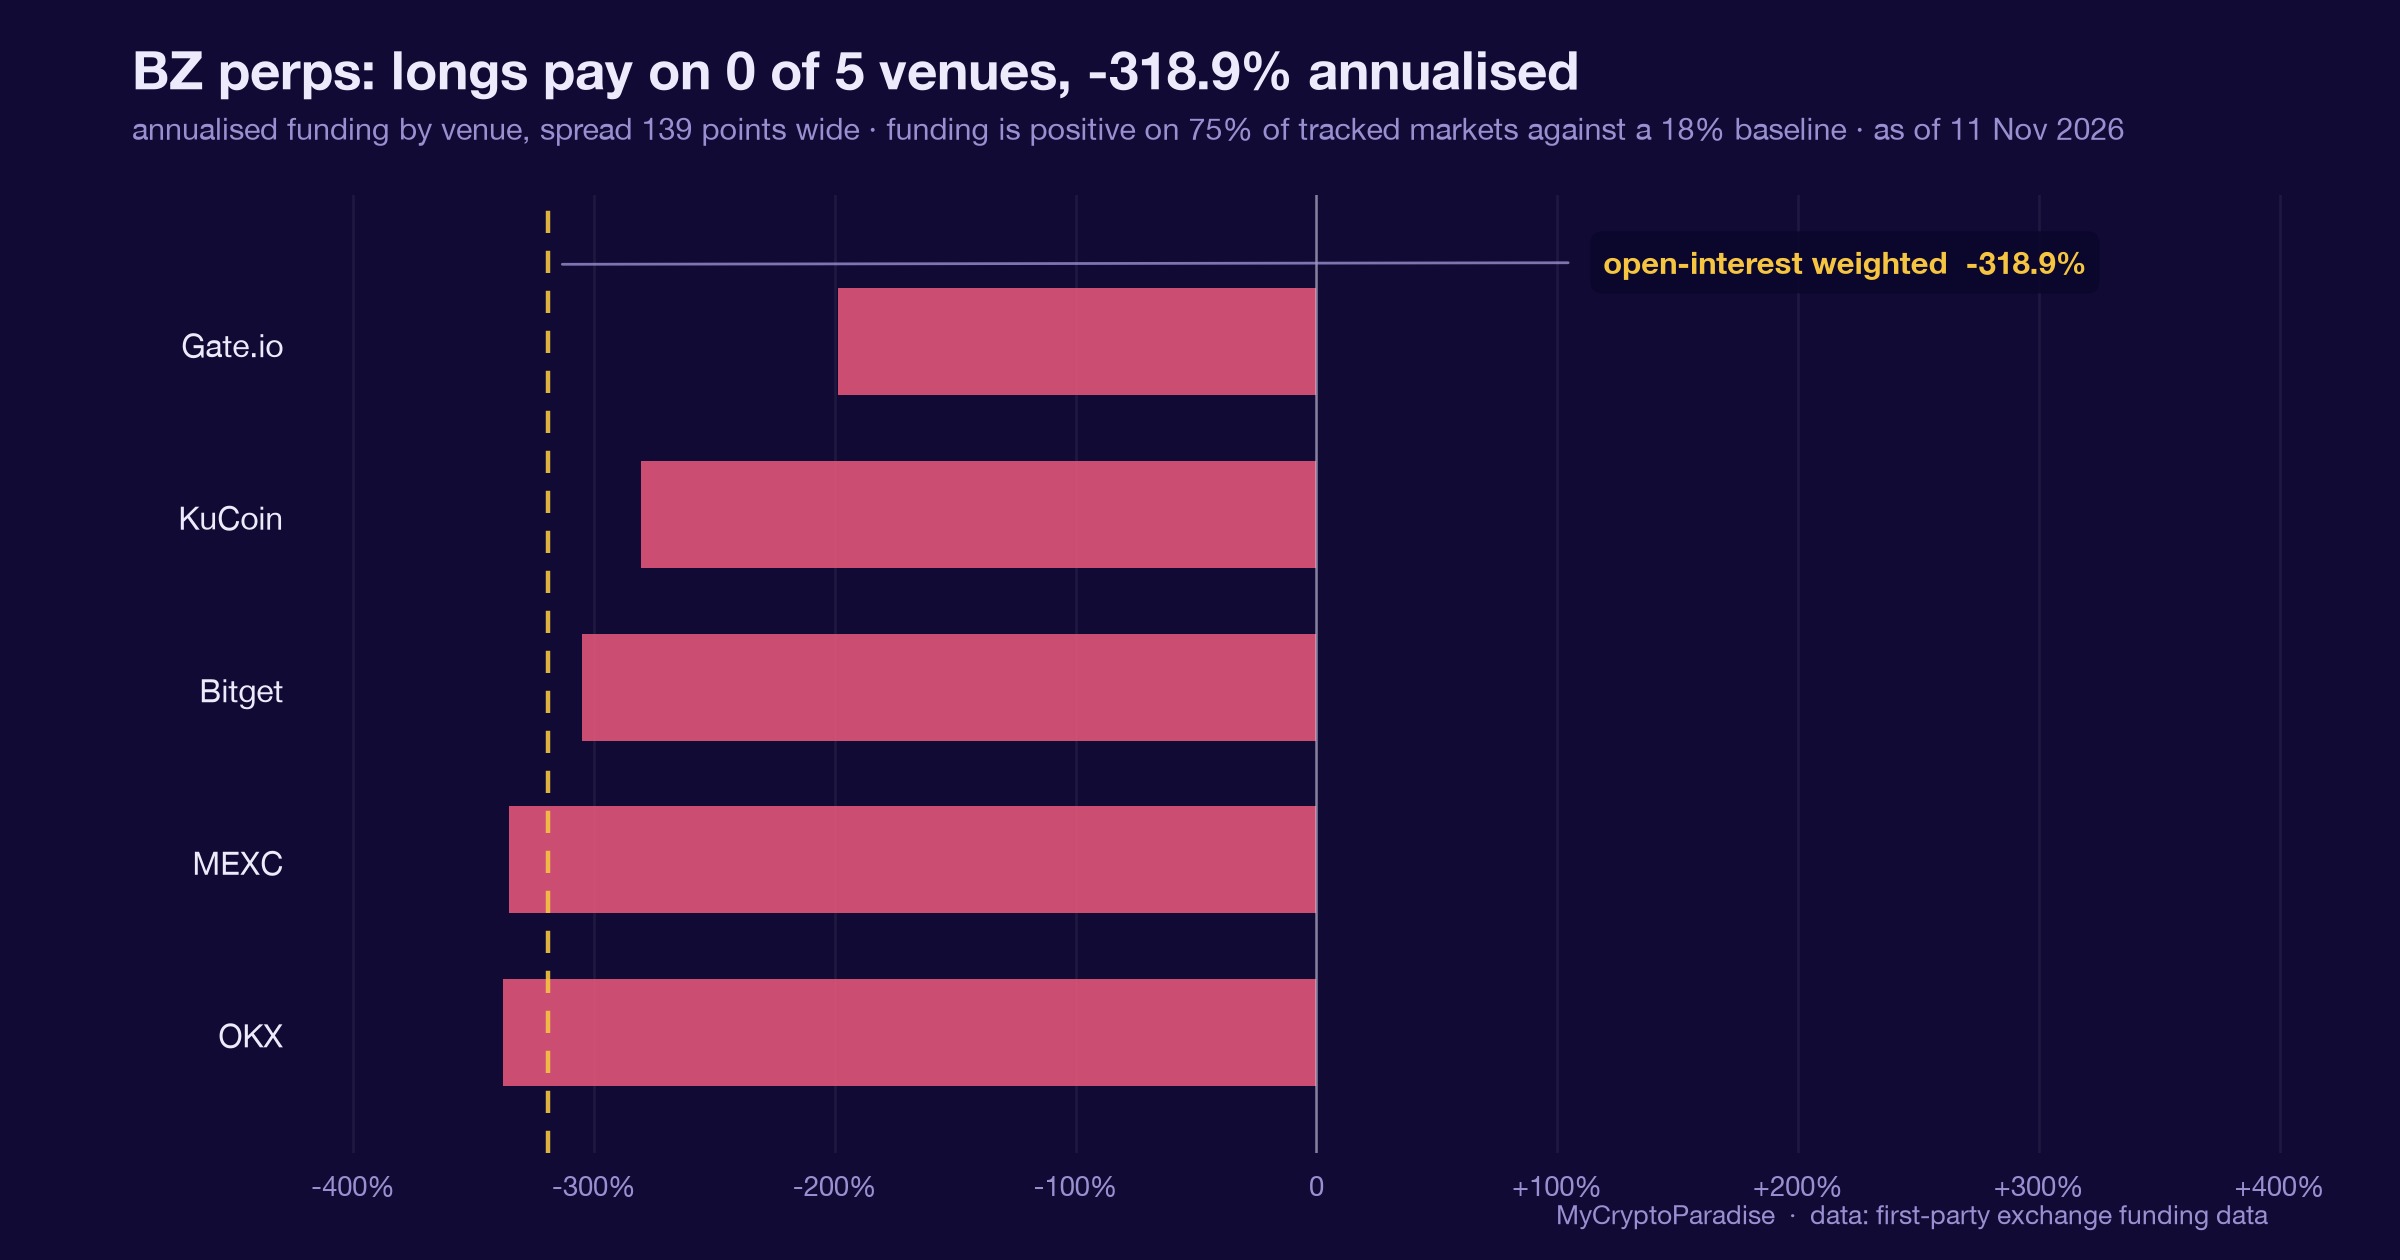
Funding rates are the first tell. Funding is the periodic payment that longs and shorts exchange, and it has stayed positive, which means longs are still crowded and still paying to hold. A flip to negative funding, with shorts building, would be the cleaner signal that the squeeze fuel overhead is loaded.
Watch the $67,000 line closely. It is the gateway to that remaining $276 million of long-side liquidation intensity. Hold above it, and the swept-downside read gains weight. Lose it on strong volume, and the heatmap's clean-floor claim falls apart fast.
Reclaiming lost structure is the confirmation that actually counts. A daily close back above $72,000, then a push toward the $76.5K to $77K liquidity, would show the bounce is reaching for the overhead fuel rather than fading.
Whale behavior is the quiet variable. Through this drop, the larger wallets have mostly been sellers, not buyers. A visible shift from distributing into supporting price would turn a mechanical bounce into something with legs.
CVD, or cumulative volume delta, is the tie-breaker. It tracks whether aggressive buyers or sellers are in control. Rising price on rising buy-side CVD is real demand. Rising price on falling CVD is a bounce running on fumes, and that is the version that traps the dip-buyers all over again.
What stacked leverage above price implies
The ParadiseTeam reads this flush as a genuine reset, not a resolved bottom. The heatmap's overhead leverage near $76.5K to $77K is real squeeze fuel, so a sharp relief bounce is very much on the table from here. BTC was trading near $68,755 as the longs got purged, right at the edge of the zone we have flagged for weeks.
That zone is $69,000 into $67,000. We treat $69,000 as key daily demand, with a possible wick toward $67,000 before any durable turn. Above us, $76,000 is now lost support acting as resistance, and $72,000 is the first reclaim that matters.
Here is our caution, and it is not an argument against the bounce. Funding is still positive, whales are still mostly selling, and sentiment has hit extreme fear while retail keeps trying to catch the knife. That is a crowd positioned for a reversal it has not earned yet. So strength into $72,000 and toward $76,000 can still run straight into willing sellers. We want confirmation before calling a trend change: funding turning negative, whales shifting from selling to support, and a proper bullish signal on the daily.
For now this is a squeeze-prone market, not a confirmed floor. The leverage is stacked overhead, which favors a push up, but a loss of $67,000 reopens the downside the heatmap claims is already gone.
The read behind this: we framed this story through our own market analysis, Will Bitcoin's Drop End at $69K?
Track it live: our live crypto funding rates and the Crypto Fear and Greed Index both update in real time, so you can watch this shift for yourself.
Related coverage
For exact entries, targets, and stop losses with full risk management, that is what ParadiseFamilyVIP is for. New to reading these moves? Start with our crypto trading strategies guide.
ParadiseTeam is monitoring the market situation closely, and we are taking these developments into consideration while building our trading tactics inside ParadiseFamilyVIP.
Crypto trading involves substantial risk. Prices are volatile and you can lose money. This article is educational and is not financial advice. Past performance does not guarantee future results.
Does BTC reclaim $72K before it loses $67K?
Settles on BTC's first hourly close above $72,000 or below $67,000, at the latest Fri 20 Nov.
How 2 Paradisers are calling it
The first call is still open
Free account, no password. Members just sign in.
An education game, not trading advice.
Follow this topic: Crypto liquidation news











Join the discussion 3
Ricardo's got a fair point about the last cluster, but my notebook of weekly leverage levels taught me more than any single flush !! Curious whether anyone else tracks the clusters that never got hit 🙂
Still carrying the May 2021 cascade from watching it on a work screen, so I'd want open interest to fall before trusting these clusters. Ricardo, maybe we're just reading different timeframes.
lol no, a $1.4B flush is exactly what people said about the last "clusters are open" setup too, and my mate got wiped chasing it. leverage liquidity maps are not a plan, they're a casino menu!! 🙄