

In short
Market makers are firms that quote both a buy price and a sell price at once, so other traders always have someone to trade with. They provide liquidity and earn the small gap between those two prices. Prices wick when that liquidity thins out. A large order hits a near empty order book, price travels fast to find resting bids or offers, then snaps back once the gap fills. Stop orders clustered at obvious levels add fuel. A long wick is mechanics, not a personal hunt. It shows where liquidity sat, not where price is going next.
Who are market makers and what do they provide?
Market makers are firms or algorithms that continuously post both bids and offers on an exchange. They stand ready to buy from sellers and sell to buyers, earning the spread between the two quotes. Their role is to keep markets liquid, so you can enter and exit without large gaps.
A market maker earns the spread, the small gap between the best bid and the best ask. On deep pairs like BTC that gap is tiny. On a thin altcoin it widens, because fewer firms are willing to quote there.
This is a normal market function, not a conspiracy. The same role exists in stocks and foreign exchange, and it is well described in standard market structure references. Someone has to stand between buyers and sellers.
What is different here
The ParadiseTeam reads resting liquidity across all major exchanges before trusting any single wick on the chart.
How a two-sided order book creates and removes liquidity
An order book is a live list of resting buy and sell orders at every price. Bids sit below the current price. Asks sit above it. Together they form the two sided market a maker quotes.
Liquidity is created when traders post limit orders and leave them to rest. It is removed when a market order crosses the spread and eats through those resting orders. You can watch this depth in real time on our Bitcoin Order Book Walls page.
Three things shape how much a price moves on each trade:
- How much resting liquidity sits nearby
- How large the incoming market order is
- Whether a maker steps in to absorb it
Why do wicks happen?
Wicks happen when a market order meets a thin order book. Price jumps to the next resting liquidity, fills there, then returns once that pocket is absorbed. Clustered stop orders at round numbers speed the move along. The long tail marks where liquidity sat, not a plan to trap you.
Picture a quiet book with few orders between prices. A large sell hits it. Price slides down fast to reach the next cluster of bids, fills there, then recovers as buyers step back in. The tail you see is that round trip.
Stop orders make it faster. Many traders place stops at the same obvious levels, just past a round number or a recent high. When price touches that zone, those stops fire as market orders and extend the move before liquidity absorbs it.
A long wick is not proof someone is hunting you. It is the chart showing where liquidity was thin and where resting orders finally stopped the move. The absorption at that level is the real signal, not intent.
How do you read a wick without assuming intent?
Read a wick as information about liquidity, not a message about direction. Note where it reached, how fast it reversed, and whether volume confirmed the rejection. A wick into a known level that snaps back shows absorption. It tells you where orders rested, nothing more.
Three questions keep your read honest:
- Did the wick reach a known level or random air?
- How quickly did price snap back?
- Did volume confirm the rejection?
Context matters more than the wick alone. A long tail into a candlestick pattern at a tested level means more than the same tail mid range. Read the location first, then the candle.
Where resting liquidity tends to sit around ranges and daily levels
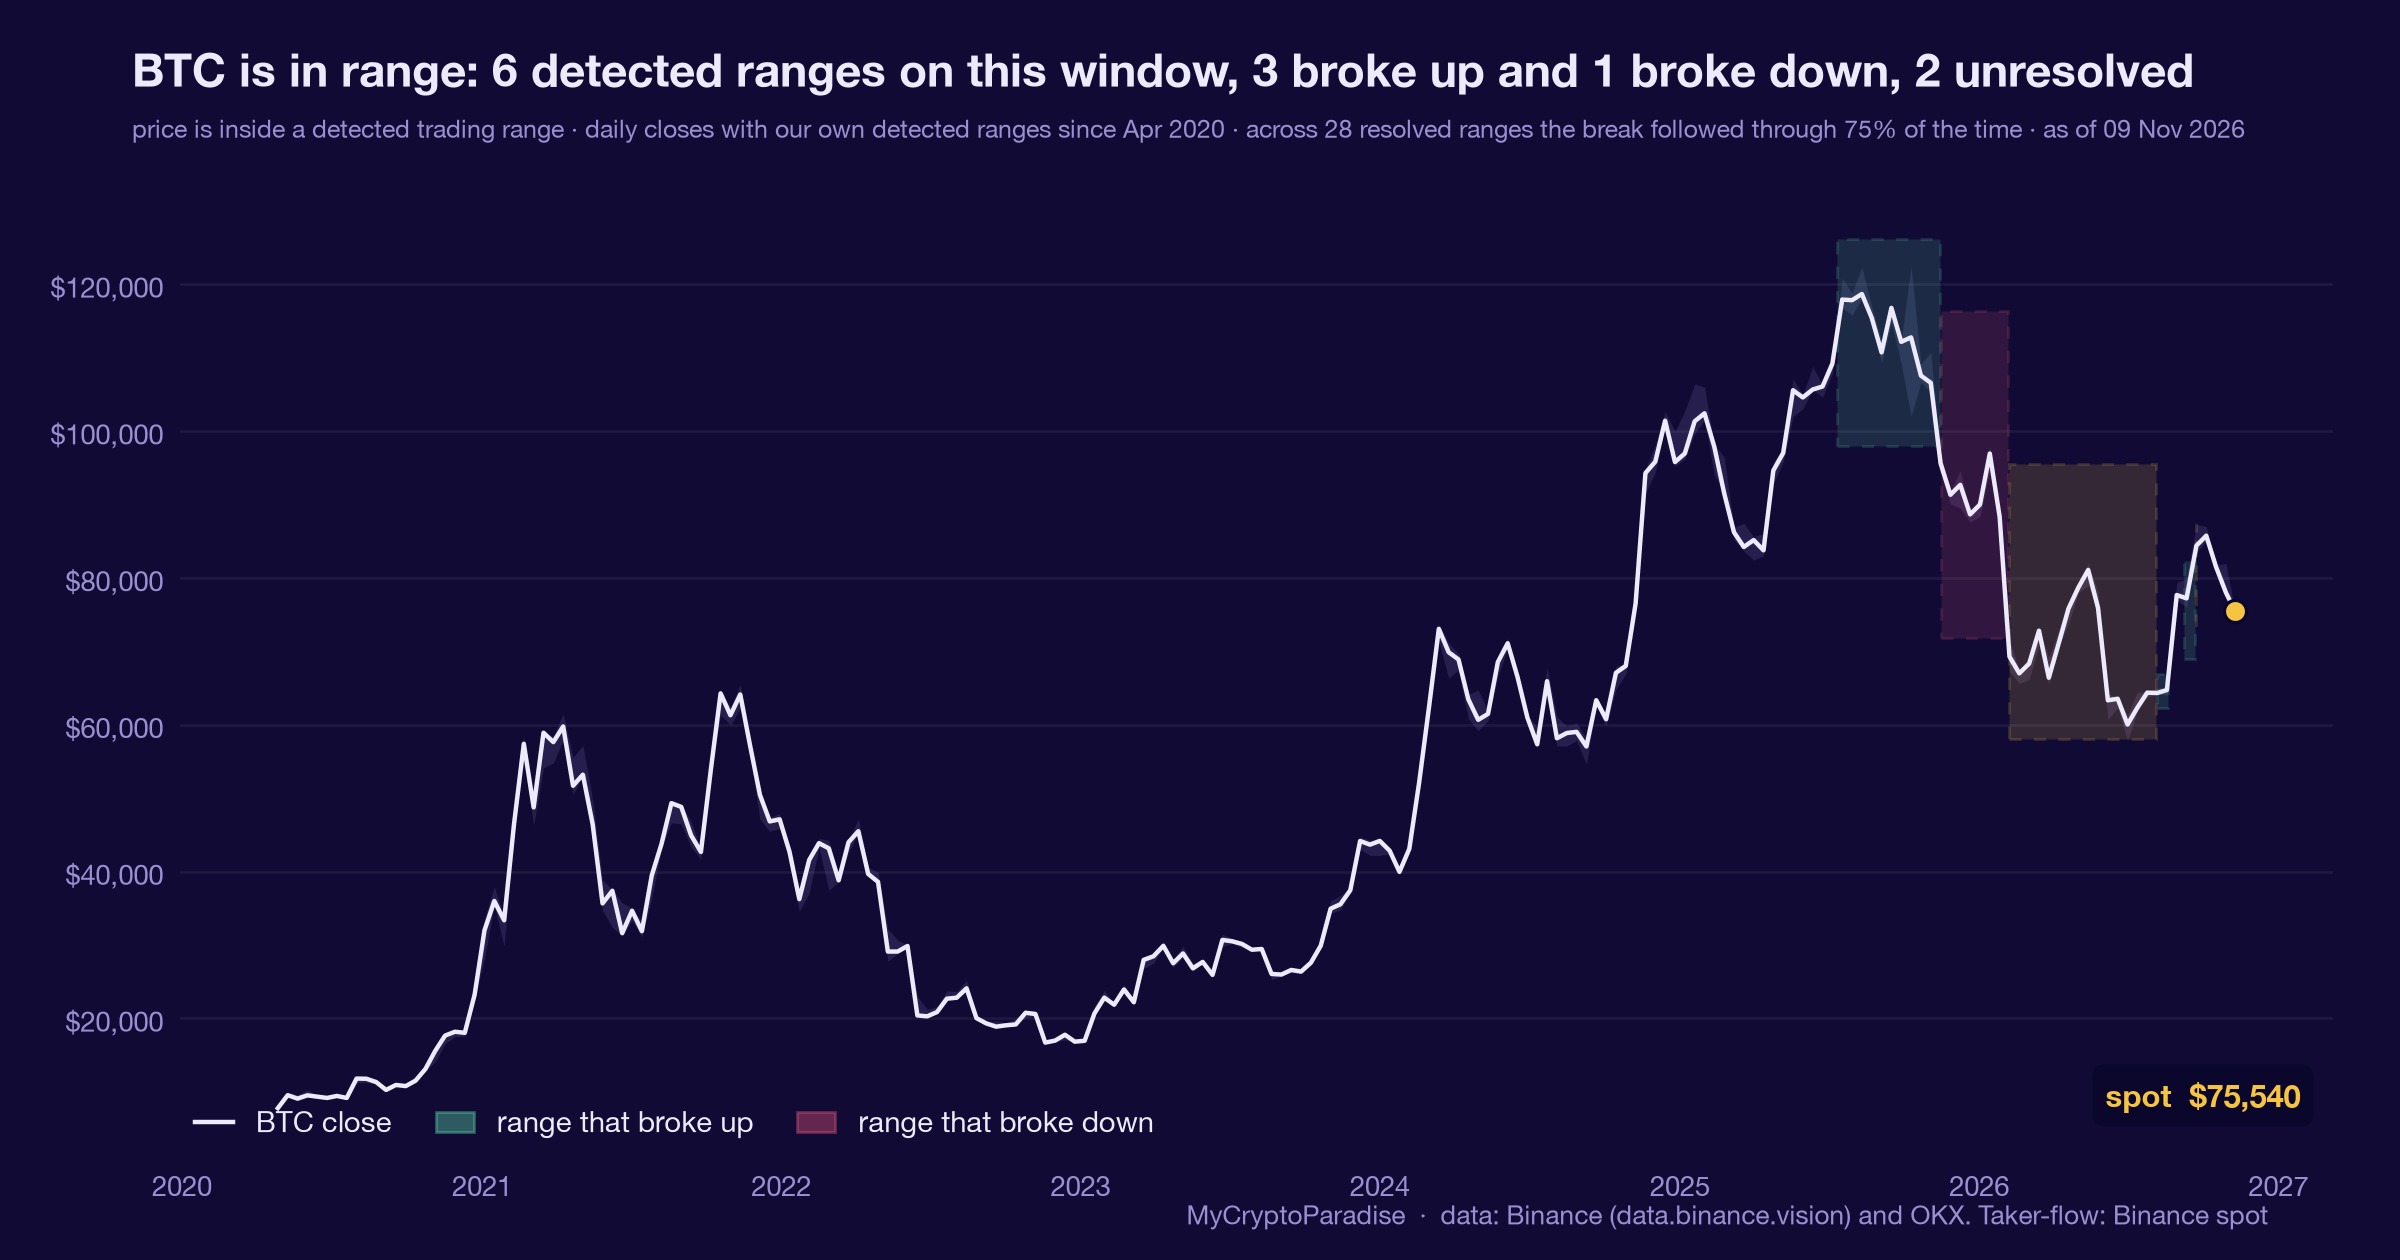
Liquidity is not spread evenly. It pools where traders place orders, and traders cluster around levels they can see. Range edges, prior highs and lows, and the daily open all collect resting orders and stops.
When you mark a trading range, the edges become the zones where wicks are most likely. A sweep just past the edge, then a sharp return, is a classic absorption print.
| Level type | Why liquidity clusters there |
|---|---|
| Range edge | Breakout stops and limit orders stack here |
| Prior high or low | Old reactions leave resting orders and stops |
| Daily open | Many traders reference it, orders gather around it |
| Round number | Human bias puts stops at clean figures |
On BTC you can cross check this against a recent liquidation map read, which shows where leveraged stops sit. Where many stops cluster, a wick can run further once the first ones fire.
What this does and does not tell a trader
Reading liquidity tells you where moves are likely to accelerate and where they may stall. It does not tell you direction, timing, or the next candle. Anyone selling that certainty is selling you a story.
Many paid groups dress this up as a secret edge, claiming they front run every wick. That is marketing, not market structure. A wick is a probability read, not a forecast, and it earns respect only as one input among several.
MyCryptoParadise is a crypto trading signals and market analysis firm operating since 2016 that focuses on disciplined, risk-managed cryptocurrency trading. That discipline starts with reading structure honestly. A wick shows you where liquidity sat, and that is useful. It is not a crystal ball, and no tool makes it one.
Frequently asked questions
Do market makers move price against retail traders on purpose?
Not in the way the word hunt suggests. Market makers quote both sides to earn the spread, not to chase your single stop. Price reaches your level because resting liquidity sits there, and clustered stops add fuel. The move is structural, driven by where orders rest, not a personal attack.
What is the difference between a wick and a real breakout?
A wick pierces a level then closes back inside, showing the move was absorbed. A real breakout closes beyond the level and holds, usually with follow through volume. Watch the close, not the extreme. The candle body tells you more than the tail about whether the level actually broke.
Can I predict where the next wick will happen?
No, and treat anyone who promises that with caution. You can map where liquidity tends to rest, such as range edges and the daily open, which are likely wick zones. That is a probability read, not a forecast. Knowing the where never tells you the when or the direction.
Why are wicks longer on altcoins than on Bitcoin?
Thinner order books. Fewer market makers quote small altcoins, so resting liquidity is sparse and gaps between orders are wide. A modest market order can travel far before it finds a fill, printing a long wick. The same order on BTC meets deep liquidity and barely moves price.
Crypto trading involves substantial risk and is not suitable for everyone. Nothing here is financial advice; it is education only. Never risk more than you can afford to lose.




Join the discussion 3
ok the absorption bit got me, i used to watch the book thin out on the 1m right before a wick and just stand there like a gom 👀 kicked myself after the one i didnt jump on 😅
the wick reading makes sense to me but i'd push back on the idea that its mostly thin books. in the flow data i track the long wicks usually line up with stablecoin balances moving between exchanges a few minutes earlier, so the liquidity story is only half of it. happy to be corrected if someone has the order book snapshots from that window.
lol so you want the snapshots but i'd say the stablecoin move is the thing to check first, since a few minutes of balances shifting before a wick could just be someone funding an account, not the book going thin, its hard to tell from flow alone