

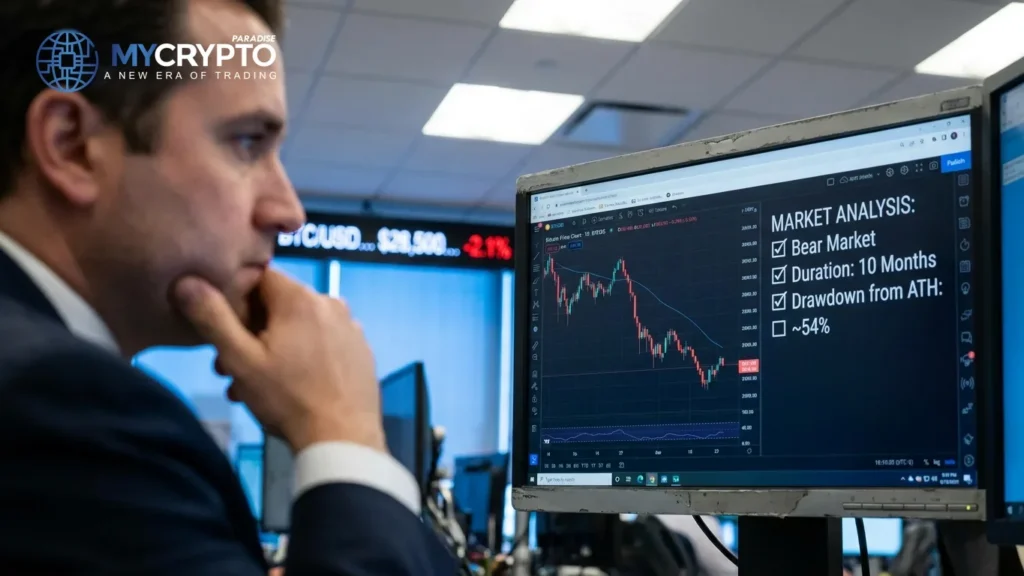
Update on this developing report (August 07, 2026, 18:34 UTC):
Our latest analysis clarifies that the circulating ‘Bitcoin bottom checklist’ narrative, which includes claims about bear market duration, drawdown from ATH, whale accumulation, and the 200-Day EMA, is not corroborated by direct evidence.
This update reinforces our previous observation that smart money is not confirming a bottom yet, instead patiently awaiting a pullback to the $61,000-$59,000 range for long entries or a potential short at $69,000.
Traders should be aware that while retail buying is aggressive into current resistance, the foundational claims driving this ‘bottom’ narrative lack our corroboration.
What to watch now: Smart money's reaction to current buying pressure, specifically whether resistance holds or if a pullback to $61-59k materializes for long entries.
Listen: the breakdown
Market briefing: A prevailing 'Bitcoin Bottom Checklist' narrative is fueling aggressive retail buying into current resistance. Meanwhile, smart money observes this pressure, patiently awaiting deeper pullbacks for long entries, with Bitcoin trading near $64,826 as of this report.
- A 'bottom checklist' narrative suggests Bitcoin's bear market is 10 months in with a ~54% drawdown from ATH.
- Whales have reportedly added 270K BTC in the last two weeks, yet the 200-Day EMA remains unreclaimed.
- Aggressive retail buying at $63,800 is being absorbed at current resistance, as smart money eyes $61-59k for deeper long entries.
A popular 'Bitcoin Bottom Checklist' is circulating, highlighting several metrics suggesting a market bottom is near. But is this narrative driving genuine accumulation or just feeding into existing resistance?
Bitcoin is currently trading near $64,826, experiencing negligible price movement over the last 24 hours (-0.1%). This stability occurs amidst a widely discussed 'Bitcoin Bottom Checklist' that points to several factors hinting at an imminent market turnaround.
The checklist notes that the bear market has persisted for 10 months. It also highlights a significant drawdown of approximately 54% from Bitcoin's All-Time High (ATH), a level often associated with previous market bottoms.
Adding to the perceived bullish signals, large holders, commonly referred to as whales, are reported to have accumulated a substantial 270,000 BTC over the past two weeks. This accumulation typically suggests conviction from sophisticated market participants.
However, one critical technical hurdle, the 200-Day Exponential Moving Average (EMA), has not yet been reclaimed. This technical indicator is a key benchmark for sustained bullish momentum, and its absence leaves room for caution among seasoned traders. This confluence of factors has created a distinct market dynamic: a powerful retail narrative meets a patient smart money approach. The current price action reflects this tension, with buying pressure meeting an equally strong absorption mechanism.
Why Retail's Checklist Fuels Price Absorption
The 'Bitcoin Bottom Checklist' narrative is a classic example of how perceived bullish signals can generate significant retail interest. It creates a sense of urgency, encouraging individuals to 'buy the dip' before a perceived breakout. This aggressive buying, however, is occurring directly into established resistance levels. When retail volume floods into resistance, smart money does not necessarily capitulate or join the buying spree at elevated prices.
Instead, these larger players often use such moments to absorb liquidity. They patiently offload positions or set up for deeper long entries, capitalizing on the predictable behavior of less experienced traders.
The current market scenario is characterized by a liquidity battle. Retail traders are aggressively pushing buy orders, especially with leverage, based on the bottom checklist narrative. This provides ideal conditions for smart money to observe whether this pressure is genuinely accepted or simply being absorbed.
Therefore, the checklist, while seemingly bullish, contributes to a consolidation phase. It allows smart money to manage their positions strategically without driving prices significantly higher, maintaining a cautious stance despite the prevailing retail optimism.
How Retail Buying Shapes Liquidity
The aggressive retail buying fueled by the 'bottom checklist' directly impacts market liquidity, particularly around key resistance zones. As retail traders 'smash the buy button' and open leveraged futures positions, they inject significant liquidity into the market. This influx of liquidity at current price levels, especially around $63,800 where aggressive Cumulative Volume Delta (CVD) began, and from $62,800 with Open Interest (OI) increases, creates a crucial test for acceptance. Smart money is not immediately accepting these higher prices for their long entries.
For Bitcoin, this dynamic means current buying pressure is being absorbed rather than leading to an immediate breakout. The price action around $64,826, showing minimal 24-hour movement, indicates that resistance is holding firm, and supply is meeting demand without a clear directional shift. This absorption in Bitcoin's price tends to cap upward momentum for Ethereum (ETH) and altcoins. When BTC struggles to clear resistance, capital often remains hesitant to flow aggressively into riskier assets.
Consequently, ETH and other altcoins may see their own rallies stall or even experience slight pullbacks. This is a characteristic smart money move, allowing them to accumulate at more favorable prices across the board if a deeper Bitcoin pullback materializes.
Watching for Confirmation or Invalidation
The immediate focus for confirmation or invalidation lies in how Bitcoin reacts to current resistance and whether the buying pressure is ultimately accepted. Continued absorption could lead to a deeper pullback.
Traders should closely monitor the $61,000-$59,000 zone. This area is a critical long entry zone for smart money, representing a secondary wave target. A strong bounce from this level would confirm smart money's accumulation strategy.
Conversely, a failure to hold the $62,500 level, which represents the low of the E-wave, would be a significant invalidation. A break below this level could signal further downside, potentially challenging even deeper support.
Another key indicator is the Daily MACD (Moving Average Convergence Divergence). While a bearish divergence currently exists (price higher highs, MACD lower highs), a potential bullish divergence (price higher low, MACD lower low) is 75% confirmed. A confirmed Daily MACD cross could signal a shift in momentum.
Ultimately, the question remains whether the aggressive buying pressure at current resistance is absorbed or accepted. Acceptance would mean a clear breakout above current levels, while continued absorption points to a necessary pullback before a sustained move higher.
Decoding Absorption Through Our Lens
The ParadiseTeam views the current market action through the lens of retail euphoria meeting strategic smart money patience. While the 'bottom checklist' narrative fuels aggressive retail buying, particularly at $63,800 where Cumulative Volume Delta (CVD) surged, and with futures Open Interest (OI) increasing from $62,800, this pressure is being absorbed.
Our bias remains bullish on the daily structure towards $79,000, which is our C-wave target and strong resistance. However, the immediate opportunity for long entries for smart money lies in a pullback to the $61,000-$59,000 zone, a critical secondary wave target. This is where market makers are expected to begin buying more aggressively.
The current price consolidation around $64,826 suggests that smart money is not yet willing to commit to higher prices for long entries. Instead, they are patiently observing whether this retail-driven buying can sustain itself or if it will inevitably lead to a liquidity vacuum and a subsequent dip.
Should Bitcoin push higher, the $69,000 level presents a potential ending diagonal target and a shorting opportunity for tactical traders. This aligns with the daily MACD currently showing bearish divergence, indicating slowing momentum even as price attempts higher highs.
We are watching for confirmation of the secondary wave pullback and a clear signal from the $61,000-$59,000 zone. A clean reclaim of $62,500 after a dip would be a strong indication that smart money has successfully re-accumulated for the next leg up towards $79,000.
Track it live: our live crypto funding rates and the Crypto Fear and Greed Index both update in real time, so you can watch this shift for yourself.
Related coverage
For exact entries, targets, and stop losses with full risk management, that is what ParadiseFamilyVIP is for. New to reading these moves? Start with our crypto trading strategies guide.
ParadiseTeam is monitoring the market situation closely, and we are taking these developments into consideration while building our trading tactics inside ParadiseFamilyVIP.
Crypto trading involves substantial risk. Prices are volatile and you can lose money. This article is educational and is not financial advice. Past performance does not guarantee future results.
Will Bitcoin's current buying pressure be accepted or absorbed?
This is how the Paradisers are calling it. Tap your call.
No calls on this one yet. Tap yours to be the first.
Free account, no password. Members just sign in.














Join the discussion
No comments yet. Members, share how you are reading this.