


Listen: the breakdown
Developing story update (September 02, 2026, 21:51 UTC):
Our latest check confirms total 24-hour liquidations stand at $367.0M, alongside a total Open Interest of $53.29B across the market. These figures provide concrete data points for the market’s current state.
This significant open interest and daily liquidation volume further align with our existing bearish thesis. It indicates a market ripe for potential cascading liquidations, especially if key support levels are breached, reinforcing the view that current strength may be a distribution phase.
What to watch now: Monitor for price action around key support levels, as significant open interest and liquidations suggest potential for cascading moves.
Developing story update (September 02, 2026, 21:28 UTC):
Our latest data shows Bitcoin’s 24-hour trading volume at approximately $29.8 billion USD, with Ethereum’s 24-hour volume recorded at around $15.6 billion USD and $13.3 billion USD from different sources. Both BTC and ETH have also experienced minor 1-hour price changes of 0.2%.
Despite these incremental data points, our core analysis holds. The market continues to exhibit characteristics of a distribution phase, with smart money likely absorbing retail buying pressure as BTC approaches previous resistance levels.
The ‘Greed’ sentiment persists, suggesting retail investors may be prematurely calling for a sustained bull run. We maintain our expectation for a potential market correction, driven by long liquidations, with a target of $44,000 for Bitcoin before aggressive accumulation by smart money.
What to watch now: Monitor for increased volatility and potential long liquidations as smart money continues to absorb retail buying pressure.
Developing story update (September 02, 2026, 20:02 UTC):
Our latest data shows total 24-hour liquidations across the crypto market have reached $367.0 million. This significant figure highlights ongoing volatility and potential for further market movements.
Based on our updated analysis, Bitcoin is facing key resistance at $79,000. We anticipate a potential downward move, with a target support level identified at $44,000, driven by smart money distribution and cascading liquidations.
What to watch now: Traders should monitor BTC's ability to reclaim $79,000 resistance and prepare for potential moves towards $44,000 support, driven by cascading liquidations.
Developing story update (September 02, 2026, 18:56 UTC):
Our latest data confirms the total crypto market capitalization remains at $2.6 trillion, with DeFi market cap at $114.53 billion and total 24-hour trading volume at $81.89 billion. Bitcoin’s 24-hour volume is approximately $29.8 billion, and Ethereum’s is between $13.3 billion and $15.6 billion.
The Fear & Greed Index holds steady at 63, indicating ‘Greed’. This sustained sentiment, coupled with the detailed volume data, reinforces our view of a potential distribution phase.
Traders should continue to watch for Bitcoin’s inability to reclaim the $79,000 resistance. Any minor price pumps in altcoins or Bitcoin should be considered temporary, potentially designed to attract more retail liquidity before an anticipated market correction.
What to watch now: Continue to monitor Bitcoin's ability to reclaim $79,000 and the potential for market maker-driven downside moves.
Developing story update (September 02, 2026, 18:14 UTC):
Our latest analysis, aligned with Simon’s lens, reinforces the view that the market is in a distribution phase, despite current strength. Retail investors continue to accumulate long positions, setting the stage for potential capitulation.
A key development is the identification of a specific downside target. Based on our sources, market makers are likely leveraging significant open interest and 24-hour liquidations to incentivize a flush towards Simon’s $44,000 support target for Bitcoin.
This indicates a deeper correction is still anticipated, with smart money preparing to re-accumulate at these lower levels, rather than a sustained rally from current prices.
What to watch now: Watch for market makers to incentivize a downside move towards the $44,000 support target, leveraging liquidation clusters.
Developing story update (September 02, 2026, 17:08 UTC):
Our latest check confirms $367.0 million in 24-hour liquidations, a significant figure that aligns with our ongoing thesis of smart money distribution. This volume indicates market makers are actively positioning for further downward pressure.
Despite persistent ‘Greed’ sentiment and high open interest, major crypto assets show slight downturns, suggesting current buying pressure is being absorbed. This reinforces our expectation of a potential flush to liquidate overleveraged long positions.
What to watch now: Traders should watch for further liquidation cascades, especially if key resistance levels continue to hold.
Developing story update (September 02, 2026, 15:42 UTC):
Our strategists have refined their outlook, now explicitly targeting a bearish flush for Bitcoin towards $44,000. This specific price level is identified as a key area for market makers to clear liquidation clusters.
This updated target reinforces our view that smart money continues to distribute positions, anticipating a capitulation event before aggressive accumulation at lower levels.
What to watch now: Watch for Bitcoin's reaction around key support levels as market makers target liquidation clusters towards $44,000.
Developing story: This story is still unfolding. We are tracking it and will update this article as more details are confirmed.
Market briefing: Bitcoin was near 76,740 and the Fear and Greed Index sat at 63, yet our read is that smart money is quietly selling into that optimism. Heavy open interest and crowded longs point to a flush, not a floor.
- BTC traded near $76,740, down 1.3% on the day, with ETH near $2,381 and SOL down 3.8%.
- Open interest sat around $53B while the Fear and Greed Index read Greed at 63.
- Our read: smart money is distributing into retail longs, with liquidation clusters below.
The smart money distribution story is hiding in plain sight: a Greed reading of 63, crowded longs, and quiet selling into strength. Who is really on the other side of your trade?
The numbers look calm on the surface. Bitcoin was trading near $76,740, down about 1.3% over 24 hours. Ethereum slipped 2.4% to roughly $2,381, and Solana fell almost 4%. Nothing here screams crisis. Yet the calm is exactly what deserves a second look.
There is no single confirmed catalyst behind these moves today. That matters, and we will be honest about it. What we can point to is structure, and structure is telling a quieter story than the price ticker.
The Fear and Greed Index read Greed at 63. Open interest across the market sat near $53B, a large stack of leverage riding on top of spot. Total market capitalization held around $2.6T while 24 hour liquidations ran near $367M. In plain terms, a lot of borrowed conviction is stacked into a market that barely moved.
That combination is our real subject. When sentiment reads Greed, retail tends to buy and to lever up, convinced the worst is over. Smart money rarely argues with a crowd in that mood. It simply sells into the enthusiasm, one clip at a time, while the tape looks orderly.
So the driver today is not a headline. It is a behaviour: distribution dressed up as a quiet, greedy market. The dips of the last day may be the first pages of that story rather than noise.
Leverage and greed sitting on thin ground
Greed is not a price. It is a positioning signal, and positioning is where risk hides. When the Fear and Greed Index prints 63 alongside roughly $53B in open interest, the market is not just optimistic. It is optimistic on borrowed money.
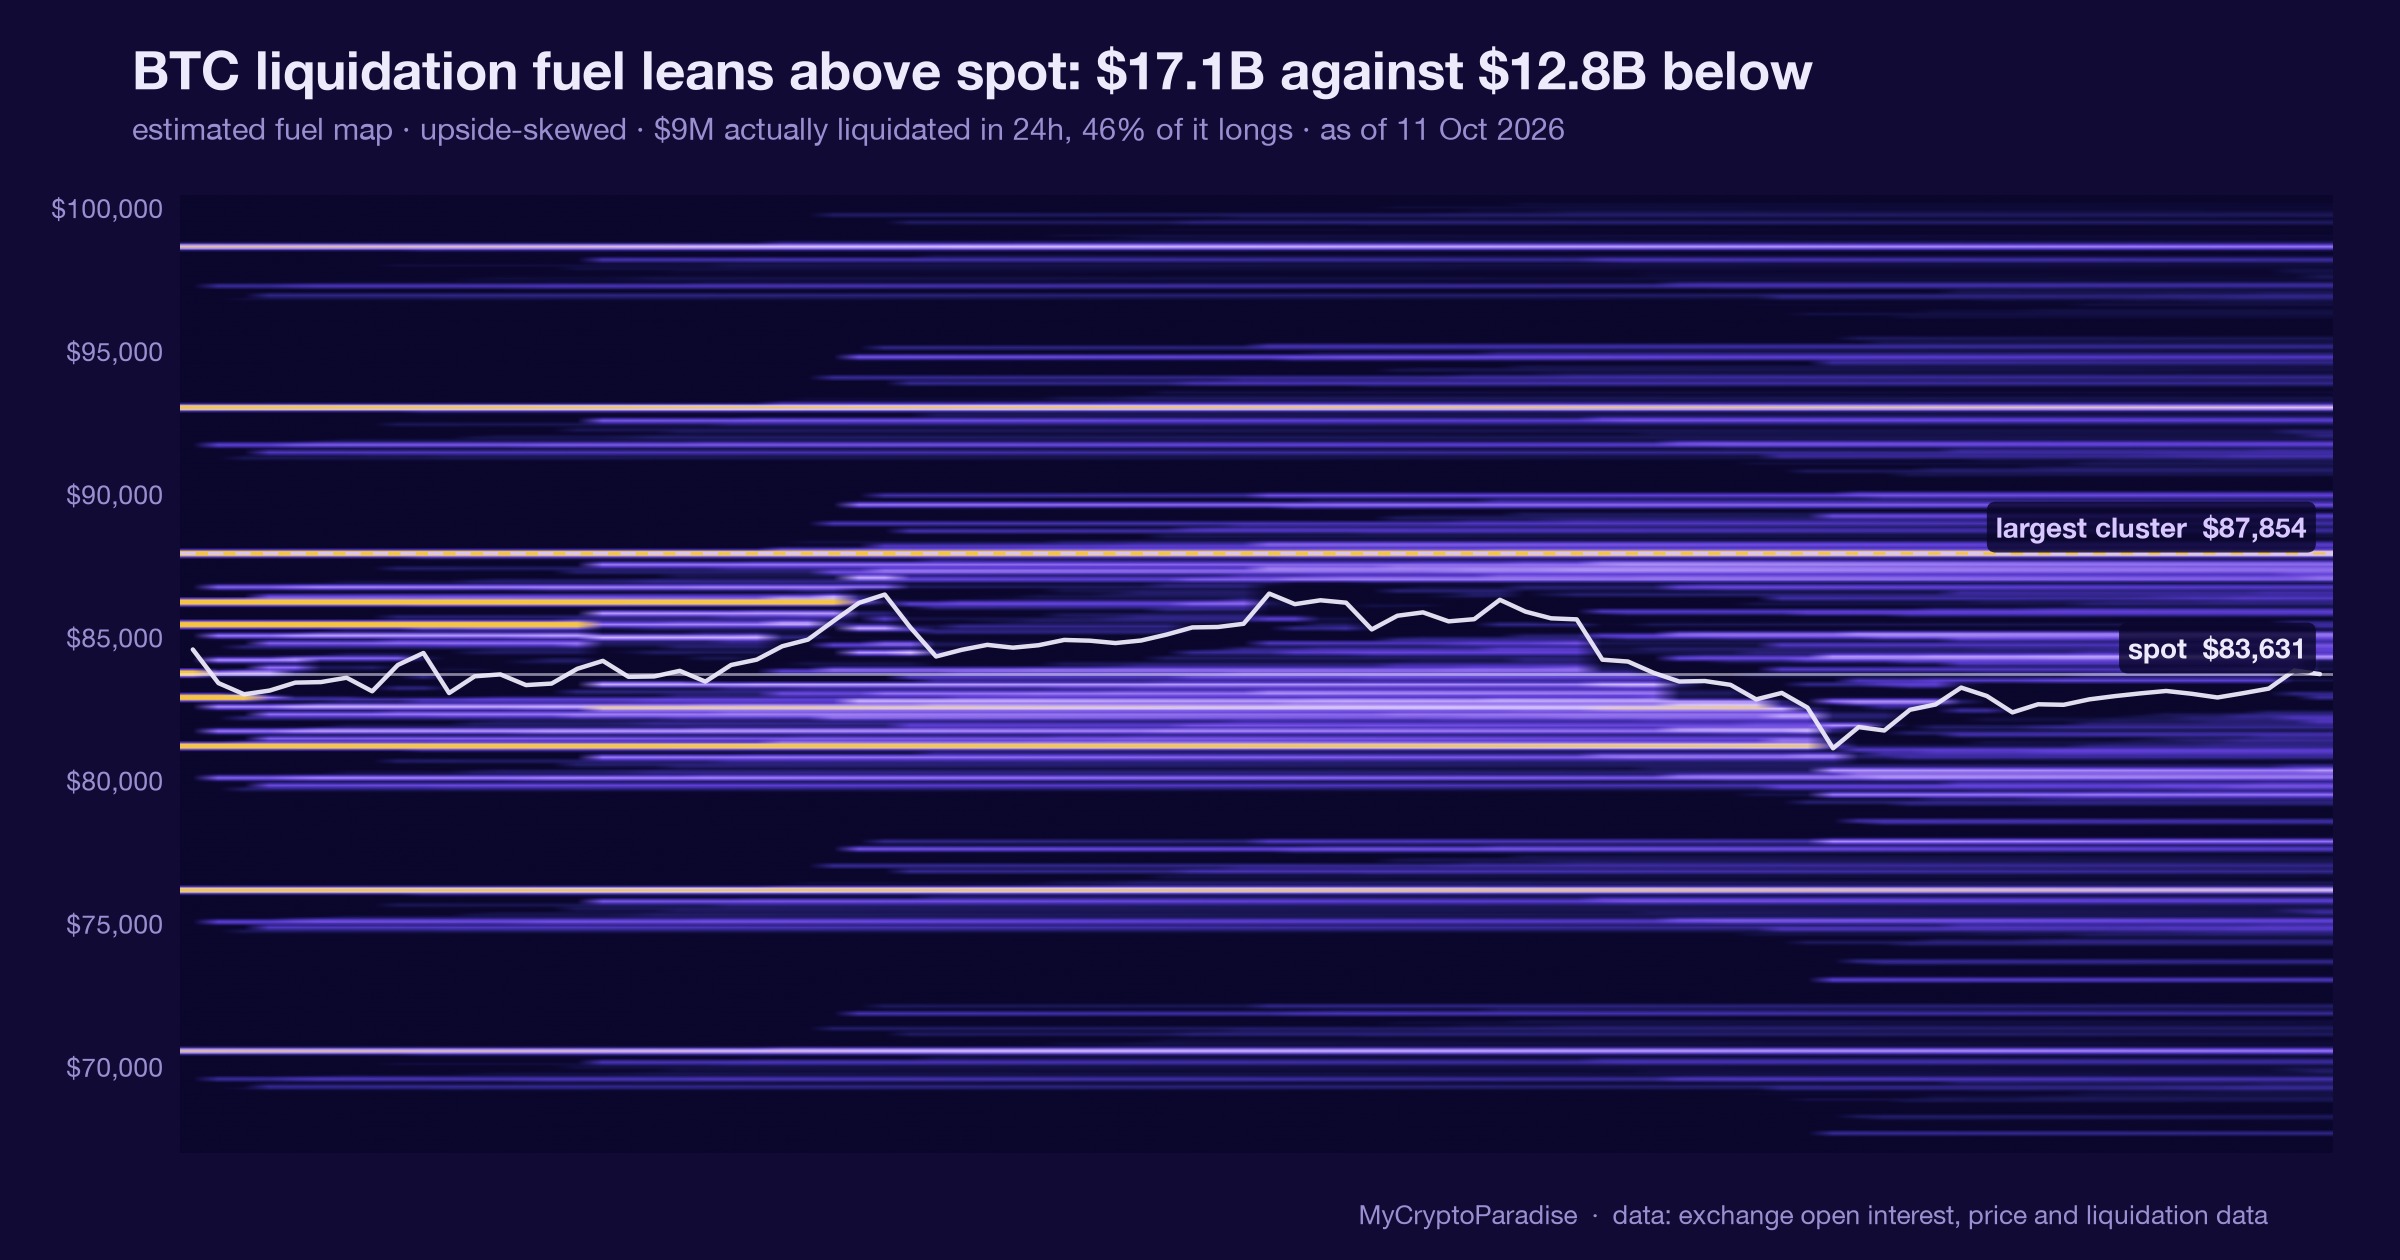
That is the macro transmission mechanism we care about. Leverage turns a modest price drop into a forced sale. Each cluster of long positions carries a liquidation level, and those levels act like magnets for price. Market makers know exactly where that fuel sits.
Retail supplies the fuel by piling into longs after a bounce, believing the trend has turned. Smart money supplies the patience. It absorbs that buying pressure, hands over coins near strength, and waits for the leverage to do the heavy lifting lower.
The honest caveat: with no single confirmed catalyst today, this is our interpretation of the structure, not a proven cause. We are reading behaviour, not quoting an event.
But the setup is familiar. A greedy crowd, heavy open interest, and a market that stalls rather than surges usually resolves the same way. The crowd that was sure the bottom was in becomes the seller of last resort. That is why a quiet, slightly red day matters more than a loud one. The damage in these regimes is done gradually, then all at once.
How a long flush travels down the board
Bitcoin is the first domino, so watch it first. At around $76,740 it sits below the $79,000 area that has capped every attempt to reclaim strength. A market that cannot take resistance while sentiment reads Greed is a market being sold, not accumulated.
If BTC leaks lower, the long liquidations begin to trigger. That forced selling feeds on itself, which is how a slow bleed becomes a fast one. The clusters below are the target, not an accident.
Ethereum tends to move second and harder. Down 2.4% while Bitcoin fell 1.3%, ETH is already showing higher beta to the downside. In a leverage flush, that gap usually widens, because ETH longs unwind faster once fear replaces greed.
Alts sit at the end of the chain, and they pay the largest bill. Solana down almost 4% on a quiet day is the tell. When liquidity thins and Bitcoin dominance rises, capital flees the long tail first.
The uncomfortable part is timing. Distribution can run for days while price looks fine, which lulls the crowd deeper into longs. Then a single push through a liquidation shelf cascades across BTC, ETH, and alts at once. The orderly tape is the disguise, not the safety.
The signals that confirm or kill the flush
The cleanest confirmation is simple: a decisive break and hold below $58,000. That level is our line between a normal pullback and the larger flush we are describing. Lose it, and the $57,000 long liquidation cluster comes into play fast.
Watch open interest alongside price. If price falls and open interest drops sharply together, that is longs being liquidated, the exact cascade this piece is about. Falling price on rising open interest instead would suggest fresh shorts, a different and less durable move.
The Fear and Greed Index is the second gauge. A quick flip from Greed toward Fear as price slides would confirm retail is capitulating rather than buying every dip. That shift is what smart money waits for.
Invalidation matters just as much, and we will respect it. A strong reclaim of $79,000, held on a daily close, would break the bearish structure. At that point the distribution read is wrong, and chasing it lower becomes the trap.
Until then, stalling under $79,000 keeps the pressure downward. The tell we least want to ignore is a calm market that refuses to rally on good sentiment. Strength that cannot lift price is usually strength being sold. Let the levels, not the mood, cast the deciding vote.
Reading this greed print through positioning
The ParadiseTeam reads today's tape as distribution, not accumulation. With BTC near $76,740 and repeatedly rejected under $79,000, price is failing exactly where sellers want it to fail. Greed at 63 is the crowd we would expect on the wrong side of that.
Our medium term structure still points lower. We see $58,000 as the trapdoor and the $57,000 long cluster as the first magnet beneath it. Below that, our working target for aggressive smart money accumulation sits far lower, near $44,000, after retail capitulates.
The mechanism is positioning, not prophecy. Heavy open interest plus crowded longs plus a stalled price hands market makers a clear incentive to hunt stops downward. Retail is supplying the liquidity by buying strength; smart money is the patient seller on the other side. That is why we treat this greedy calm with caution rather than comfort. Probabilities, not certainty: the setup favours downside continuation while $79,000 caps price.
The read flips only on evidence. A daily close back above $79,000 would tell us smart money is defending, not distributing, and we would drop the bearish bias. Absent that, we let others call the bottom while the leverage above works itself off. Manage risk first: size for the flush you can survive, not the bounce you hope for.
The read behind this: we framed this story through our own market analysis, Bitcoin Fails at $79K: Who Is Selling?
Track it live: our Crypto Fear and Greed Index and the live crypto funding rates both update in real time, so you can watch this shift for yourself.
Related coverage
For exact entries, targets, and stop losses with full risk management, that is what ParadiseFamilyVIP is for. New to reading these moves? Start with our crypto trading strategies guide.
ParadiseTeam is monitoring the market situation closely, and we are taking these developments into consideration while building our trading tactics inside ParadiseFamilyVIP.
Crypto trading involves substantial risk. Prices are volatile and you can lose money. This article is educational and is not financial advice. Past performance does not guarantee future results.
Where does BTC go next from the $76.7K area?
This is how 16 Paradisers are calling it. Tap your call.
No calls on this one yet. Tap yours to be the first.
Free account, no password. Members just sign in.












Join the discussion 8
Man, I remember being SO sure I was the smart money buying into that pump last year 🤦♀️. My chart was saying something else but my gut... 💸🙄. Not again! 🙅♀️
whats the one level that actually matters here everything else is just noise
i disagree about smart money selling here the stablecoin flows suggest new money is entering exchanges not exiting.
The interpretation of stablecoin inflows can be dependent on the specific exchange-type selected for analysis. For some of these flows, it might also be relevant to consider the exchange's specific share of open interest.
this reminds me of when i started tracking rebar orders ahead of a new project, the initial excitement of demand can hide future delays.
...watching this divergence between the Greed Index and actual flow is always key. Rule number 4: "Never trade solely on sentiment." My books always tell the story...
Trying to outsmart the market like this is a dangerous game. It is much better to just keep building slowly.
i always think of the old engines... you can see a problem coming if you check the gauges, not just what it "feels" like. thanks for the look under the hood.