

In short
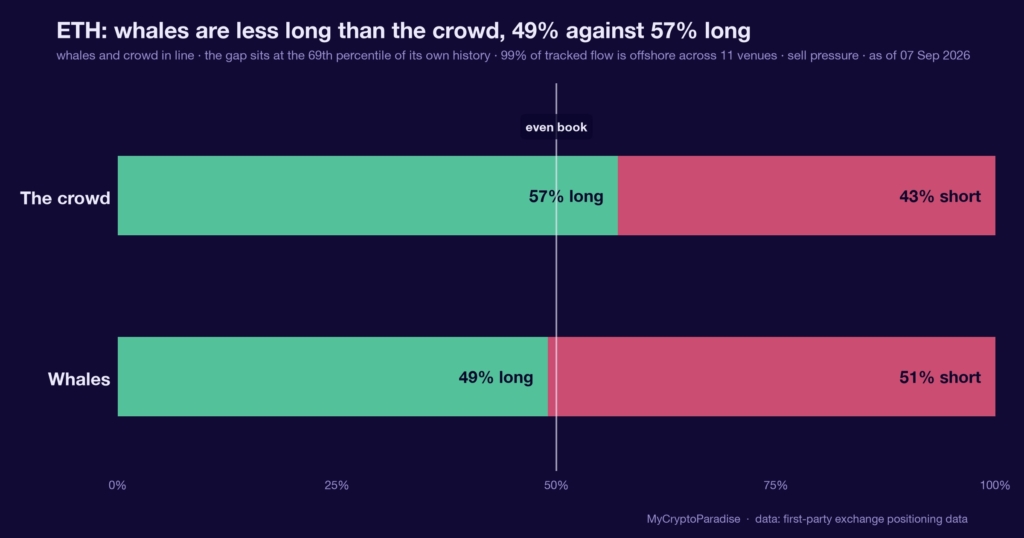
Whale flow, here the Top 10 outflows, tracks the largest withdrawals leaving one exchange, a rough proxy for coins moving into accumulation. On 6 September 2026 a third-party flow feed reported FET’s Top 10 Binance outflows averaging 52,360 tokens a day over the past month, a 2026 high, with several days above 200,000 and price already up 45 percent. We called this neutral, explicitly not a buy: our own tools do not measure FET, so we cannot verify one figure of it. What we can measure, our MCP Insights positioning data, shows the liquid alt crowd 57 percent long on Ether and paying an annualised 5.09 percent to hold, with sellers currently the aggressors. A read that leans on numbers it cannot check is an anecdote with a chart, not evidence. This piece shows you how to read exchange whale flow yourself, and where it stops deserving your trust.
Key facts
- Whale long share on ETH
- 49%
- Crowd long share on ETH
- 57%
- Where that gap sits in its own history
- the 69th percentile
- Positioning read
- whales and crowd in line
- Order flow right now
- sell pressure
- What would prove this read wrong
- Our own spot absorption on Ether and the broader alts turning to net buyers while funding cools out of its crowded long (currently 5.09 percent annualised, crowd 57 percent long), which would let a borrowed flow claim show up in a metric we actually measure.
- Reading taken
- 07 September 2026
- Source
- Our MCP Insights tools, from first-party exchange positioning data (OKX). Upstream data published by the OKX public API
Exchange outflows are a claim, not a receipt
Whale flow describes coins moving in size between wallets and exchanges. When the largest withdrawals from a venue grow, the standard reading is accumulation: someone is pulling supply off the order book and into custody, where it cannot be sold on impulse.
That reading is reasonable and it is also unproven. An outflow is a transfer, not a purchase. The same tokens can move to a cold wallet, a staking contract, an over-the-counter settlement or another exchange, and not all of those are the bullish story the label implies.
A flow number is only as good as the tool that measured it. When the tool is not yours, the honest posture is to treat the figure as a claim to be checked, not a fact to be traded.
What the feed says, and what we can stand behind
The dated event is a third-party flow reading logged on 6 September 2026. It reports FET’s Top 10 Binance outflows averaging 52,360 tokens a day over the past month, a 2026 high, with several sessions clearing 200,000 and the Top 10 average now near 91,000.
Price had risen 45 percent into that flow, off a 96 percent drawdown. The same feed frames it against a broad alt recovery: the altcoin capitalisation excluding the majors up from roughly 650 to 780 billion dollars in two months, back at its May high.
We did not measure any of that, so we report it as the feed’s. What our own MCP Insights positioning data does measure is Ether, not FET: the crowd sits 57 percent long, whales 49 percent, the spread in its 69th percentile, and longs pay an annualised 5.09 percent while sellers press.
A figure you verified is worth more than a figure you borrowed.
What is different here
The ParadiseTeam does not trade a flow number it did not compute. When a figure comes from a feed we cannot audit, we label it borrowed, check it against the positioning we do measure ourselves, and size only the part that our own instruments confirm. Provenance is a risk input, not a footnote.
The obvious trade is the one to distrust
The tempting read is mechanical: large holders are buying, so follow them. It ignores that the move you are joining is already 45 percent old, and that the people who supposedly accumulated did so lower, before the run you would be chasing.
Following flow late is how you end up as the exit. The same whales the label celebrates are the ones with size to distribute into exactly the enthusiasm a 2026-high outflow headline creates.
Flow that is bullish for the accumulator is not automatically bullish for the person who reads about it a month later.
One reading among the ones we can price
Set against what we do measure, the flow claim gets no confirmation and one caution. Ether, the most liquid alt we track, has the crowd 57 percent long and paying to hold: an annualised 5.09 percent funding rate means the majority is renting its position from the minority.
This is one input, and a borrowed one. It sits alongside funding, the long-short balance and spot absorption, and on 7 September those three, which are ours, say the liquid part of the alt market is crowded long, not freshly accumulated. That is the layer we can actually price; the rest lives in PRO Paradiser.
A metric you cannot audit does not become evidence by being interesting. It becomes a hypothesis, and the honest place for a hypothesis is beside the numbers you can check.
What would make this worth trading
The claim becomes ours to act on the moment it shows up in something we measure. That is not the outflow count: it is spot absorption turning to buyers on Ether and the broader alts, funding cooling out of its crowded long, and the premium tilting toward genuine accumulation rather than distribution into strength.
Until then the recovery in the altcoin capitalisation, up toward its May high, is context, not a trigger. A tape that has already run 45 percent needs the next buyer to be the crowd that is currently long, and that crowd is paying, not being paid.
The setup that rewards patience is the one where your own instruments confirm the story you were told. Everything before that is a reason to watch, not a reason to size.
Reading exchange whale flow yourself, step by step
- Start with the metric’s own definition: an exchange outflow is a transfer of custody, not a confirmed purchase of the token.
- Ask who measured it: if the figure is not from a tool you control, treat it as a claim to verify.
- Check the price context: a flow that arrives after a large run is a different trade from one that leads it.
- Cross-read it against positioning you can measure: funding, the long-short balance and spot absorption on the liquid names.
- Size only the overlap: act on the part two independent instruments agree on, and watch the rest.
The skipped step is the second one: most readers never ask whose tool produced the number, so they trade a stranger’s measurement as if it were their own.
Every number above is checkable against the live data. Start with the MCP Insights hub, then cross-read the Crypto Fear and Greed Index and the live crypto funding rates.
Act and invalidate
| Scenario | What confirms it | What kills it |
|---|---|---|
| Borrowed flow proves real | Our absorption turns to buyers | Funding stays crowded long |
| Late chase into the run | Price extends on cooling funding | Sellers keep pressing spot |
| No trade, just watch | Instruments still disagree | Both align, either direction |
Posture: defensive and patient: no exposure taken on a number we cannot audit, and none added on Ether while the crowd is long and paying. The overlap between the feed and our own instruments is empty today, which is itself the position.
Frequently asked questions
What are FET Top 10 exchange outflows?
They are the sum of the ten largest FET withdrawals leaving a single exchange over a period. A rising figure is usually read as accumulation, though an outflow only proves custody moved, not that anyone bought the token.
Why not just follow the whales?
Because the move was already up 45 percent when the outflows peaked, so following late can place you where the early accumulators distribute. Copying flow works only when you join near the accumulation, not a month into the run it produced.
Can you verify the FET numbers?
No, and we say so plainly. Our MCP Insights tools measure Ether and Bitcoin positioning, not FET flow, so every FET figure here belongs to the third-party feed that produced it. We report it as a claim, not as our own measurement.
What does our own data show?
On 7 September our positioning read has the Ether crowd 57 percent long and paying an annualised 5.09 percent funding rate, with sellers currently the aggressors. That describes a liquid alt market leaning long, which is caution, not confirmation, for a fresh FET chase.
When would this flow become tradable?
When it shows up in something we measure: spot absorption on the alts turning to buyers, funding cooling out of its crowded long, and the premium tilting toward accumulation. Until two independent instruments agree, the highest-probability posture for most is no trade.
Crypto trading involves substantial risk and is not suitable for everyone. Nothing here is financial advice; it is education only. Never risk more than you can afford to lose.
The private Extras feed, where exchange whale flow, Ether positioning and funding, and spot absorption update with their invalidation levels attached, is part of PRO Paradiser, the intelligence layer behind the ParadiseFamilyVIP strategies.










Join the discussion 1
Even if the whale flow number is right, it's never about one gauge alone... but if everyone is long, who's left to buy? That's always the worry...