


Listen: the breakdown
Market briefing: ETH's liquidation map is lopsided: roughly $6.5 billion in shorts above $2,650 against $926 million in longs below $2,050, a 7x upside imbalance. BTC traded near $80,429 as the clusters came into focus.
- $6.51 billion in ETH shorts sit exposed above $2,650
- $926.53 million in longs would liquidate below $2,050
- 7x more upside fuel, yet the tape is barely moving
ETH's liquidation map now leans hard to one side, with far more shorts trapped above price than longs below it. Does that make a squeeze highly probable, or a trap?
The numbers behind ETH right now tell a lopsided story. Roughly $6.51 billion in short positions sit exposed above $2,650. Below price, only $926.53 million in longs would fall if ETH breaks $2,050. That is seven times more fuel on the upside than the downside.
ETH traded near $2,331.25 as the clusters came into focus, up 0.32% on the day and 0.29% on the hour. In other words, almost nothing is moving. The map is loud; the tape is quiet.
That gap matters. Large liquidation clusters are not predictions. They are maps of where forced buying or forced selling waits. When shorts get liquidated, the exchange buys to close them, which can shove price higher fast. A $6.5 billion wall of that pressure above $2,650 is the kind of thing that makes a short squeeze narrative spread quickly.
And it has spread. The inevitable short squeeze framing is already doing the rounds, because 7x upside liquidity reads like a one-way bet.
We would gently remind everyone that nothing involving leverage is ever inevitable.
Here is the honest part. No single confirmed catalyst explains today's setup. This is a forward-looking read of positioning, not a trigger that has fired. The clusters are real and the imbalance is real, but the squeeze itself has not started.
Clusters become a market maker roadmap
Liquidation clusters are macro signals in a thin market. When trading activity drops, it takes less capital to move price. Market makers know exactly where these pools sit. So the clusters become a roadmap, not a forecast.
The transmission runs through forced flow. A liquidated position is not a voluntary trade; it is the exchange closing you out at market. A $6.5 billion short pool above $2,650 means billions of mechanical buying waiting to trigger if price gets there. That buying feeds on itself, because each liquidation pushes price into the next cluster.
The same logic cuts down. The $926.53 million in longs below $2,050 is a smaller pool, but in a thin market even that can cascade. The point is the imbalance. Seven times more upside fuel tilts the reflexive mechanics toward a squeeze, not a flush.
This is why thin liquidity matters more than most traders admit. Depth is the shock absorber. Remove it, and an order that barely moved price in a busy market can walk it straight into a liquidation shelf. That is the backdrop for ETH right now.
A 7x imbalance tilts ETH upside
If ETH runs the $2,650 shelf, the move does not stay contained to ETH. BTC sets the risk tone for the whole market, and it was trading near $80,429 as of 09:29 UTC, up 0.4% on the day. A sharp ETH squeeze tends to pull BTC's volatility higher and drag sentiment with it.
The sequence usually runs in order. ETH shorts get squeezed first, because that is where the fuel sits. BTC then catches a bid as traders rotate into the obvious strength. Alts move last and hardest, since they carry the thinnest books and the most trapped leverage.
That is the bullish mechanical case, and on the story's own facts it holds. A 7x liquidity imbalance is a real asymmetry. Open interest (OI) stacked on the short side is a real source of forced buyers.
But mechanics are not timing. A cluster can sit untouched for days. The $6.5 billion only becomes buying if price actually reaches $2,650, and today ETH sits more than 13% below it. Nothing says the market obliges on schedule.
For alts, the read is simple. A genuine ETH squeeze lifts the whole high-beta complex. No ETH move, no alt move.
Levels that confirm or kill the squeeze
The $2,650 shelf is the line that confirms the bullish case. A clean break above it, with OI falling as price rises, is the signature of shorts actually being closed. Higher price on shrinking short interest is the squeeze doing real work, not fresh longs piling in.
The opposite tell is just as useful. If ETH grinds toward $2,650 but OI climbs instead of falling, that is new leverage chasing, not shorts capitulating. That version usually ends with the late longs becoming the next cluster.
Invalidation sits at $2,050. Lose it and the $926.53 million long pool becomes the forced seller, flipping the setup from squeeze to flush. The smaller pool does not mean a small move in a thin market.
Volume is the deciding vote. A squeeze needs participation, and right now trading activity is near the lows. A break on thin volume fades; a break on real volume holds. Watch whether anyone actually shows up.
The quiet tape is the warning. ETH barely moved today, which tells you this is positioning, not momentum. Until the tape confirms, the map is just a map.
What $6.5B in trapped shorts means
The ParadiseTeam sees the ETH liquidation map as a mirror of conditions across the board. Low liquidity lets market makers push price into levels cheaply, and that cuts both ways. The same thin tape that could fuel a short squeeze also lets bigger players fade it once retail piles in.
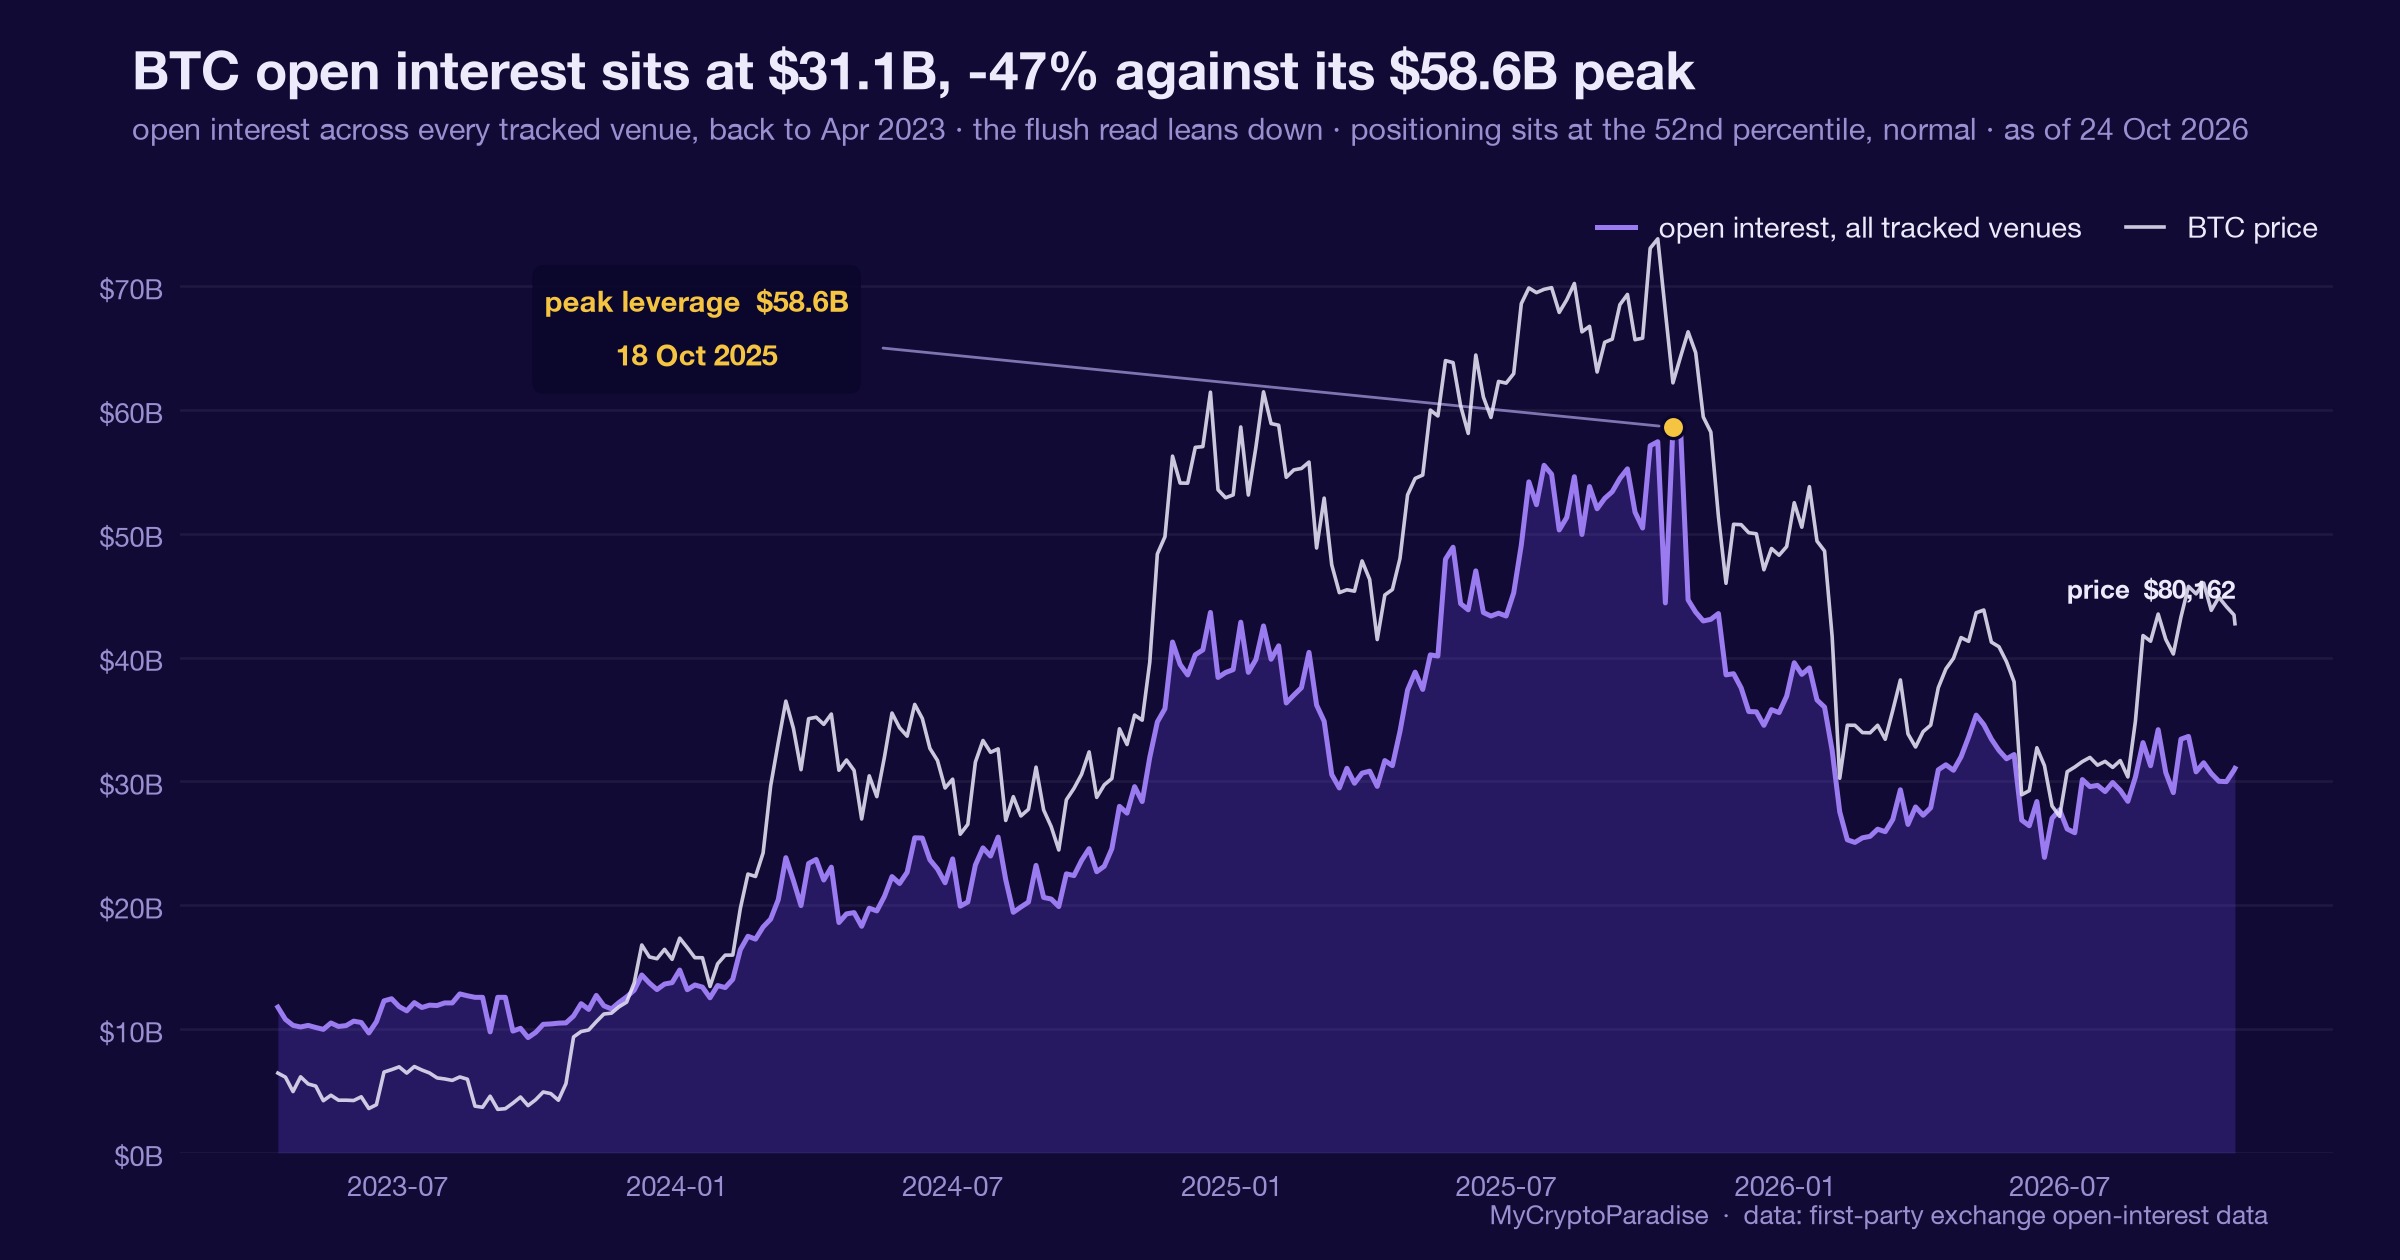
That is the trap inside the inevitable squeeze story. When everyone sees 7x upside fuel, the obvious trade gets crowded. We are already watching funding flip positive on BTC without price following, a sign that longs are crowded and sentiment is chasing. The same crowd behaviour tends to show up in ETH.
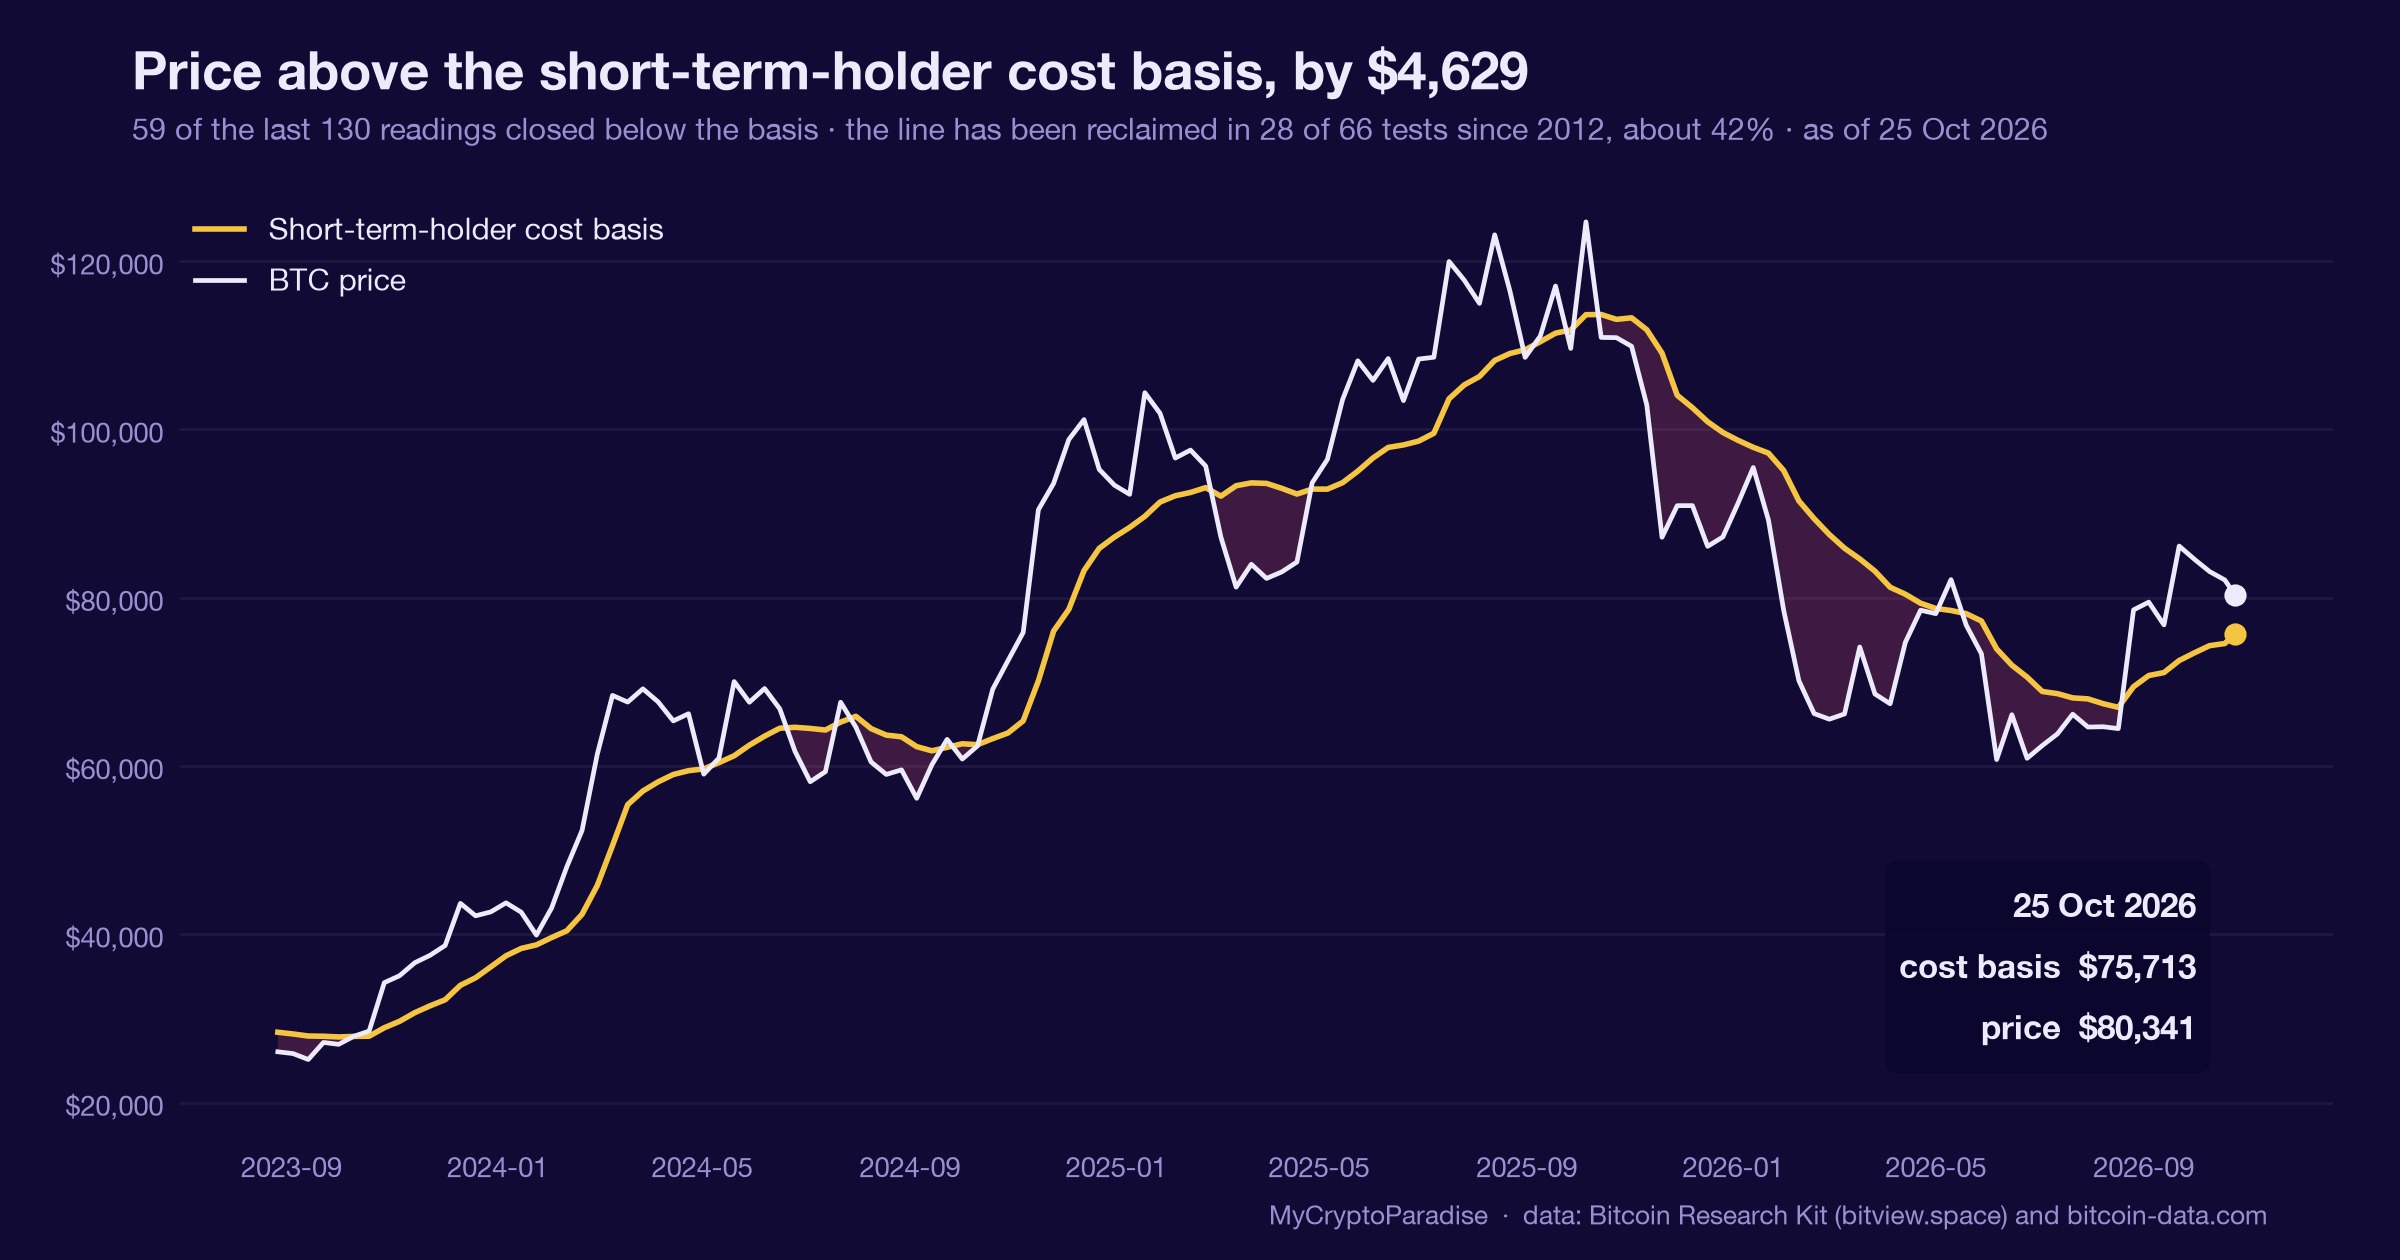
Our standing read on BTC frames it. With BTC near $80,429 and $81,000 support lost rather than defended, the broader structure is fragile. A final push toward $90,000 stays possible, but $79,000 is the invalidation; lose it and the bullish case breaks.
So we treat the ETH shelf as a real asymmetry and a real target at once. $2,650 is where shorts hurt. $2,050 is where longs break. Smart money reads both as liquidity, not as destiny.
Patience beats prediction here. We want price and open interest to confirm the squeeze, not a narrative. Until then, the quiet tape keeps us honest.
The read behind this: we framed this story through our own market analysis, Bitcoin at Support: Can Bulls Fight Back?
Track it live: our live crypto funding rates and the crypto liquidation heatmap both update in real time, so you can watch this shift for yourself.
Related coverage
For exact entries, targets, and stop losses with full risk management, that is what ParadiseFamilyVIP is for. New to reading these moves? Start with our crypto trading strategies guide.
ParadiseTeam is monitoring the market situation closely, and we are taking these developments into consideration while building our trading tactics inside ParadiseFamilyVIP.
Crypto trading involves substantial risk. Prices are volatile and you can lose money. This article is educational and is not financial advice. Past performance does not guarantee future results.
Which ETH liquidation wall breaks first from here?
This is how 1 Paradiser is calling it. Tap your call.
No calls on this one yet. Tap yours to be the first.
Free account, no password. Members just sign in.
Follow this topic: Crypto liquidation news








Join the discussion
No comments yet. Members, share how you are reading this.