

In short
A liquidation is a forced exit: an exchange closes a leveraged position that can no longer meet its margin. The forced-liquidation tape is the running total of those closes, split into longs sold out and shorts bought back. On 21 November 2026 our MCP Insights liquidation data showed $149.4M of BTC forced out over 24 hours across OKX, HTX, Gate, Kraken and dYdX. Sixty-one percent of it was short sellers: roughly $90.4M of shorts bought back at a loss against $59.0M of longs. We read that as a constructive lean, with the standing estimated fuel map still stacked above spot at 10.2 to 1; we called it a lean, explicitly not a buy. The series carries a model-estimate flag, so we quote no historical frequency and size the lean as one line of risk. This piece shows you how to read the forced tape yourself, step by step.
Key facts
- BTC spot at the reading
- $60,372
- Estimated BTC liquidation fuel above spot
- $18.42B
- Estimated BTC liquidation fuel below spot
- $1.81B
- Fuel balance
- upside-skewed, +82 points toward the heavier side
- What would prove this read wrong
- A daily close that drags the heavier estimated fuel pocket below spot, or the 24-hour forced tape turning majority long.
- Reading taken
- 21 November 2026
- Source
- Our MCP Insights tools, from exchange data
Forced exits are not opinions
A liquidation is not a trade someone chose to make. It is an exchange closing a leveraged position that can no longer meet its margin, buying or selling at the market regardless of price. That mechanical, price-insensitive flow is why liquidations matter more than ordinary volume.
The direction of the forced flow is the whole tell. When a short position is liquidated, the exchange must buy to close it, which adds upward pressure. When a long is liquidated, the exchange sells, which adds downward pressure.
So the split between long and short liquidations is not trivia. It is the difference between forced buyers and forced sellers, and reading only the headline total throws that away.
The tape ran short on 21 November
Our MCP Insights liquidation data for 21 November 2026 shows $149.4M of BTC positions forced out over the prior 24 hours, across OKX, HTX, Gate, Kraken and dYdX. Of that, 61 percent was short: about $90.4M of shorts bought back against $59.0M of longs.
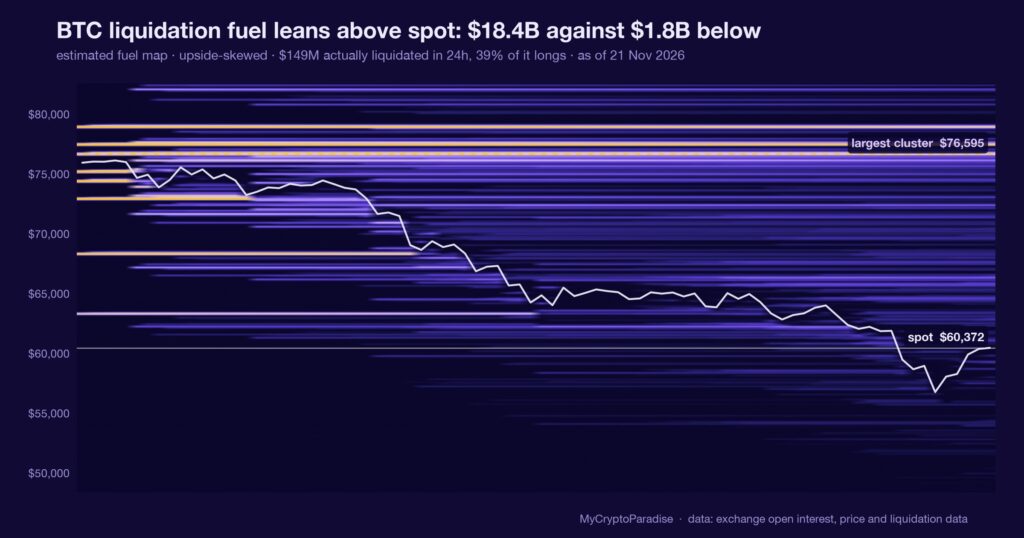
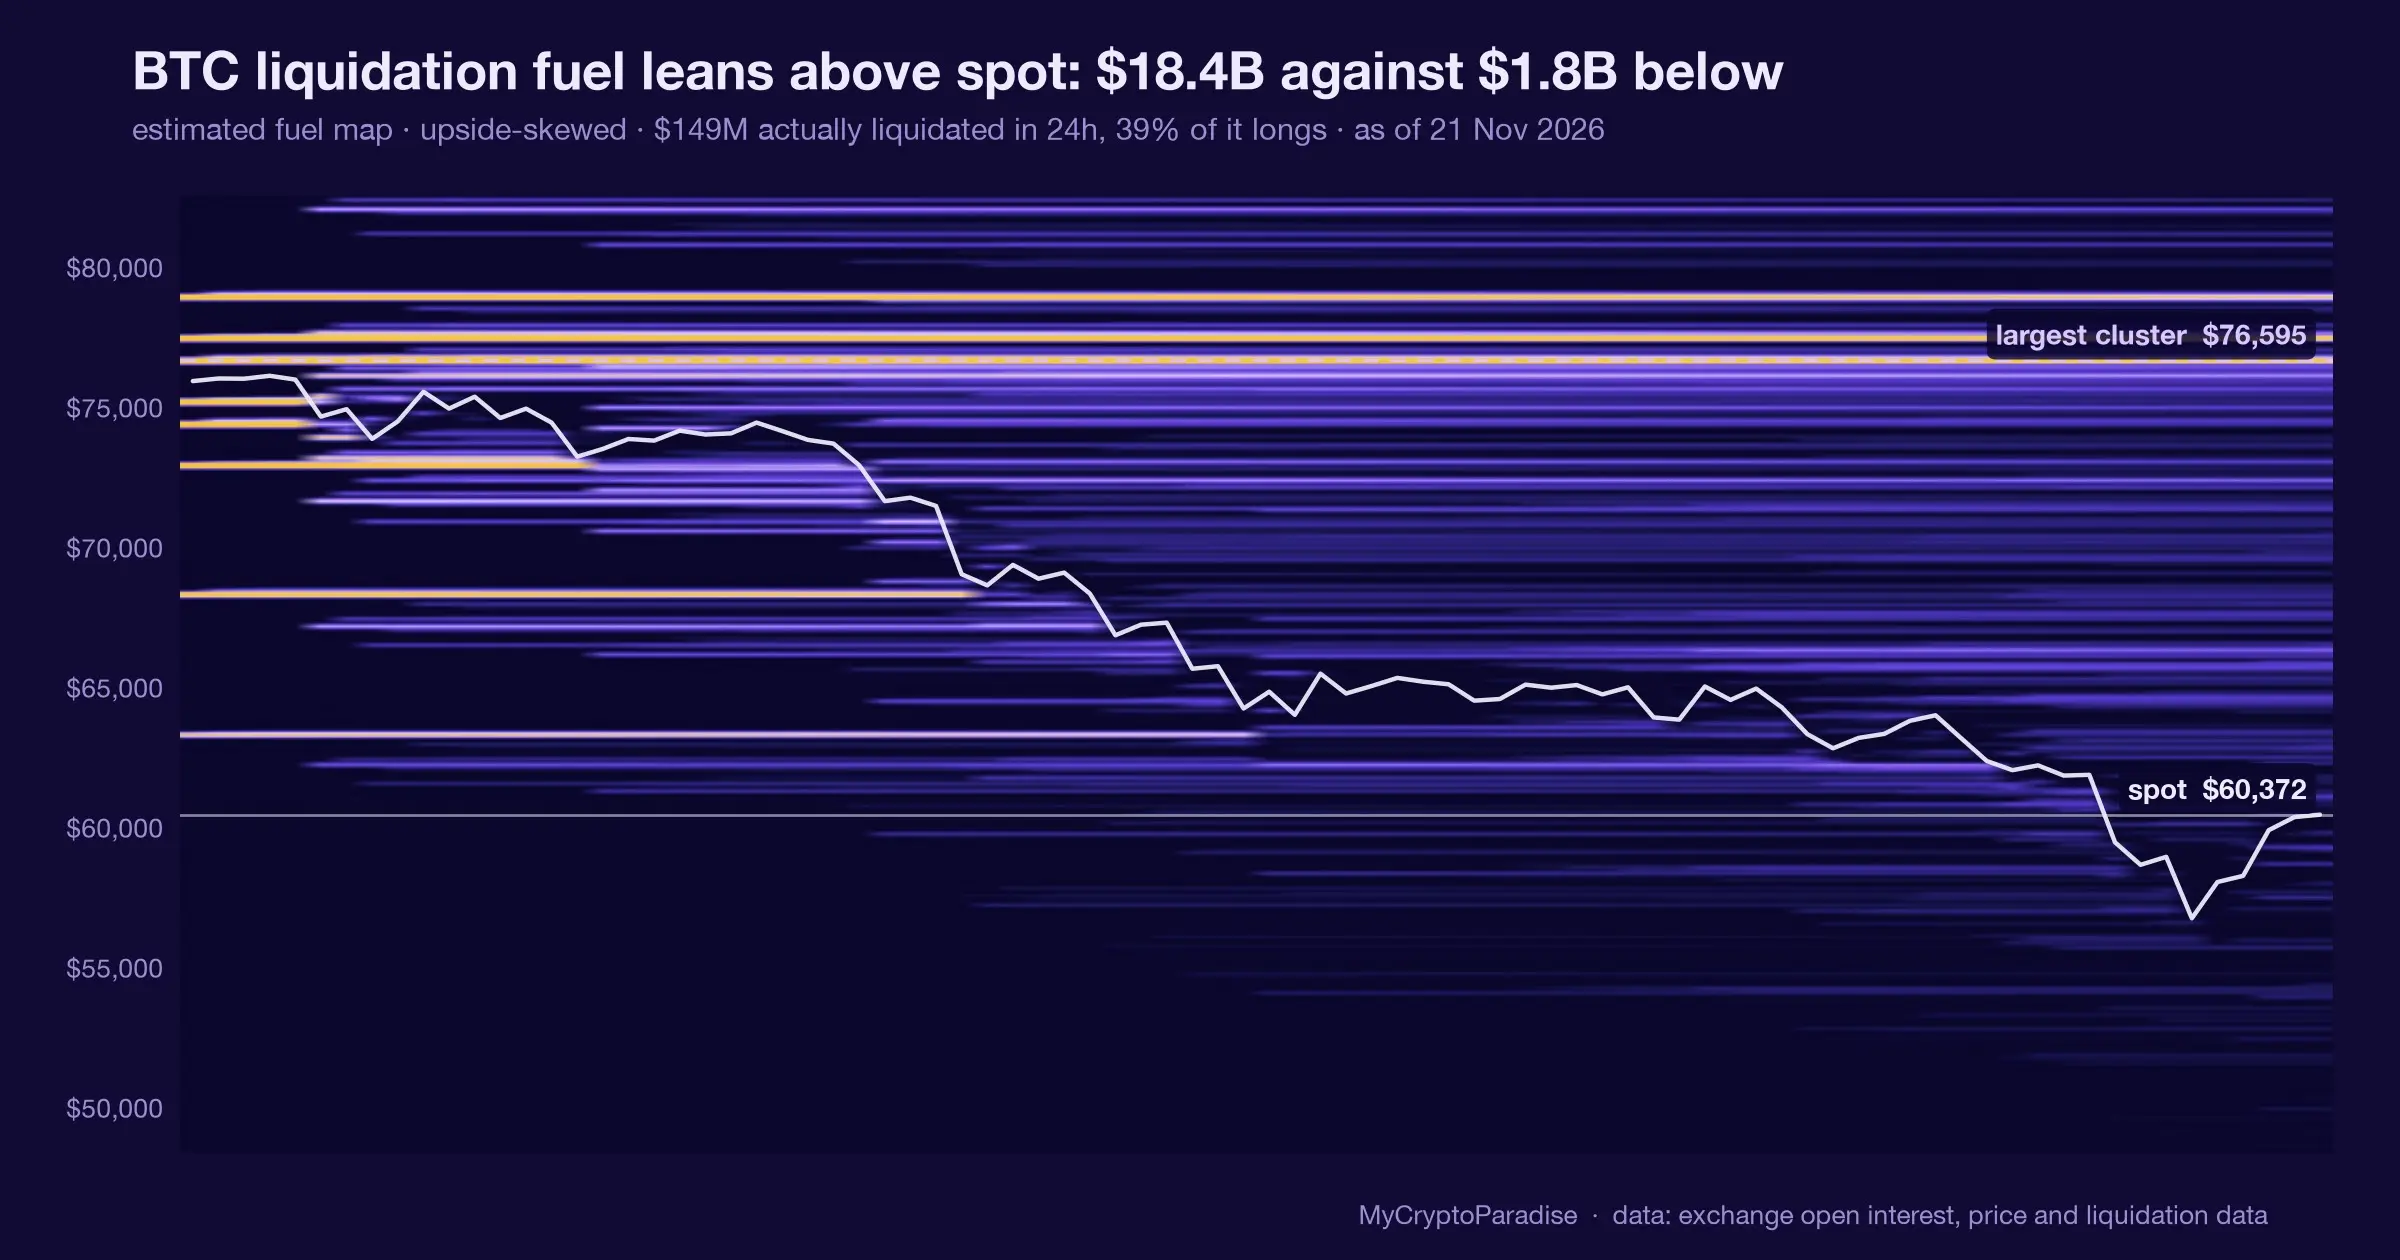
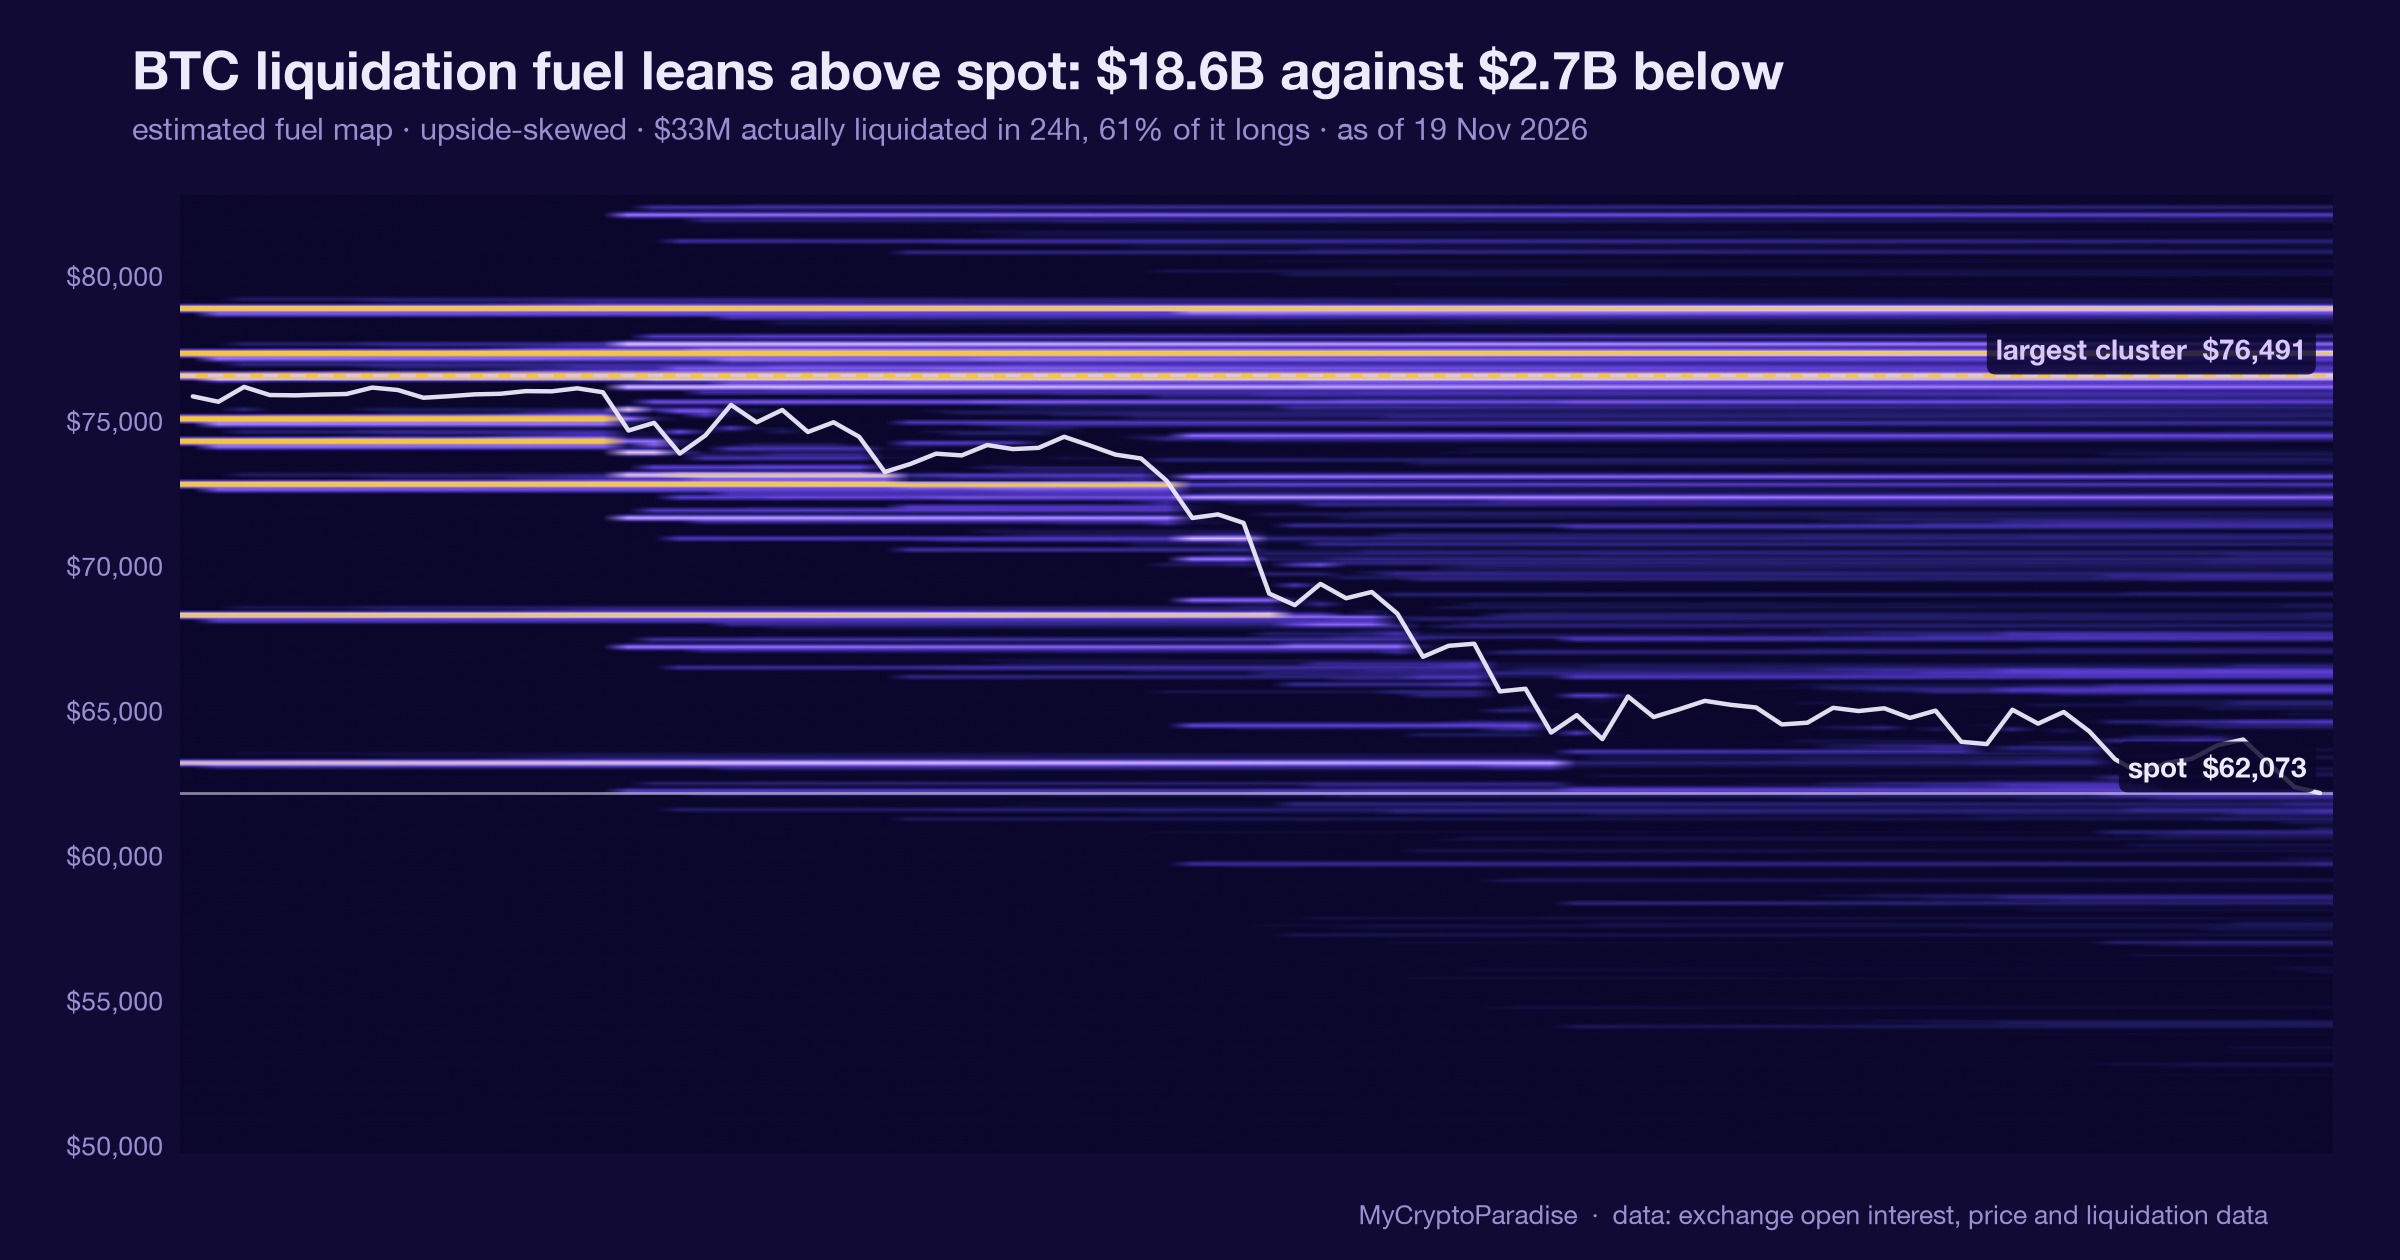
The standing fuel map leans the same way. With spot near $60,372, an estimated $18.4B of liquidation fuel sits above against $1.8B below, 10.2 to 1, an imbalance reading of plus 82. That is the sharpest upside skew we have logged this month.
The order book backs the calm. Within two percent of spot our own grid holds $1.12B of bids against $947M of asks, the integrity check flags zero spoofing, and no large wall near price is marked unstable.
Three readings, one direction, and only one of them is realized. The tape already happened; the fuel map is a projection of where the next forced flow would land.
What is different here
The ParadiseTeam does not read a liquidation tape as a direction to trade. It reads it as forced flow: who was margin-called, which way the exchange had to transact, and where the next pocket sits. That is a method difference, and it is why the number carries an invalidation, not a target.
Where the fuel sits is not a trigger
The obvious misreading is that short liquidations plus fuel stacked above spot equals a rally that is owed. It is not. A fuel map describes where a move would accelerate if one begins, not a force that begins it.
Two cautions size this down. The $149.4M tape is modest, not a flush, so it is a lean in the microstructure rather than a regime change. And the fuel series carries a model-estimate flag, which means it has not cleared its calibration gate.
A model estimate quoted as a historical rate is decoration with a decimal point. We quote it as a recon reading, and a recon reading earns one line of risk, never a position.
One input, and what it changes
This is one indicator, not a verdict. The forced tape sits alongside funding, open interest (OI) and spot absorption, and today it broadly agrees with the order book rather than fighting it.
The absorption read itself stays quiet. No episode is active, intensity reads low, and the only standout is a sell-side climax logged at the 99th percentile, which is itself an uncalibrated, gate-pending reading we treat with the same caution.
So the layers mostly line up constructive, with one realized leg and two estimated ones. That is a probability weight on a bias, not the bias itself. The rest of those layers, stacked and dated, sit in PRO Paradiser.
The honest posture here is direct and small. The imbalance sits above spot, the realized tape backs it, and the single level that flips the read is what keeps direct from becoming a forecast.
Reading the forced-liquidation tape yourself, step by step
- Open our crypto liquidation heatmap and read the 24-hour forced tape total, not the single headline blowup that circulates on social.
- Split that total into long and short liquidations: short liquidations are shorts forced to buy, long liquidations are longs forced to sell.
- Compare the realized tape against the standing fuel map above and below spot, and note whether the series carries a model-estimate flag.
- Check the order book within two percent of spot: bids against asks, and whether any large wall near price is flagged unstable.
- Write the single level whose daily close would flip the lean before you size anything, then size it as one line.
Most readers stop at the headline liquidation figure and never split it into longs and shorts, which is the only half that tells you who was actually forced.
Every number above is checkable against the live data. Start with the crypto liquidation heatmap, then cross-read the MCP Insights hub and the Crypto Fear and Greed Index.
Act and invalidate
| Scenario | What confirms it | What kills it |
|---|---|---|
| Constructive lean plays out | Short liquidations keep leading the tape | Daily close below the heavier pocket |
| Chop inside a stable book | Bids hold above asks near spot | Large walls near price flagged unstable |
| Downside resolution | Forced tape turns majority long | Fuel above spot keeps draining on green |
Posture: A constructive lean worth one line of risk, not a position. The asymmetry sits above spot and the realized tape backs it, but the fuel series is a model estimate, so treat it as a probability weight and keep the invalidation close.
Frequently asked questions
What is the forced-liquidation tape?
It is the running 24-hour total of leveraged positions that exchanges closed automatically because they fell below margin. Unlike ordinary volume, these are not chosen trades: the venue buys or sells at market to cover the shortfall, which makes the flow mechanical and price-insensitive.
Why do short liquidations push price up?
A short position profits when price falls, so closing it means buying back the asset. When an exchange liquidates a short, it issues that buy at market on the trader’s behalf. A cluster of short liquidations therefore stacks forced buying into the tape, which lifts price.
Is a 10.2 to 1 fuel skew bullish?
It is a constructive lean, not a conclusion. The ratio says far more forced-buying fuel sits above spot than below, so a move up would accelerate there. It does not say a move starts, and because the series is a model estimate, it is one input among several.
Why call the fuel map a model estimate?
The series carries a flag showing it has not cleared its calibration gate, so its numbers are projected rather than verified against outcomes. We quote it as a recon reading. Treating an uncalibrated projection as a historical frequency would overstate exactly what the number can support.
What would invalidate this constructive lean?
A daily close that drags the heavier estimated fuel pocket below spot, or the 24-hour forced tape turning majority long, would flip it. Either event moves the asymmetry against the read, at which point the honest posture is defensive and no edge is worth sizing.
Crypto trading involves substantial risk and is not suitable for everyone. Nothing here is financial advice; it is education only. Never risk more than you can afford to lose.
The private Extras feed, where the forced-liquidation tape, the estimated fuel map and the order-book read update intraday with their invalidation levels, is part of PRO Paradiser, the intelligence layer behind the ParadiseFamilyVIP strategies.











Join the discussion
No comments yet. Members, share how you are reading this.