

In short
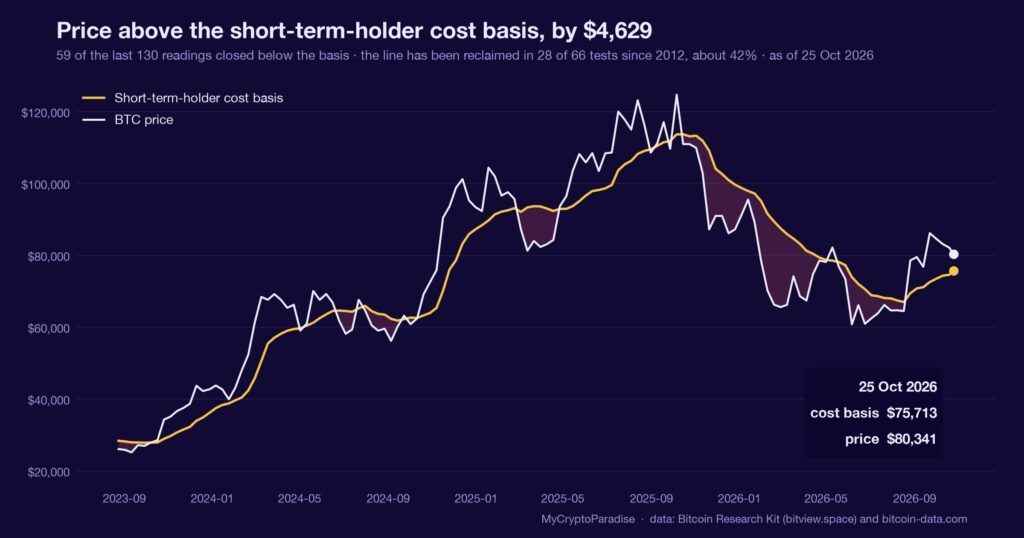
The short-term-holder cost basis is the average price every coin bought within roughly the last five months last changed hands: the breakeven line for recent buyers. On 25 October 2026 bitcoin traded at $80,341, sitting $4,629 above that line at $75,713, a cushion of 4.92 times the daily range. The same spot is also 49 percent above the whole market’s realized price of $54,052. Yet half the cohort is underwater: 1.86 million coins, 50.2 percent of recent-buyer supply, up from near 34.5 percent a week ago. We called this neutral, explicitly not a directional call, because a cushion above the average and a cohort split down the middle do not agree. This reading is our model estimate, not a calibrated rate. This piece shows you how to read the short-term-holder cost basis yourself, dispersion and all.
Key facts
- Bitcoin price at the reading
- $80,341
- Short-term holder cost basis
- $75,713
- Price against that cost basis
- $4,629 above
- Share of short-term holder supply underwater
- 50.2%
- State
- price above the short-term-holder cost basis
- What would prove this read wrong
- A daily BTC close below the short-term-holder cost basis near $75,700, which flips the median recent buyer from a shrinking cushion into net loss.
- Reading taken
- 25 October 2026
- Source
- Our MCP Insights tools, from Bitcoin Research Kit (bitview.space) and bitcoin-data.com. Upstream data published by the Bitcoin Research Kit
The recent-buyer cost basis measures a crowd’s breakeven
The short-term-holder cost basis is a single number standing in for a crowd. It is the average price at which coins that moved within roughly the last five months last changed hands, read as the breakeven line for the market’s newest and most reactive buyers.
Those buyers are the ones who sell first when a position turns red, because a recent entry carries no cushion of old unrealized profit to sit through a drawdown. So the line matters less as hard support and more as a map of who is still comfortable.
An average, though, hides its own shape. A cohort can sit above its mean cost and still be split down the middle, because a coin bought near the highs and a coin bought near the lows average to a number that neither of them paid.
A cost basis you read as one level is a distribution you have quietly agreed to ignore.
The cushion holds while the cohort splits
Per our own MCP Insights cost-basis series, bitcoin traded at $80,341 on 25 October 2026. The short-term-holder cost basis sat at $75,713, leaving a cushion of $4,629, or 4.92 times the current daily range of $941.
That same spot price is 49 percent above the market-wide realized price of $54,052, the average cost of every coin in existence, and 63 percent above the long-term-holder cost basis of $49,156.
The strain is inside the cohort. Of 3.71 million coins in short-term-holder hands, 1.86 million, or 50.2 percent, are now held at a loss, up from roughly 34.5 percent a week earlier.
Price above the average and half the coins below water are the same reading, and only one half of it is comfortable.
The average reads calmer than the cohort
The obvious misreading is to stop at the headline: price 49 percent above realized cost, comfortably mid-cycle, nothing to see. That number is true, and it is also the least informative one on the page.
The realized price is weighted by coins that have not moved in years, bought at a fraction of today’s price, so it reads comfortable almost until a cycle top. The cohort that actually trades is the short-term holder, and that cohort is now split in half.
This is also a model estimate, not a calibrated frequency. Our series logs 66 recon tests of this level since February 2012, but that count has not cleared its calibration gate, so we offer it as recon colour and never as a probability.
A gauge that always looks calm is not measuring stress. It is measuring history.
What is different here
The ParadiseTeam does not read a cost basis as a single support line. We split the cohort and watch the loss share inside it, because an average that sits above spot while half its coins drown is telling you about dispersion, and dispersion is where the selling pressure actually lives.
The split changes positioning, not direction
Half a cohort underwater is a statement about positioning, not a forecast. It says the supply most likely to sell on weakness has grown: coins bought near October’s $81,000 to $83,000 prints now sit red, and those holders hold with the shortest patience.
It does not say price falls. The cushion above the cohort average is genuine, and while spot holds there the median recent buyer is not yet forced to sell. The imbalance is in conviction, not in direction.
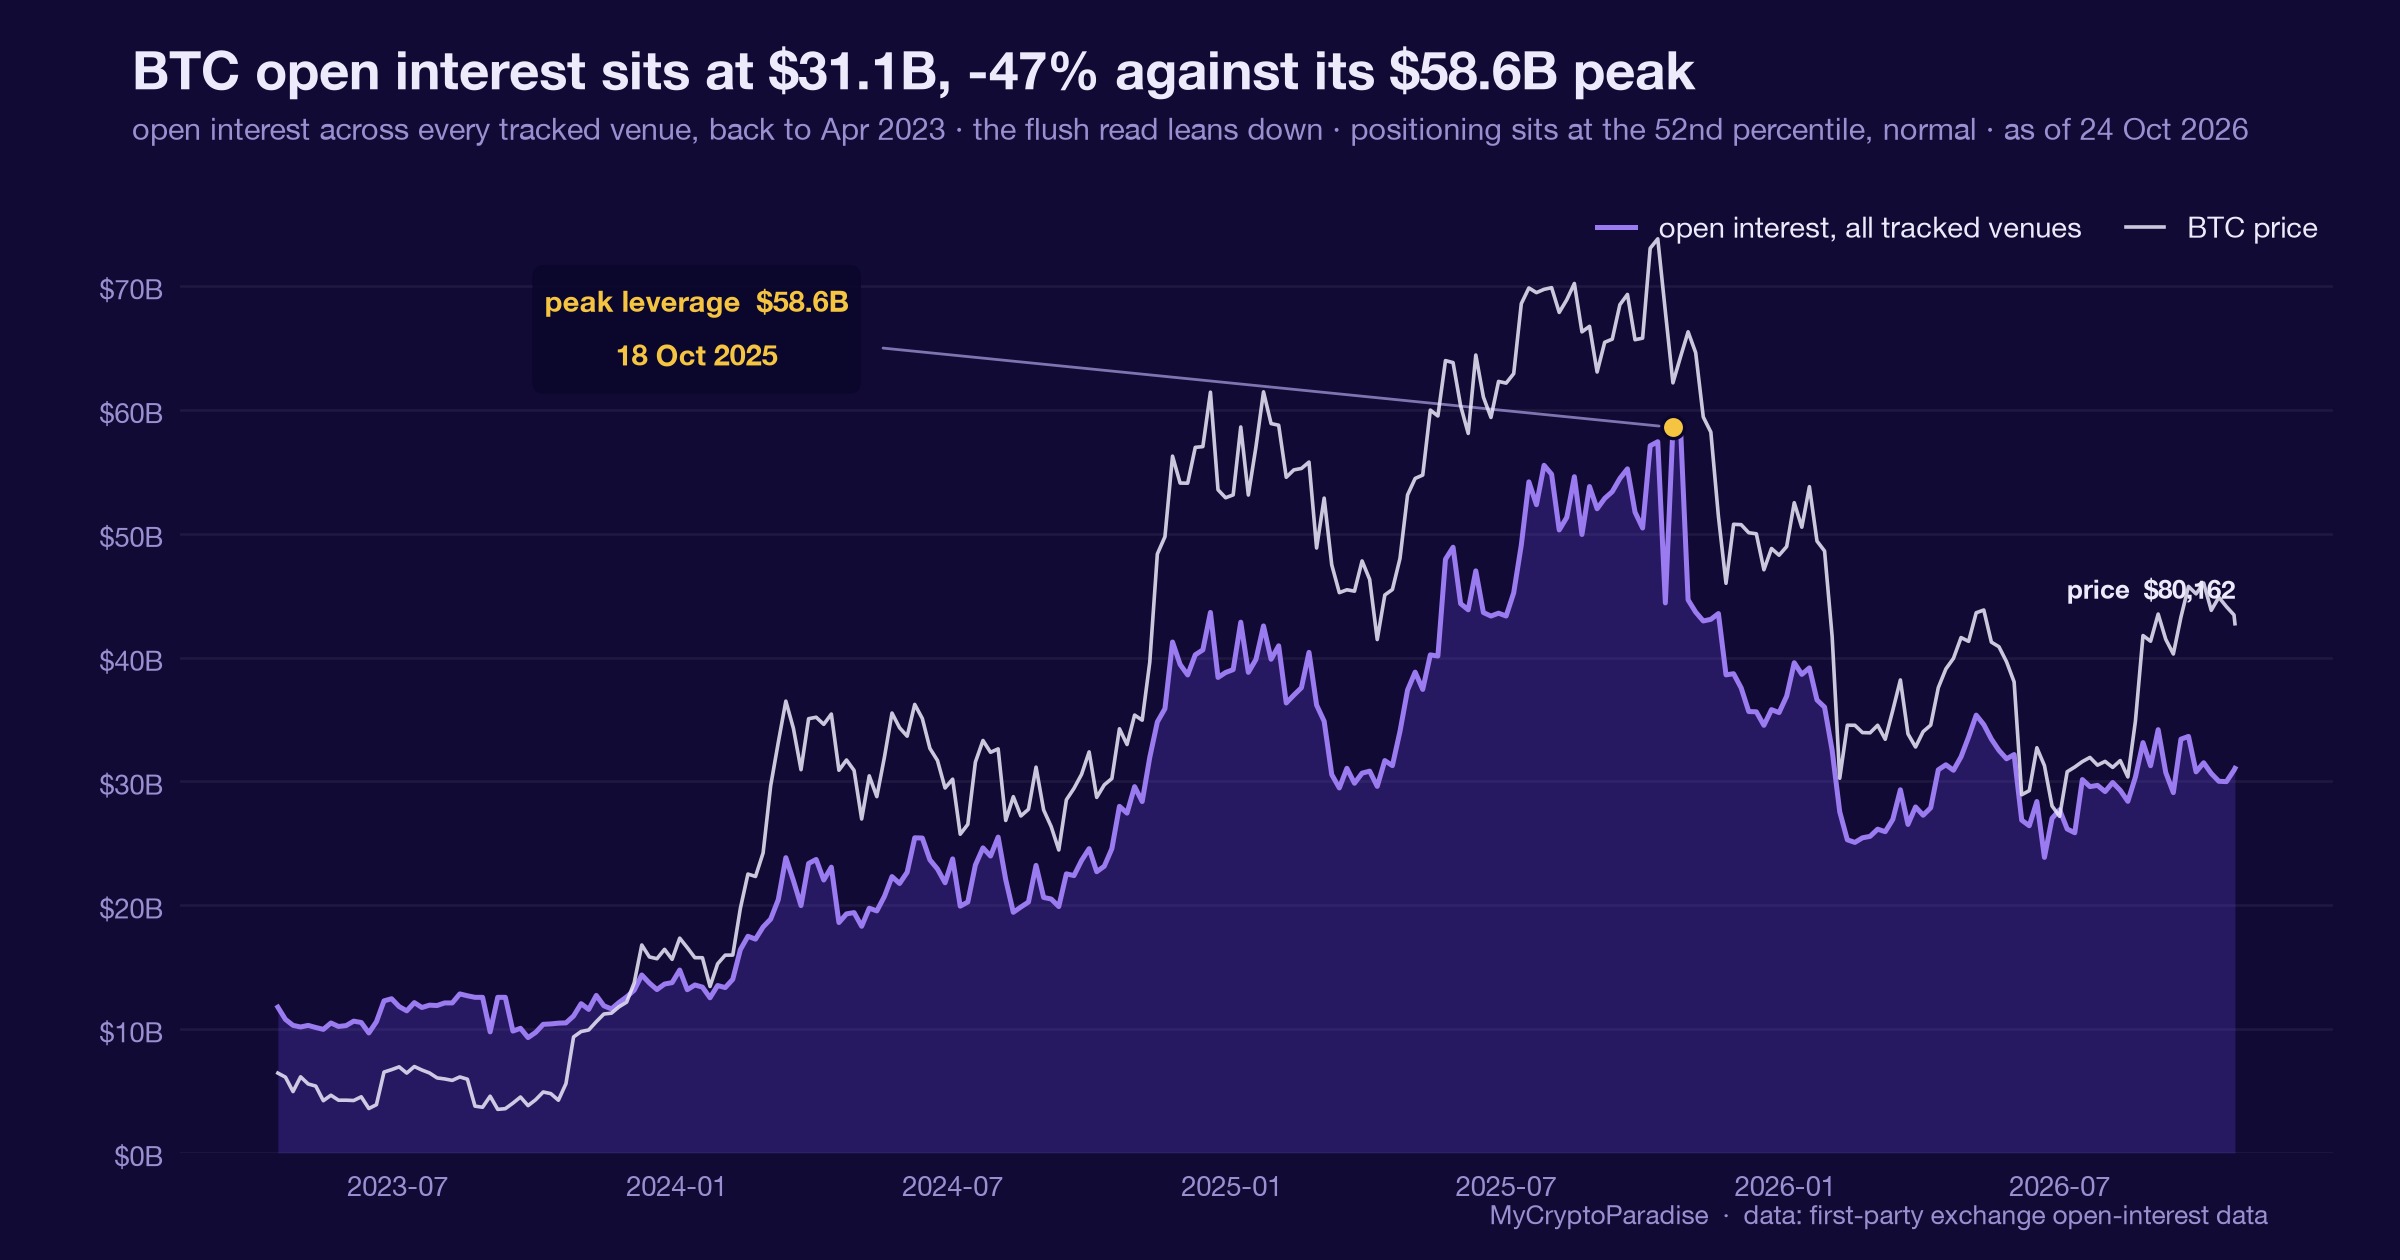
This is one input. It sits alongside funding, open interest and spot demand, and a cost-basis split is a weight on a bias, never the bias itself. Our MCP Insights spent output profit ratio (SOPR) reading, with the aggregate at 1.0015, says most coins that move still change hands at a slim profit.
A cohort splitting is the market quietly rebuilding the fuel it spent at the lows.
The stress kept building while price held
A week ago our model put recent-buyer losses near 34.5 percent. It is now 50.2 percent: roughly sixteen extra points of the cohort pushed underwater while price barely moved, from the low $82,000s to $80,341.
That is the tell. When the loss share climbs faster than price falls, new buyers are being absorbed at a worse average than the ones before them, and the cohort breakeven drifts up toward spot rather than away from it.
We flagged the cushion on 16 October as comfortable and named the underwater share as the thing to watch. The watch item is now the story, and that is the honest grade: the cushion held, the stress did not stop building.
Being right about the cushion and early about the stress are two separate readings, and only honesty about both keeps either one useful.
Reading the short-term-holder cost basis yourself, step by step
- Open the Bitcoin cost basis tool and read the short-term-holder line, the average price coins bought in the last five months last moved at.
- Compare it to spot: the gap, in dollars and in daily ranges, is the cushion recent buyers hold before they turn red.
- Do not stop there, because the average hides the spread: find the share of short-term-holder supply actually held at a loss.
- Track that loss share week over week; a figure climbing faster than price is falling means new buyers entered above the old ones.
- Mark the cost-basis level as your invalidation: a daily close below it flips the cohort’s median holder from cushion into loss.
Most people skip step three: they read the average, see price above it, and stop. The loss share is the step that tells you the cohort is split, not calm.
Every number above is checkable against the live data. Start with the MCP Insights hub, then cross-read the Crypto Fear and Greed Index and the live crypto funding rates.
Act and invalidate
| Scenario | What confirms it | What kills it |
|---|---|---|
| Cushion holds, stress eases | Loss share falls back under 40 percent | Daily close below $75,700 |
| Grind continues, cohort stays split | Loss share near half, price flat | Loss share back under 35 percent |
| Cushion breaks | Daily close below the cost basis | Reclaim and hold above $80,000 |
Posture: Neutral with a defensive tilt while the cushion holds and the loss share climbs. The highest-probability stance for most is patience, not positioning: a cost-basis split sizes risk, it does not call direction.
Frequently asked questions
What is the short-term-holder cost basis?
It is the average price at which coins that last moved within roughly five months changed hands. It stands in for what the market’s newest buyers paid, so it reads as their collective breakeven line and a gauge of who is still comfortable.
How can price be above cost basis with half underwater?
An average is not a spread. The cohort holds coins bought near the highs and coins bought near the lows, and they average to a number neither paid. Price can sit above that mean while the coins bought latest, and highest, still sit in loss.
Is this a calibrated base rate?
No. Our series logs 66 recon tests of this level since February 2012, but that count has not cleared its calibration gate. We quote it as recon colour, a model estimate, and never as a historical frequency or a probability you can size against.
What invalidates the constructive read?
A daily bitcoin close below the short-term-holder cost basis near $75,700. That flips the cohort’s median recent buyer from a shrinking cushion into net loss, turning the group most likely to sell on weakness from merely uncomfortable into actively underwater.
Does a rising loss share mean price falls?
No. It is a statement about positioning, not a forecast. A larger underwater share means more supply is prone to sell on weakness, which raises downside risk; it does not set a direction or a level. The cushion above the cohort average still holds.
Crypto trading involves substantial risk and is not suitable for everyone. Nothing here is financial advice; it is education only. Never risk more than you can afford to lose.
The private Extras feed, where the recent-buyer cost basis, the cohort loss share and their invalidation levels update intraday, is part of PRO Paradiser, the intelligence layer behind the ParadiseFamilyVIP strategies.











Join the discussion
No comments yet. Members, share how you are reading this.