

In short
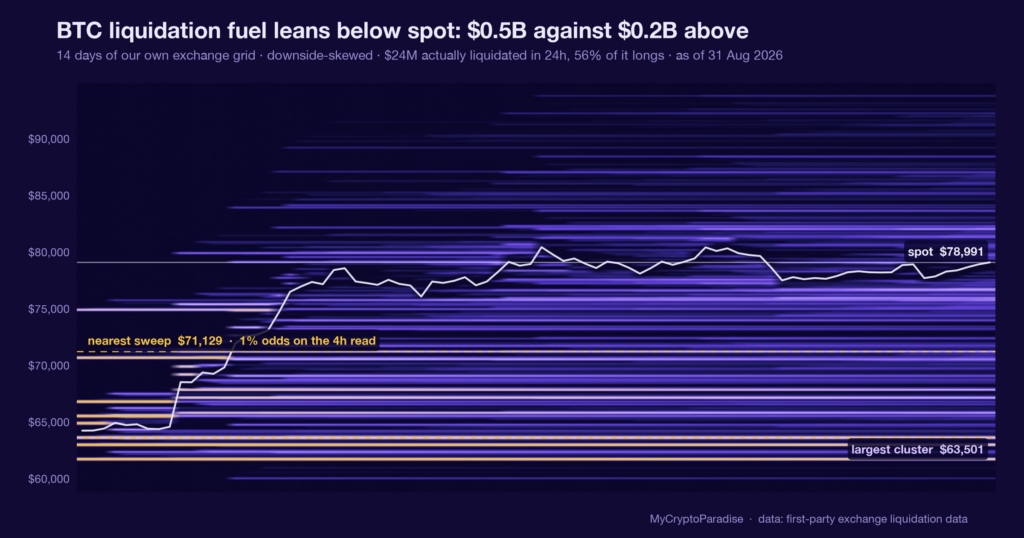
A liquidation map is a snapshot of where leveraged stops sit: the price levels at which longs and shorts would be force-closed, and how much size waits at each. Per our MCP Insights liquidation-map data, dated 30 August 2026, roughly $23 billion of long-liquidation fuel rests below the $78,000 shelf, against about $11 billion above it. That is a little over two to one, and it is a statement about where the stops sit, not a forecast of where price goes. We read it as a defensive lean, not a directional call, because the larger pocket sits beneath us. Base rates for this skew are not wired into our data yet, so we claim no historical frequency and grade nothing from memory. The read is live and ungraded; the invalidation is printed below. This piece shows you how to read a liquidation map yourself.
A liquidation map measures forced selling, not opinion
Leverage turns a position into a promise. A trader who borrows to go long agrees, implicitly, to be closed out if price falls to a level their margin can no longer cover. That forced close is a liquidation, and it is not a choice: an exchange engine executes it automatically.
A liquidation map plots those trip-wires. It aggregates the open leveraged positions across venues and marks the price levels where clusters of them would be force-closed, along with how much notional size waits at each shelf. Longs get liquidated on the way down; shorts get liquidated on the way up.
The map does not tell you where price will go. It tells you where price would find fuel if it got there, because a liquidation feeds the very move that triggered it. A gauge that shows you the terrain is more useful than one that pretends to know the weather.
The reading on 30 August: the heavier pocket sits below
Per our MCP Insights liquidation-map data for 30 August 2026, roughly $23 billion of long-liquidation fuel sits below the $78,000 shelf, against about $11 billion of short-liquidation fuel above it. That is a little over two to one.
Put differently, close to 68 percent of the mapped fuel waits beneath current price, and the gap between the two pockets is about $12 billion. The figures are estimated from first-party exchange data, not exact, and we mark them as such.
The asymmetry is the whole of the claim. Both pockets are real; this one is roughly twice the size, and it sits on the downside. That is a statement about where the stops rest right now, not a prediction that they get hit.
What is different here
The ParadiseTeam does not read a liquidation map as a target list. We read it as a probability weight on a bias we already hold from spot and derivatives, then we print the level that would falsify it. A map without an invalidation is a heat-coloured horoscope.
Who gets forced, and why fuel pulls price toward it
The traders at risk below $78,000 are leveraged longs who bought expecting continuation. If price slips into that shelf, their forced exits become market sell orders, which push price lower, which triggers the next cluster. That reflexive chain is why a heavy pocket acts like a magnet rather than a floor.
Larger players know exactly where that fuel sits, because the same map is public. The incentive to probe toward resting liquidity is structural, not conspiratorial: that is where the fills are. Naming it is not an accusation, it is an admission of how the venue is built.
This is one input. It sits alongside funding, open interest and spot absorption, and on its own a fuel map is a lean, not a level. More of those layers live inside PRO Paradiser.
The obvious misread, and what would flip the lean
The obvious error is to read two to one as a countdown to a flush. It is not. A larger pocket below raises the probability that downside, if it comes, travels further and faster, but it says nothing about whether price turns down in the first place.
The read is defensive, not certain: it argues for smaller size and wider patience if price approaches the shelf, and for nothing at all if it does not. Base rates for this skew are not wired into our data yet, so we attach no historical frequency and grade this purely on the live map.
The lean stops being the higher-probability reading on a daily close that holds well above $78,000 and rebalances the map, so the smaller $11 billion pocket above becomes the nearer target. Until then, the fuel sits below, and that is worth exactly one line of risk.
Reading a liquidation map yourself, step by step
- Open a liquidation heatmap and find current price, then note the two nearest fuel clusters, one above and one below it.
- Compare the notional size at each cluster, not just the number of levels, because one thick shelf outweighs several thin ones.
- Divide the larger pocket by the smaller to get the imbalance ratio, and mark which side it favours.
- Treat the heavier side as a probability weight on your existing bias, never as a target or an entry.
- Write the price level that would rebalance the map, and let that be your invalidation before you size anything.
The step almost everyone skips is step five: without a written invalidation, a lopsided map quietly becomes a conviction, and conviction is what gets liquidated first.
Every number above is checkable against the live data. Start with the crypto liquidation heatmap, then cross-read the MCP Insights hub and the Crypto Fear and Greed Index.
Act and invalidate
| Scenario | What confirms it | What kills it |
|---|---|---|
| Price drifts into the $78,000 shelf | Longs force-close, downside accelerates | Shelf absorbs, price holds above |
| Price grinds up toward the pocket above | Short liquidations feed a squeeze | Rally stalls below the cluster |
| Map rebalances near one to one | Ratio compresses under a daily close | Skew re-widens back below |
Posture: Defensive near the shelf, neutral away from it: smaller size and wider patience if price approaches $78,000, and no obligation to act if it does not.
Frequently asked questions
What does a crypto liquidation map actually show?
It shows where leveraged positions would be force-closed and how much size sits at each level. Longs are liquidated below current price, shorts above it. The map marks the terrain a move would cross, not the direction the move takes.
Does more fuel below mean Bitcoin will fall?
No. A heavier pocket below raises the probability that a decline, if it starts, runs further and faster. It says nothing about whether the decline begins. The imbalance sizes the risk of a move, it does not schedule one.
How big is the imbalance on 30 August?
Per our MCP Insights liquidation-map data, about $23 billion of long-liquidation fuel sits below $78,000 against roughly $11 billion above, a little over two to one. The figures are estimated from first-party exchange data.
What would invalidate this defensive read?
A daily close that holds well above $78,000 and rebalances the map, moving the smaller $11 billion pocket above into range as the nearer target. That compression out of the two-to-one skew is what flips the lean.
Why do liquidation clusters attract price?
Because a forced exit becomes a market order that pushes price toward the next cluster, a reflexive chain. Larger players also route toward resting liquidity, since that is where fills are. The pull is structural, not a plot.
Crypto trading involves substantial risk and is not suitable for everyone. Nothing here is financial advice; it is education only. Never risk more than you can afford to lose.
The private Extras feed, where the liquidation fuel map, its imbalance ratio and the invalidation level update intraday, is part of PRO Paradiser, the intelligence layer behind the ParadiseFamilyVIP strategies.














Join the discussion
No comments yet. Members, share how you are reading this.