

In short
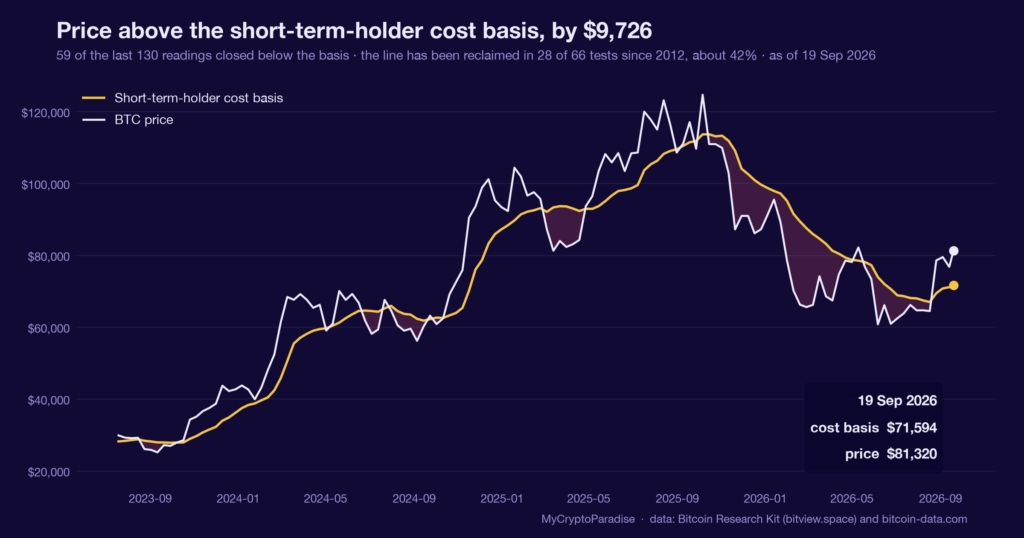
The short-term-holder cost basis is the average price coins bought in the last roughly 155 days last changed hands: the line that decides whether recent buyers sit in profit or loss. Our MCP Insights cost-basis data put it at $71,594 on 19 September 2026, with spot at $81,320. That is a $9,726 cushion, or 8.82 times the average daily range, and it has pushed the share of short-term supply held at a loss down to 1.3 percent. We read that as constructive on downside defence, not as a price target and not as a call for new highs. The caveat sits in the same tape: our SOPR data shows long-term holders realising 7.2 percent profit, the oldest coins selling into strength. This piece shows you how to read the cost basis yourself, and where its cushion stops meaning anything.
Key facts
- Bitcoin price at the reading
- $81,320
- Short-term holder cost basis
- $71,594
- Price against that cost basis
- $9,726 above
- Share of short-term holder supply underwater
- 1.3%
- State
- price above the short-term-holder cost basis
- What would prove this read wrong
- A daily close below the short-term-holder cost basis near $71,594, which puts recent buyers underwater and turns the profit buffer into overhead supply.
- Reading taken
- 19 September 2026
- Source
- Our MCP Insights tools, from Bitcoin Research Kit (bitview.space) and bitcoin-data.com. Upstream data published by the Bitcoin Research Kit
Cost basis is a floor made of sentiment
Every coin has a price at which it last moved. Average those prices across the buyers of the last several months and you get the short-term-holder cost basis: the level the marginal recent buyer paid.
It matters because behaviour changes at break-even. Above it, recent buyers sit in profit and have no forced reason to sell; below it, the same wallets are underwater, and each bounce becomes an exit.
The metric does not forecast direction. It tells you where the pain starts, and how much room price has before it gets there: a floor made of sentiment, not concrete, that holds until enough holders decide it will not.
The cushion is real, and it is unusually wide
Our MCP Insights cost-basis data, read on 19 September 2026, puts spot at $81,320 against a short-term-holder cost basis of $71,594: a $9,726 gap. Expressed in volatility rather than dollars, price sits 8.82 times the $1,103 average daily range above that line.
The market-wide realized price sits far lower at $53,243, leaving spot 53 percent above it, with the long-term-holder cost basis lower still near $49,370. The share of short-term supply now underwater has fallen to 1.3 percent, roughly 46,826 of 3.5 million coins.
Across the full holder base, 28.1 percent of supply is below its purchase price. These are our own recon estimates, not calibrated probabilities: a wide cushion is a fact about today, not a promise about next week.
A wide cushion is not a reason to chase
The obvious misreading is that distance above cost basis means price must keep rising. It does not. A wide cushion tells you the downside is well defended: few recent buyers are trapped and forced to sell. It says nothing about how far price can travel upward, and plenty of wide cushions have simply narrowed.
This is one input, and today it is the calm one. It sits alongside funding, open interest and spot absorption, and on its own it is a lean, not a conclusion. A gauge that shows where selling pressure is absent earns its keep only stacked against the gauges that show where it is building.
What is different here
The ParadiseTeam does not read a cost basis as a buy line or a floor to lean on. We read it as a measure of where forced selling is absent, then size that against the gauges that show where it is building: funding, open interest, and the profit-taking of older coins. One layer, weighted, never alone.
The last five tests of this line split four to one
The record here is a recon reconstruction, so read it as an estimate, not a calibrated rate. In our cost-basis series, price has met this line 66 times since 2012 and resolved higher about 42 percent of the time, inside a 16-point error band. Forty-two percent inside a band that wide is not an edge.
The recent split matters more than the average. The last five times price met this line, our data grades one defence against four rejections. Those were approaches from below, though; today price sits well above the line, the opposite posture, which is why the historical mix says little about the setup in front of us.
The oldest coins are quietly selling into strength
One reading disagrees with the calm. SOPR, the spent output profit ratio, measures whether coins moving on-chain are sold in profit or loss. Our SOPR data shows the long-term-holder version at 1.0718, meaning the oldest coins that moved realised roughly 7.2 percent profit, while short-term holders sat at 1.0042, barely above break-even.
Long-term holders distributing into a rising market is normal, not alarming, but it is the half of the tape the cushion does not show. A read that quotes only the reassuring gauge is decoration. The disagreeing one is what sizes the risk.
Reading the cost-basis cushion yourself, step by step
- Find the current short-term-holder cost basis and today’s spot price; the gap between them is your raw cushion in dollars.
- Divide that dollar gap by the average daily range, so the cushion is measured in units of normal volatility, not headline dollars.
- Check the share of short-term supply held at a loss; a low figure means few recent buyers are trapped and forced to sell.
- Compare the short-term line against the long-term-holder cost basis and the market realized price to see how stretched the whole base is.
- Mark the invalidation: a daily close back below the short-term cost basis, which turns the profit buffer into overhead supply.
The step people skip is step two. A $9,700 cushion sounds huge and a 1.3 percent loss share sounds safe, but only volatility tells you how quickly either can vanish.
Every number above is checkable against the live data. Start with the MCP Insights hub, then cross-read the Crypto Fear and Greed Index and the live crypto funding rates.
Act and invalidate
| Scenario | What confirms it | What kills it |
|---|---|---|
| Cushion holds, chop continues | Spot stays above $71,594 | Daily close below cost basis |
| Buffer widens further | Loss share stays under 5 percent | Underwater share climbing fast |
| Older coins keep distributing | LTH SOPR stays above 1.05 | SOPR falls back toward 1.0 |
Posture: Constructive while price holds its short-term cost basis, with risk defined by a daily close below $71,594. This is a defended-downside lean, not a reason to chase new highs, and the long-term-holder selling is the reason to keep size modest.
Frequently asked questions
What is the short-term-holder cost basis?
It is the average price at which coins bought in roughly the last 155 days last moved on-chain. Above it, recent buyers hold unrealised profit; below it, they are underwater and more likely to sell into strength or panic on weakness.
Does a wide cushion mean price keeps climbing?
No. A wide gap above cost basis means downside is well defended because few recent buyers are trapped, not that price must climb. It measures absent selling pressure, not future demand, and cushions narrow as often as they widen.
How is the cushion measured in volatility?
Divide the dollar gap between spot and the cost basis by the average daily range, or ATR (average true range). On 19 September 2026 that gave 8.82, meaning price sat almost nine typical trading days of movement above the line.
What would invalidate the constructive read?
A daily close back below the short-term-holder cost basis near $71,594. That flips the profit buffer into overhead supply, puts recent buyers underwater, and turns every bounce into a potential exit rather than a defended floor.
Why mention long-term-holder SOPR here?
SOPR, the spent output profit ratio, shows whether moved coins realise profit or loss. The long-term version at 1.0718 means older coins are selling into strength, the caution that balances the calm the cost-basis cushion shows.
Crypto trading involves substantial risk and is not suitable for everyone. Nothing here is financial advice; it is education only. Never risk more than you can afford to lose.
The private Extras feed, where the cost-basis cushion, the short-term loss share and the holder-cohort SOPR readings update with their invalidation levels, is part of PRO Paradiser, the intelligence layer behind the ParadiseFamilyVIP strategies.














Join the discussion 2
that 8.82 ATR cushion would have been a beautiful debit entry if I'd moved my SL a little further that week. missed it! 🤦♂️
wouldnt call that an entry, chinedu. moving your stop loss after the fact is just hindsight gambling.