


Listen: the breakdown
Market briefing: Bitcoin just reclaimed its 50-week moving average for the first time in 45 weeks and trades near $84,580, up over 5% on the day. A Galaxy Digital research view flags a possible bear market bottom, but our read stays cautious: this looks like a squeeze into resistance and retail greed, not smart-money accumulation.
- Bitcoin reclaimed its 50-week moving average for the first time in 45 weeks, trading near $84,580.
- A Galaxy Digital research view notes four of five past bear markets bottomed after this reclaim.
- Our read: the move runs into daily resistance amid extreme greed, with smart money still holding USDT.
Bitcoin just reclaimed its 50-week average and the bear market bottom calls are back, with price near $84,580. But is this a real floor, or retail chasing a lid?
Bitcoin crossed its 50-week moving average (MA) this weekend. It was the first such reclaim in 45 weeks. The market noticed immediately. Price closed the week at $81,159, then pushed past $84,000 late on September 21. It now trades near $84,580, up roughly 5.3% on the day.
A closely watched research view from Galaxy Digital added fuel to the move. The claim is simple: in four of five completed bear markets, reclaiming this average marked the definitive bottom. It is a clean, quotable statistic. It is also the kind of pattern that always looks obvious after the fact.
We have already reported today's short squeeze and the eight-month high near $85,000. So this piece is not about the candle. It is about the story now bolted onto it, the bear market bottom narrative, and whether that story survives contact with the tape.
Here is what changed structurally. For 45 weeks, that moving average sat above price like a lid. Now price sits above it. That flips a long-standing weekly signal from bearish to, at minimum, neutral. Bulls read it as a floor forming.
One caution travels with the excitement. A single weekly close above a long average is a data point, not a confirmed cycle low. Even those calling the bottom admit one close settles nothing. The reclaim earns attention. It does not yet earn conviction.
The 45-week wait that just ended
The transmission runs from one chart line to the entire risk mood. Reclaiming the 50-week MA is a slow, high-timeframe signal. Traders treat it as a regime marker. So when price clears it, the read shifts from still bearish to maybe turning. That single shift changes how everyone sizes risk.
Sentiment did the rest. The Fear and Greed reading now sits at 80, deep in extreme greed. Nine months of frustration flipped to hope in a matter of days. That is not calm accumulation. That is a crowd chasing a level it ignored far lower.
Here is the macro tension. A bottom is usually built in fear, not greed. Real cycle lows tend to arrive when holders capitulate and unrealized losses spread across the market. A reclaim into extreme greed is the opposite emotional backdrop.
The forecasts pile on. One 2027 projection maps a bear case near $44,005, a base near $125,618, and a bull near $145,765, with the base roughly 49% above today. Confident numbers, distant dates. They shape belief today more than they predict price later.
So the reclaim matters because it rewrites the story millions of traders tell themselves. Story moves flows. Flows move price. But a narrative built on greed rather than exhaustion is fragile. That fragility is the whole point.
How the squeeze rippled into alts
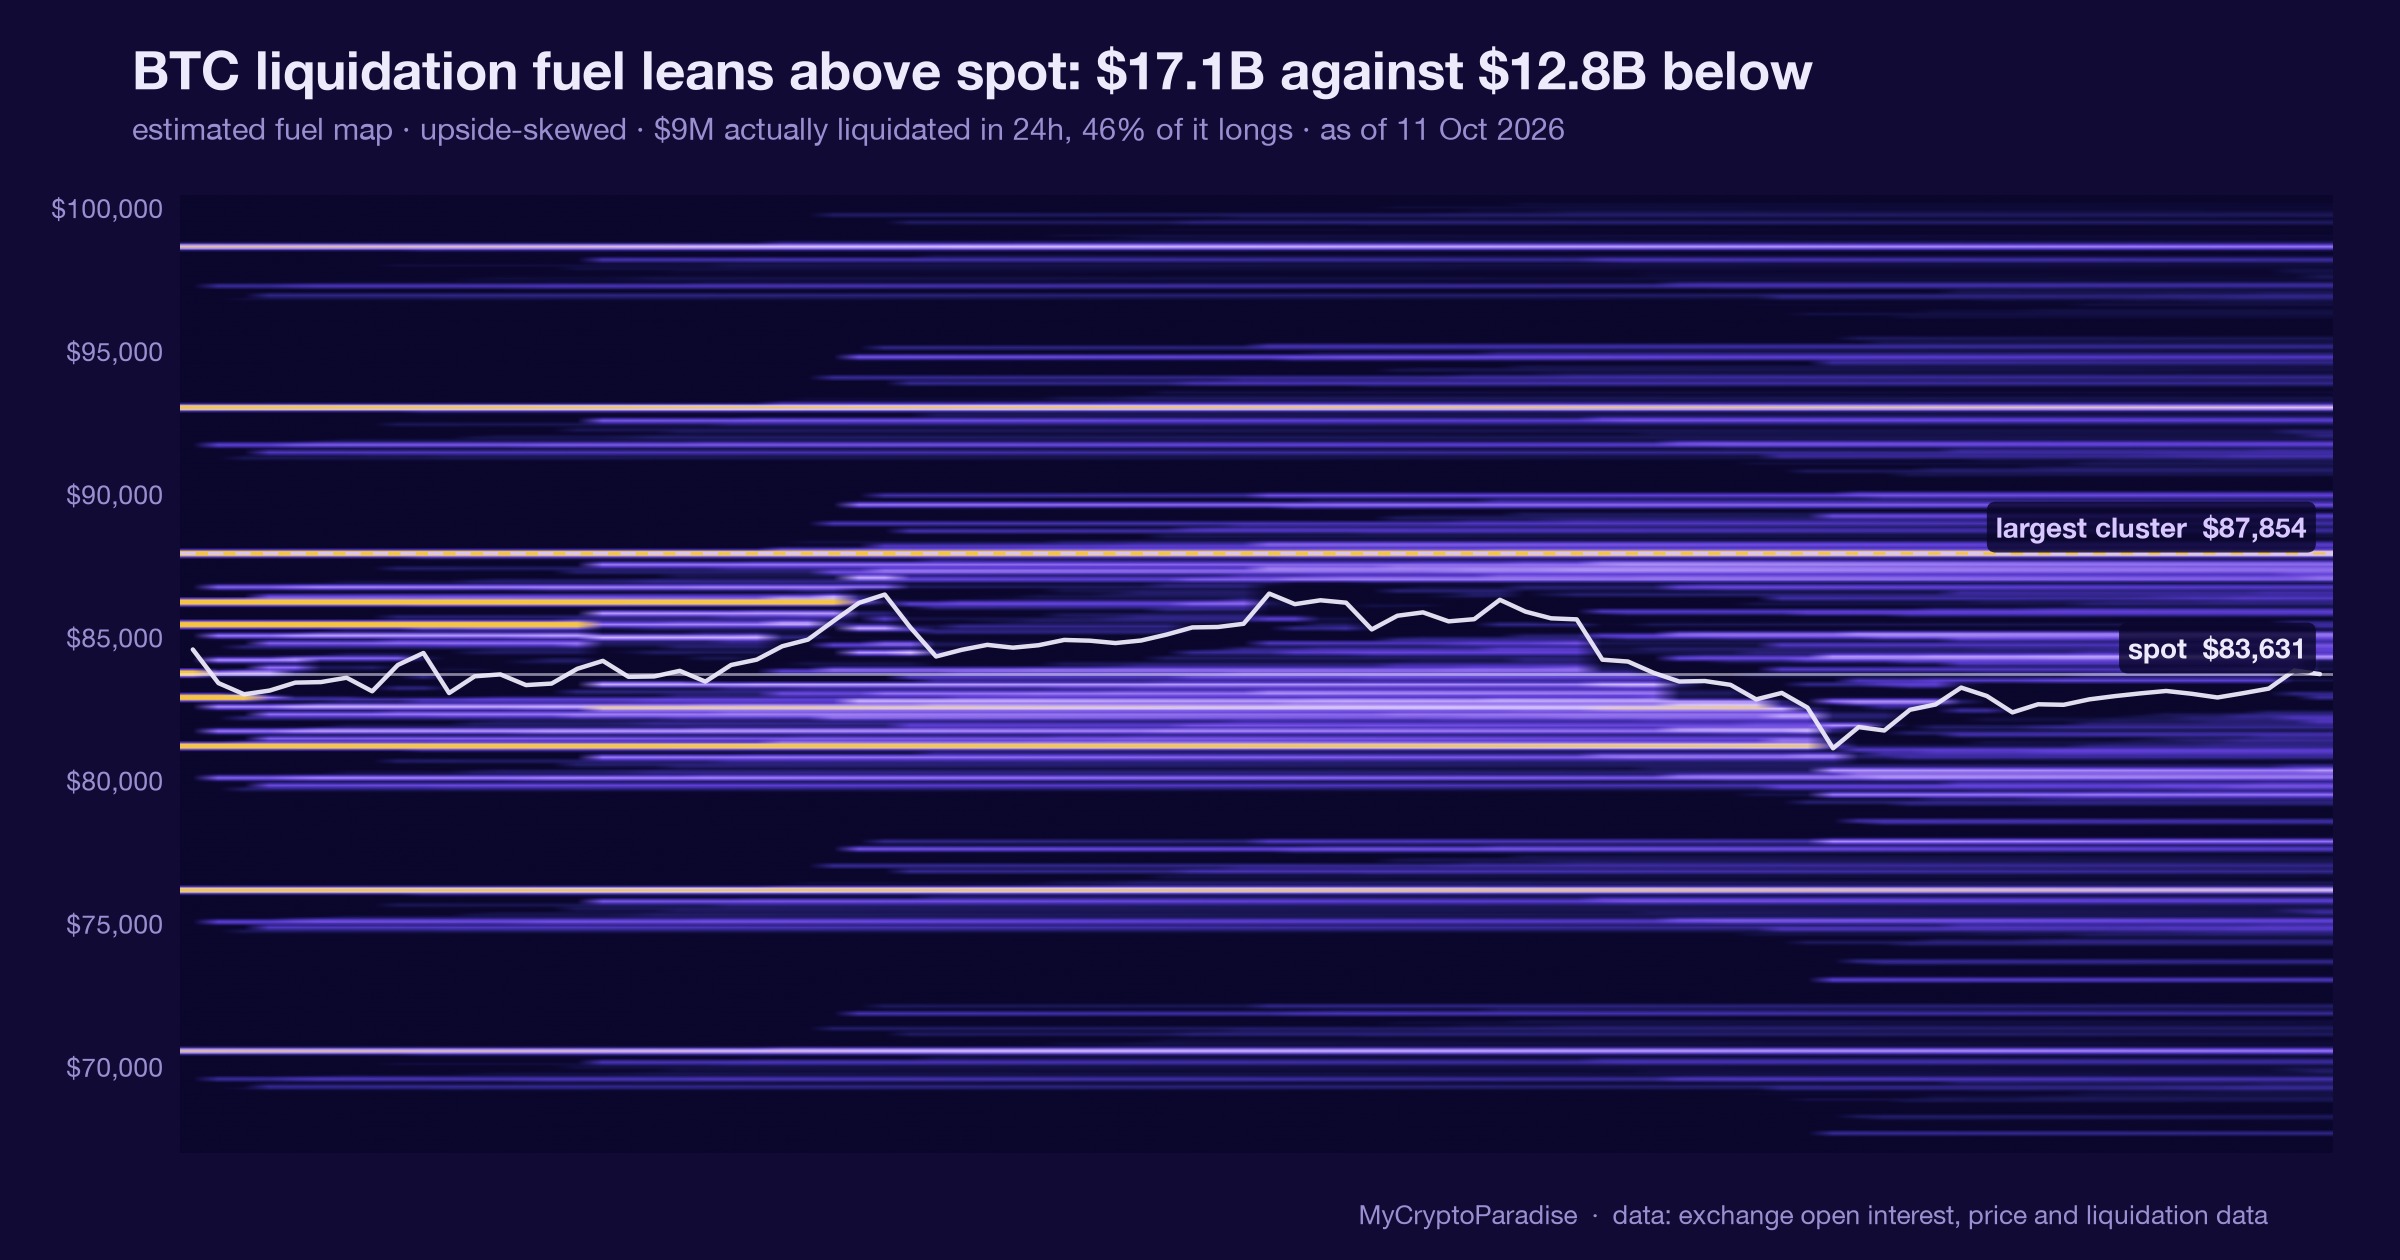
Start with BTC, because everything downstream keys off it. The push through $84,000 ran straight into a known liquidation cluster near $83,400. Shorts stacked there got squeezed, which added mechanical buying on top of real demand. That is how a 5% day builds fast.
The problem is location. This move is climbing into the daily resistance band of $82,000 to $84,000, not breaking cleanly above it. Rallies that stall at obvious resistance often mark where sellers wait, not where buyers win.
ETH followed BTC higher, as it almost always does on a squeeze. Leverage unwinds first, spot conviction second. When the move is squeeze-led, ETH tends to move fast and give back fast, because the buying was forced, not chosen.
Alts amplified the same energy. Lower liquidity means bigger percentage swings on the way up and sharper reversals on the way down. A retail-driven leg lifts alts hardest and hurts them worst if BTC rolls over.
Here is the liquidity read. The buyers pressing this candle are mostly late and mostly retail. The larger balances that would confirm a durable trend are not visibly stepping in. So the cascade looks impressive on the screen and thin underneath. Impressive and thin is exactly the combination that traps chasers at resistance.
Weekly closes will settle this argument
Confirmation and invalidation sit close together here, so watch both.
The first test is whether price can hold above $84,000 and print a second, then a third weekly close over the 50-week MA. One close is a headline. A cluster of closes is a signal. Until that stacks up, treat the reclaim as provisional.
Watch the resistance band itself. A clean break and hold above $82,000 to $84,000 would strengthen the bull case materially. A rejection back inside, especially on fading momentum, would expose the move as a liquidity grab.
Momentum is already flashing a warning. The RSI (relative strength index) is printing equal highs against a rising price, a bearish divergence. If that divergence resolves down while price stalls at resistance, the reversal risk climbs.
On the downside, $75,000 is the support that has been defended before. Losing $84,000 does not break the story. Losing $75,000 would.
The deeper confirmation is emotional, not technical. A durable bottom usually needs a capitulation phase, where market-wide unrealized profit and loss dips below zero. We have not seen that. Until we do, every bounce, this one included, has to prove it is more than relief.
So the checklist is short. Multiple weekly closes above the MA. A held break of resistance. Real capitulation behind us. Miss those, and the base case stays a trip back toward defended support.
Resistance, greed, and the missing buyers
At $84,580, Bitcoin is trading inside the ParadiseTeam's daily resistance zone of $82,000 to $84,000, not above it. That distinction drives our entire read. Price reached for the liquidation cluster near $83,400, took the fuel, and is now leaning on the exact band where sellers have been sitting.
Our macro bias stays bearish while this plays out. The weekly picture only turned bearish back at the $121,000 high, and nothing since has repaired it. A 50-week reclaim is progress, not a reversal.
The smart-money-versus-retail split is the core of it. Larger spot balances distributed earlier and now sit largely in USDT, waiting for a proper flush before re-entering. Meanwhile a crowd at a greed reading of 80 is buying the reclaim. That is the classic shape of distribution into retail strength, not accumulation.
The RSI divergence sharpens the caution. Equal momentum highs against a higher price often precede the giveback, especially at resistance.
So the ParadiseTeam treats this as a level to respect, not chase. A held break above $84,000 with genuine follow-buying would force a rethink and shift the daily bias. Absent that, the map points back toward $75,000 support, with the expected macro bottom still projected far lower near $44,000. Probabilities, not promises: strength here is welcome, but it has to earn a trust it has not yet earned.
The read behind this: we framed this story through our own market analysis, Can Bitcoin Break Resistance This Time?
Track it live: our Crypto Fear and Greed Index and the live crypto funding rates both update in real time, so you can watch this shift for yourself.
Related coverage
For exact entries, targets, and stop losses with full risk management, that is what ParadiseFamilyVIP is for. New to reading these moves? Start with our crypto trading strategies guide.
ParadiseTeam is monitoring the market situation closely, and we are taking these developments into consideration while building our trading tactics inside ParadiseFamilyVIP.
Crypto trading involves substantial risk. Prices are volatile and you can lose money. This article is educational and is not financial advice. Past performance does not guarantee future results.
Does this 50-week reclaim mark the real bottom, or a trap?
This is how 15 Paradisers are calling it. Tap your call.
No calls on this one yet. Tap yours to be the first.
Free account, no password. Members just sign in.












Join the discussion 20
That 50-week average is a debit, not a credit, if you're looking for a trap. My books say a clean break here, with a stop below $82k, makes the risk-reward line look too good to pass. 📈📉
chinedu, i think youre spot on with the trap potential, especially if you consider the liquidity grab we saw just before this push.
I'm seeing some of this rally as a liquidity grab above the 50-week... What's the specific invalidation for this trap scenario?
Watching the 50-week is standard. The data on previous rallies into this kind of resistance typically shows lower volume on the push-through.
It’s always a little scary when things move so fast like this 😨. Is anyone else looking at volume for confirmation on this weekly close?
i see these cycles like the dry season when the trees rest before the next harvest a time for patience before the rains return. the weekly average is a good anchor for that.
Jessica, that 84.5k zone is notable, but I'm more focused on how it interacts with the weekly reclaims from 2021. Always a quiet pleasure mapping these ranges on a Sunday.
yeah you watch the weekly but what's the actual level that matters here is it the 84.5k or is there another stop to consider
yes, Jessica, the 84.5k is a pivot point, but the range of this consolidation also shows a clear resistance around 88.2k.
The 'trap' argument for a rally like this often feels a bit like trying to catch smoke, no? I find the weekly closes more convincing than any single average crossing. 🤔
i mean a weekly close is good but the volume on that candle gives a clearer picture for me... especially for a potential trap.
yeah i'm watching that 50 week too and wondering about the volume on this push - is it enough for a proper breakout or just a little bounce? 😬📈🤔
for me, that 50-week average has always been a pretty clear indicator... a good one to keep your eye on. 👀 I'm only in spot, so i just watch closely...
For sure, the 50-week is key! 🔑 But sometimes it feels like that average is just a psychological level for some people, no? 😅📊
yeah looking at the 50-week is fair, but its the perp basis that tells you whether this move has any real conviction behind it I think. anyone else watching that closely.
I watch this moving average super close too 🤔 and this rally feels kinda different this time! 📈 I'm staying super careful tho, just in case 😅.
olivia, that "different this time" feeling always gets me thinking back to '13. its good to see you careful too, given the crowd positioning.
the 84.5k level on its own is a bit isolated here, i'm seeing stablecoin net flows to exchanges still negative this week, doesn't really support new capital coming in for a breakout
All the indicators mean nothing if the bid isn't there when resistance hits.. liquidity decides.
I look at this average with the 200 too 🤔 and the volume is still low for this move 🤷🏾♀️. Feels like a fake out to me 🚩.