

In short
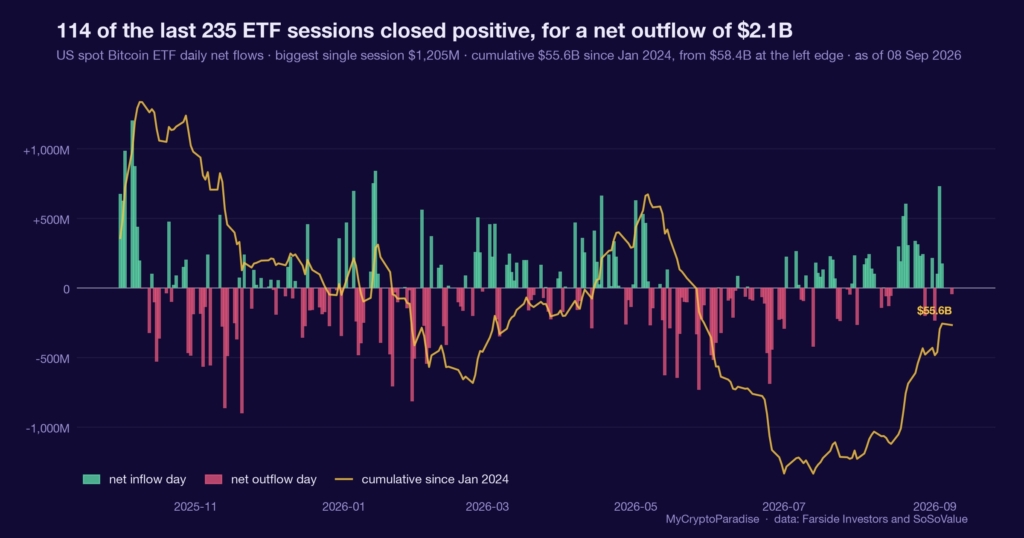
A spot Bitcoin exchange-traded fund (ETF) net flow is the daily money that enters minus the money that leaves the listed funds, and it is one of the cleaner reads on allocator demand. On 8 September 2026, per our MCP Insights ETF-tide data, those funds took in a net $723.5M over five sessions even as spot fell 3.45 percent. That gap is the story: price soft, flows positive, which our feed flags as allocator absorption. We are not calling the golden cross a confirmation to trade, because we do not have crossover base rates wired, and a moving-average cross is built from months-old price. We lean constructive on the absorption, not on the crossover, and the lean is fragile: 8 September already printed a one-day net outflow of $46.6M. This piece shows you how to read ETF flows against price yourself, and what invalidates the read.
Key facts
- Latest session net flow
- -$46.6M
- Net flow over the last five sessions
- $723.5M
- Cumulative net flow since January 2024
- $55.64B
- What would prove this read wrong
- A second straight session of net ETF outflows that extends the current one-day outflow streak, drags the five-day net flow negative, and breaks the MCP ETF-tide grade below 40.
- Reading taken
- 08 September 2026
- Source
- Our MCP Insights tools, from Farside Investors and SoSoValue. Upstream data published by Farside Investors
A moving-average cross looks backward; flow looks now
A golden cross is a chart event: the average of the last fifty daily closes rises above the average of the last two hundred. Both lines are built entirely from prices that have already printed.
A spot Bitcoin ETF flow is different in kind. It is the money that entered or left the listed funds today, netted across every issuer, and it moves with demand rather than lagging it.
The distinction matters because one series describes where price has been and the other describes who is buying it now. A cross confirms a trend that already happened. A flow tells you whether the bid is still there.
What the flow did into 8 September
Per our MCP Insights ETF-tide data, the listed funds absorbed a net $723.5M across the five sessions into 8 September 2026, while spot Bitcoin fell 3.45 percent over the same window. The tide impulse read 77 percent toward the inflow side.
The single latest session was softer. Net flow printed minus $46.6M on 8 September, a one-day outflow streak, even as IBIT took in $117.4M and ARKB $137.7M: fresh money into the largest funds, offset by legacy vehicles bleeding out.
Our MCP ETF-tide grade sat at 53 with no daily change, and its historical up-rate is 0.5142, roughly 51 percent, across 22 effective windows since 9 April 2024. Cumulative net creations stand at $55.64B.
Read together, the week bought and the day hesitated. That is not a contradiction to resolve: it is the exact shape of demand meeting a soft tape.
What is different here
The ParadiseTeam does not trade the crossover; it reads the flow underneath it. Where a golden cross reports a move that already happened, our ETF-tide grade measures who is buying now, dated to the session, so the divergence between price and demand becomes something you can size rather than admire.
The crossover is the lagging half of this
The obvious read is the crossover, which the source dresses in a long-run failure rate. We are not quoting that rate: we do not have golden-cross base rates wired into our data, and a borrowed frequency with no error bar of our own is decoration, not evidence.
There is a mechanical reason to distrust it anyway. The two averages that just crossed are built from closes stretching back months, so the event confirms a move that is already behind price. By the time the lines cross, the trade that caused them is old.
A signal that only tells you what already happened is a receipt, not a forecast. We would rather read the thing that is still moving.
Absorption is the tell worth sizing
What is still moving is the flow, and it currently disagrees with the tape in a specific way. Money kept entering the funds while price slipped, which our feed labels allocator absorption: steady buyers taking the other side of a soft market.
That leans constructive, and it is worth stating plainly rather than hedging into mush. The five-day net stayed clearly positive through a 3.45 percent drawdown. Absorption of that kind is buyers stepping into weakness, not distribution.
This is one input, not the whole read. It sits alongside funding, open interest (OI) and spot absorption, and today it is the layer that leans against the price action rather than with it. The deeper layers live in PRO Paradiser.
An imbalance you can measure is worth exactly one line of risk. It is a lean, not a level, and the next section says what would end it.
Where this read is already fragile
The lean is not a conviction, and the data is honest about why. The very session the crossover completed also printed a net outflow of $46.6M, the first day of an outflow streak, and the tide grade did not budge from 53.
The up-rate underneath the grade is 51 percent. That is a coin flip, and we will not pretend a coin flip is an edge. The edge, such as it is, sits entirely in the absorption divergence, which one more outflow day would erase.
A gauge that admits its direction is a coin flip is more useful than one that always finds a signal. The absorption is the finding; the coin flip is the honesty around it.
Reading ETF flows against price yourself, step by step
- Pull the daily net flow for the spot Bitcoin ETFs and sum the last five sessions, not just today.
- Put that five-day net beside price over the same window, and note whether they agree or diverge.
- If flows are positive while price falls, you are looking at absorption; if both fall together, distribution.
- Split the total by fund: fresh money into the largest issuers can hide legacy outflows in the net.
- Set an invalidation before you act: name the outflow streak or grade level that would end the read.
The step people skip is the fund-level split: a single net figure can read negative while the largest funds take in money, so the aggregate hides who is actually buying.
Every number above is checkable against the live data. Start with the Bitcoin ETF flow tracker, then cross-read the MCP Insights hub and the Crypto Fear and Greed Index.
Act and invalidate
| Scenario | What confirms it | What kills it |
|---|---|---|
| Absorption holds | Five-day net stays positive | Second straight outflow day |
| Demand fades | Tide grade breaks below 40 | Grade reclaims and holds 55-plus |
| Crossover was noise | Price drifts, flows flat | Flows turn decisively one way |
Posture: Defensive-to-neutral with a constructive lean, no chase. The absorption earns patience, not size, until a second session either confirms the flow or snaps it.
Frequently asked questions
What is a Bitcoin golden cross?
It is a chart event where the average of the last fifty daily closes rises above the average of the last two hundred. Both lines are built from past prices, so the cross confirms a move that has already happened rather than predicting the next one.
Do ETF inflows mean price goes up?
Not on their own. Inflows measure allocator demand, which is one input among several. When flows stay positive while price falls, that absorption can precede a bounce, but a coin-flip historical up-rate means it sizes risk rather than guaranteeing direction.
What does allocator absorption actually mean here?
It describes buyers stepping into a falling market. On 8 September 2026 the funds took in a net $723.5M over five sessions while spot fell 3.45 percent, so demand kept meeting supply into weakness rather than retreating with the price.
Why not trust the golden cross signal?
The two moving averages that cross are built from months of prior closes, so the event lags the move that caused it. We also have no golden-cross base rates wired into our data, so we will not quote a hit rate we cannot verify.
What would invalidate the constructive lean?
A second straight session of net ETF outflows that drags the five-day net negative and breaks the MCP ETF-tide grade below 40. That would turn the read from absorption into distribution: the dip meeting soft demand rather than steady buyers.
Crypto trading involves substantial risk and is not suitable for everyone. Nothing here is financial advice; it is education only. Never risk more than you can afford to lose.
The private Extras feed, where the ETF-tide grade, five-day net flows and the price-versus-flow absorption divergence update intraday with invalidation levels, is part of PRO Paradiser, the intelligence layer behind the ParadiseFamilyVIP strategies.












Join the discussion 1
for me, the basis compression on perp's vs spot is the clearer signal for identifying underlying demand, especially if the ETF inflows persist through larger delta selling.