

In short
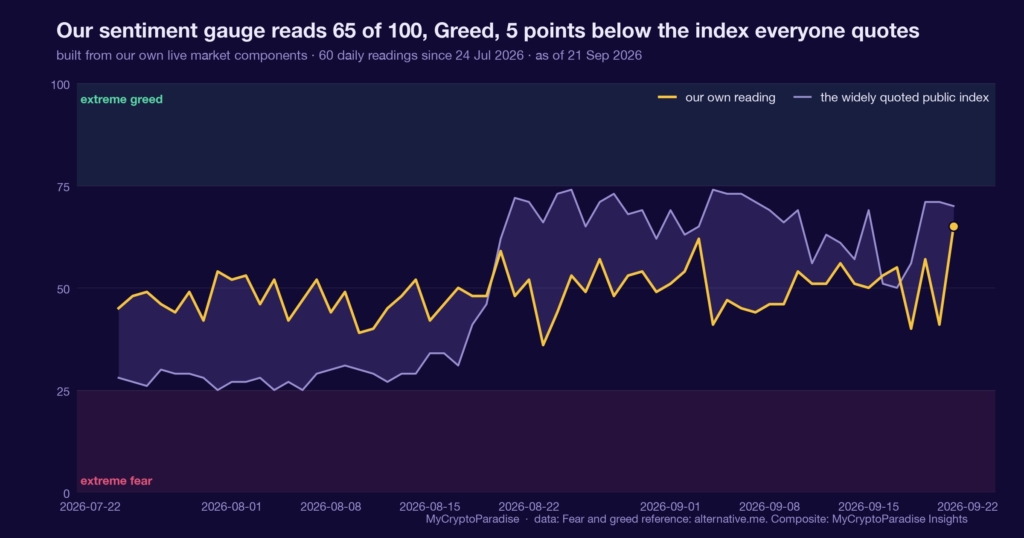
The Fear and Greed Index compresses volatility, momentum, demand, and positioning into one score from zero to one hundred, where high means the crowd is comfortable. Our MCP Insights fear and greed data put it at 65, inside the Greed band, on 21 September 2026, up from the mid-40s neutral zone in late July. We called it neutral, not a top: a mid-greed number is a description of mood, not a sell trigger. The honest catch is that this reading is our model estimate, not a calibrated probability, so we lean on a long peer-reference series for context. In that series of 3,119 days since 2018, days in this greed band closed higher thirty days later 53 percent of the time, with a median gain of just 1.2 percent: the flattest forward bucket of the five. This piece shows you how to read the gauge yourself, band by band.
A mood gauge measures comfort, not price
The Fear and Greed Index is a sentiment gauge. It folds several market inputs, volatility, momentum, demand, and positioning, into a single reading from zero to one hundred, where low means the crowd is frightened and high means it is comfortable.
It is a coincident indicator, not a leading one. It tells you how people feel right now, which is a fact about mood, not a forecast about the next move. The two only rhyme at extremes, and even then the timing is loose.
A gauge that tells you today’s weather is useful. A gauge that claims to know next week’s is decoration dressed as insight.
The number today, and the shorter clocks running hotter
Per our MCP Insights fear and greed data, the composite read 65 on 21 September 2026, inside the Greed band that runs from 56 to 75. That is up from the mid-40s neutral zone in late July, when our series printed 42 on 30 July and 54 the next day.
The composite is built from five live component reads, and its own direction flag is neutral, not rising. The shorter clocks run hotter: our four-hour dial sits at 84, deep in extreme greed, and the one-day dial at 74.5, near the top of the greed band. A peer reference reads 70.
One honest caveat sizes everything below: this composite is our model estimate, not a calibrated probability, so we read it as mood, not as odds.
What is different here
The ParadiseTeam does not trade a greed number on its own. We treat sentiment as one weight on a bias we already hold from price and positioning, then we check whether the reading is our calibrated model or a shadow estimate. A number without that provenance check is mood theatre, not evidence.
Greed is not a sell trigger, and the history says so
The reflex reading is simple: greed is high, so the top is near. The data does not support that reflex. In a long peer-reference series of 3,119 days since 2018, days that landed in this same greed band, 56 to 75, closed higher thirty days later 53 percent of the time.
That 53 percent is barely above the 54 percent all-days base rate, and the median forward gain for the band was just 1.2 percent. The neutral band below it did better, 55 percent higher and a 4.1 percent median. Greed, in other words, was historically the flattest bucket, not the most dangerous one.
This is descriptive history from a peer series, not our calibration, and the contrarian pattern did not hold cleanly. We report it as context, not as a probability we stand behind.
One input, and today it disagrees with the fast clocks
This is one indicator. It sits alongside funding, open interest, and spot demand, and today it is the reading that disagrees with itself: the composite says neutral greed while the four-hour clock says extreme greed. Split like that, the slower read usually wins on horizon, the faster one on risk.
For a trader that means posture, not entry. A mid-greed composite with a neutral direction flag argues for defence over chasing: no reason to add exposure into comfort, no reason to fade a market that has not printed extreme greed on the daily. The highest-probability move for most is to wait for the clocks to agree.
Sentiment weights a bias you already hold. It does not create one, and a piece that lets a single gauge decide anything is overstating what one mood reading can do.
What would turn this reading dangerous
The band that has historically paid was the extreme, not the middle. In the same peer series, extreme greed above 75 closed higher 60 percent of the time with a 5.6 percent median, and extreme fear below 25 did nearly as well. The tails carried the edge; the middle, where we sit, did not.
So the reading to watch for is not this one. It is a daily composite pushing into extreme greed above 75 while the direction flag flips to rising, which is when the crowd’s comfort stops being background and starts being a crowded position. Until then, 65 with a neutral flag is mood, logged and weighted.
The gauge earns its place by being honest about its own thinness: five live components, a shadow estimate, and a middle band with no edge. A reading that admits it has no signal is more useful than one that manufactures one.
Reading the fear and greed gauge yourself, step by step
- Start with the band, not the number: fear below 45, neutral 45 to 55, greed 56 to 75, extreme past those.
- Check the direction flag next, because a rising 65 and a falling 65 are two different market moods entirely.
- Compare the slow composite against the four-hour and one-day clocks; a wide split warns the move is fresh and unstable.
- Ask whether the reading is a calibrated model or a shadow estimate before you let it weight anything you trade.
- Map the band to its historical forward distribution, then treat the middle bands as noise and the extremes as the only signal.
The step people skip is provenance: a shadow estimate and a calibrated model look identical on the dial, yet only one has earned the right to size any risk.
Every number above is checkable against the live data. Start with the Crypto Fear and Greed Index, then cross-read the MCP Insights hub and the live crypto funding rates.
Act and invalidate
| Scenario | What confirms it | What kills it |
|---|---|---|
| Mood stays mid-greed | Composite holds 56 to 75, flag neutral | Daily prints extreme greed above 75 |
| Comfort overheats | Daily composite rises past 75 | Direction flag rolls back to falling |
| Sentiment cools off | Composite slips under 56 toward neutral | Fresh push back into the greed band |
Posture: Defensive and patient: a mid-greed reading with a neutral flag is no reason to add exposure and no reason to fade. Wait for the clocks to agree before it weights anything.
Frequently asked questions
Does a greed reading of 65 mean sell?
No. In a long peer-reference series, days in the 56 to 75 greed band closed higher thirty days later 53 percent of the time, barely above the all-day average. A mid-greed number describes mood, not a top, and it triggers no trade on its own.
What is the Fear and Greed Index actually measuring?
It folds volatility, momentum, demand, and positioning into one score from zero to one hundred. Low means the crowd is frightened, high means it is comfortable. It is a coincident gauge of mood right now, not a forecast of the next price move.
Why call this a model estimate and not a fact?
Our composite currently runs as a shadow estimate built from five live components, not a calibrated probability that has passed its gate. We report the 65 reading as mood we weight, not as odds we stand behind, because provenance decides how much a number can size.
Which sentiment band has historically mattered most?
The extremes, not the middle. In the peer series since 2018, extreme greed above 75 closed higher 60 percent of the time and extreme fear below 25 nearly matched it. The greed band we sit in was the flattest, with a 1.2 percent median forward gain.
How should a trader use this reading today?
As posture, never as an entry. A mid-greed composite with a neutral direction flag argues for defence over chasing: no case to add into comfort, no case to fade a market that has not overheated on the daily. Wait for the slow and fast clocks to agree.
Crypto trading involves substantial risk and is not suitable for everyone. Nothing here is financial advice; it is education only. Never risk more than you can afford to lose.
The private Extras feed, where the fear and greed composite, its band-level forward distribution, and the multi-clock split update with their invalidation levels, is part of PRO Paradiser, the intelligence layer behind the ParadiseFamilyVIP strategies.














Join the discussion 8
Mid-greed... that's where the old engine starts to rattle sometimes, feels like it's going nowhere fast. Benny's right, easy to get chopped there.
That idea of a "flattest band" in mid-greed is interesting, especially compared to how premiums usually behave. 🤔 Does the author distinguish between spot and perp basis here, or is it a general observation across the board?
yeah i avoid mid-greed too benny, its where i make the most small mistakes from not checking my own charts before going in.
Mid-greed always has me checking the clock, like is it lunch or is the engine really rattling Benny? 😅 The flat band is a sneaky one, makes ya think it's all smooth sailing sometimes ⛵️📉.
yeah mid-greed is always where i get chopped up bad, right? maybe i need to watch the 1m more when we're there. 🫠
hahaha yeah the 1m is tricky 😵💫 but also that low volume in mid-greed always gets me, its like a trap!! 📉
so you think you get chopped because you look at the 1m too much there, not that the volume profile might be thinning out.
The 'flattest band' assessment seems somewhat subjective here. My data on perp premiums suggests a wider basis variance in this range, particularly after Q1 2021.