

In short
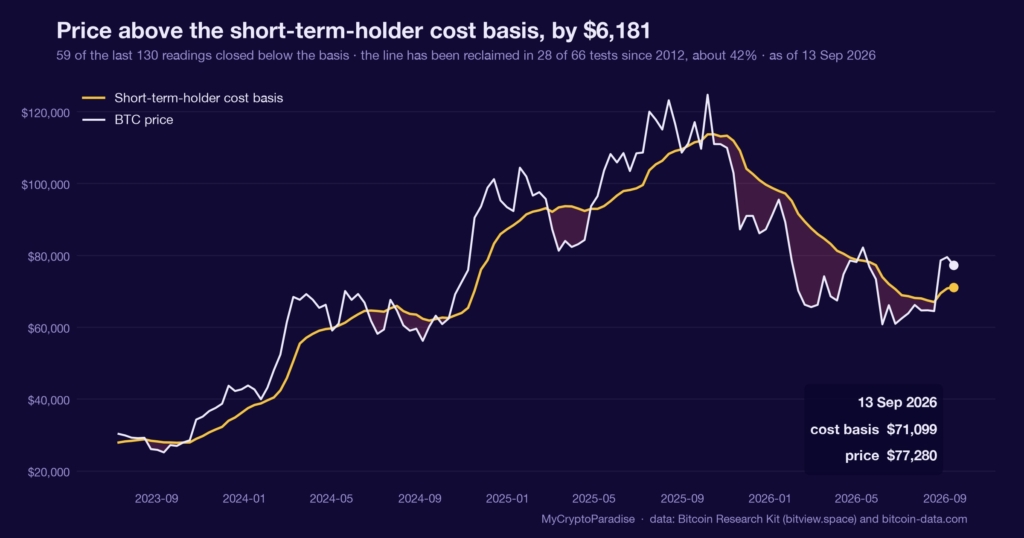
Cost basis is the average price at which a group of holders bought their coins, so it marks the line between paper profit and paper loss. On 13 September 2026 Bitcoin traded at $77,280, about 45 percent above the market’s realized price of $53,191 and roughly 8 percent above the short-term-holder cost basis of $71,099. That is a real profit cushion, and we call it constructive. We do not call it euphoria: our MCP Insights cost-basis data shows 35.4 percent of short-term-holder supply still underwater, and SOPR sits at 1.0012, meaning the coins that move are barely in profit. Across 66 comparable readings since 2012 the configuration resolved higher only about 42 percent of the time, inside a 16-point error band. This piece shows you how to read Bitcoin cost basis yourself, the buffer and the underwater share together.
Key facts
- Bitcoin price at the reading
- $77,280
- Short-term holder cost basis
- $71,099
- Price against that cost basis
- $6,181 above
- Share of short-term holder supply underwater
- 35.4%
- State
- price above the short-term-holder cost basis
- What would prove this read wrong
- A daily close below the short-term-holder cost basis of $71,099, which turns the profit buffer into overhead supply and puts the underwater third in control.
- Reading taken
- 13 September 2026
- Source
- Our MCP Insights tools, from Bitcoin Research Kit (bitview.space) and bitcoin-data.com. Upstream data published by the Bitcoin Research Kit
Cost basis is a memory of what holders paid
Every coin has a price at which it last moved. Aggregate those prices across a group of holders and you get a cost basis: the average line separating the coins sitting in profit from the coins sitting in loss.
Two cohorts matter most. Short-term holders, the newest buyers, set the reactive floor: they sell fastest when price slips under what they paid. Long-term holders sit far lower and rarely flinch.
The realized price is the same idea for the whole market. When spot trades well above it, the average holder is in profit, and the question stops being survival and becomes whether that profit tempts them to sell. A cost basis does not predict: it tells you who is comfortable and who is trapped.
The 13 September reading: a cushion with a caveat
Per our MCP Insights cost-basis data, Bitcoin closed 13 September 2026 at $77,280. That is 45 percent above the realized price of $53,191, about 8 percent above the short-term-holder cost basis of $71,099, and far above the long-term-holder basis of $49,404.
The buffer above the short-term line runs $6,181, or 6.45 times the daily range, which scores 89 on our internal reading. Yet 35.4 percent of short-term-holder supply, some 1.24 million of 3.51 million coins, still sits underwater.
Our MCP Insights SOPR data adds the other half: the spent-output profit ratio (SOPR) reads 1.0012, so coins in motion are barely above breakeven, while the long-term-holder ratio sits at 1.1147. Profit is real and thin at the same time: the market is comfortable in aggregate and crowded with recent buyers who are not.
What is different here
The ParadiseTeam does not read a cost-basis buffer as a target or a trigger. We measure the distance between price and each cohort’s paid-in line, weight it by how much supply sits underwater, and treat the result as one probability input among several, never as a standalone call.
Why the profit cushion is not a green light
The obvious misread is to treat a 45 percent gain over realized price as room to run. History says otherwise: in our own cost-basis record, 66 comparable configurations since 2012 resolved higher only about 42 percent of the time.
That 42 percent carries a 16-point error band. A number that swings from the high twenties to the high fifties depending on the window is not an edge: it is a coin flip wearing a decimal point.
This is one input. It sits alongside funding, open interest and spot absorption, and on its own a cost-basis buffer weights a bias rather than setting one. A gauge that admits it has no edge is more honest than one that always finds a signal.
The tell is who is underwater, not the average
Aggregates hide people. Price sits above the short-term cost basis, yet a third of short-term supply bought higher and is now nursing a loss, which is the fuel for sharp, shallow flushes on any dip toward $71,099.
SOPR near 1.0 says the last wave of sellers is close to exhaustion, not to euphoria. Recent episodes make the point: on 2 May 2026 price tested the short-term line and defended within two days, while on 16 May it tested and was rejected inside a day.
The two outcomes, fourteen days apart, resolved in opposite directions from a near-identical setup. Same gauge, same level, different result: which is exactly why the level matters more than the forecast.
Where this reading sits among the others
A cost-basis buffer is a probability weight on a bias, never the bias itself. Today it leans constructive: price is comfortably above the lines that matter, and the market as a whole is in profit rather than defending survival.
But the same data names its own limit. The 42 percent forward rate and the 16-point band say this gauge, alone, does not have an edge, and the underwater third says the profit is unevenly held.
Stacked against funding, open interest and spot absorption, the cost-basis read is the layer that tells you how much room the average holder has before selling becomes tempting. Read one gauge and you get a hunch: read them together and you get a probability.
Reading Bitcoin cost basis yourself, step by step
- Start with the realized price, the market’s average paid-in level, and measure how far spot trades above or below it in percent.
- Split holders into short-term and long-term cohorts, because the newest buyers react first and set the level any dip will test.
- Read the buffer in volatility units, not dollars: distance divided by the daily range tells you whether a cushion is real.
- Check the underwater share, the percent of a cohort holding at a loss, because averages hide the sellers a dip can trigger.
- Cross-read SOPR near 1.0 as seller exhaustion or euphoria, then weigh the whole picture against funding and open interest before concluding.
The step people skip is the underwater share. A market can sit above its cost basis while a third of recent buyers hold at a loss, the gap where dips accelerate.
Every number above is checkable against the live data. Start with the MCP Insights hub, then cross-read the Crypto Fear and Greed Index and the live crypto funding rates.
Act and invalidate
| Scenario | What confirms it | What kills it |
|---|---|---|
| Cushion holds | Daily close stays above $71,099 | Close below the short-term cost basis |
| Shallow flush, then bid | Dip to $71,099 defended within two days | Underwater share climbs as price falls |
| Buffer fails | Daily close under $71,099 | Reclaim of $71,099 within one day |
Posture: Neutral with a constructive tilt while price holds its short-term cost basis. The buffer favours patience over chasing, and the underwater third argues for defence on any test of $71,099. No trade is a legitimate outcome here.
Frequently asked questions
What is Bitcoin realized price?
Realized price values every coin at the price it last moved, then averages across the whole supply, which approximates what the average holder paid. On 13 September 2026 it stood at $53,191, with spot 45 percent higher at $77,280.
Is a 45 percent profit cushion bullish?
It is constructive, not decisive. Our own cost-basis record shows 66 comparable readings since 2012 resolved higher about 42 percent of the time, inside a wide error band. A cushion weights a bias: it does not confirm one on its own.
Why does the underwater share matter?
Averages hide people. Even with price above the short-term cost basis, 35.4 percent of short-term-holder supply was bought higher and sits at a loss on 13 September 2026. That trapped supply is the fuel for fast, shallow flushes on a dip.
What does SOPR near 1.0 tell you?
SOPR, the spent-output profit ratio, reads 1.0012, meaning coins changing hands are barely above breakeven. That points to seller exhaustion rather than euphoria, though the long-term ratio at 1.1147 shows older coins leaving at a healthier gain.
What would invalidate this constructive read?
A daily close below the short-term-holder cost basis of $71,099 flips the buffer into overhead resistance and puts the underwater third in charge. Until then, price holding above its paid-in line keeps the lean constructive rather than defensive.
Crypto trading involves substantial risk and is not suitable for everyone. Nothing here is financial advice; it is education only. Never risk more than you can afford to lose.
The private Extras feed, where the cost-basis buffer, underwater share and SOPR reads update daily with their invalidation levels attached, is part of PRO Paradiser, the intelligence layer behind the ParadiseFamilyVIP strategies.











Join the discussion 4
realized price is a good signal to watch I think it shows a lot of what people are feeling not just the numbers
Yes, I see that. It can show where people entered too, which is helpful for context... thank you.
yeah, the realized price always feels like a good sanity check... helps me remember rule number 5... always respect the range... especially when things get choppy.
45% above realized price and 1/3 underwater... that 1/3 number for short-term holders feels like a rounded estimate without a clear methodology. How is that even calculated precisely?!