

In short
A spot bitcoin exchange-traded fund (ETF) net flow measures the dollars allocators create or redeem in a fund each day. Absorption is what it looks like when those dollars arrive and price does not move. On 31 August 2026 the reported tally was a $217 million net inflow into US spot bitcoin ETFs, led by BlackRock’s IBIT at roughly $206 million, with spot ether funds adding $87.68 million; those figures are the Insider feed’s, dated one day after our own data. Per our MCP Insights ETF-tide reading, as of 26 August the tide grade sat at 53 on an eight-day inflow streak, yet price softened 0.57 percent over five sessions. We called it neutral, explicitly not a green light. In roughly 11 of 22 comparable tide readings since 9 April 2024, price resolved higher within ten trading days: a coin flip, not an edge. This piece shows you how to read ETF absorption yourself.
Key facts
- Latest session net flow
- $232.2M
- Net flow over the last five sessions
- $1.80B
- Cumulative net flow since January 2024
- $54.66B
- What would prove this read wrong
- A second straight session of net ETF outflows that snaps the eight-day inflow streak and drags the MCP ETF-tide grade below 40 from its current 53.
- Reading taken
- 26 August 2026
- Source
- Our MCP Insights tools, from Farside Investors and SoSoValue. Upstream data published by Farside Investors
Flows and price can disagree
An ETF net flow is a primary-market number. When an allocator wants exposure, an authorized participant creates new fund shares and buys the underlying bitcoin to back them, and that purchase becomes the inflow you see reported. Redemptions run the same machine in reverse.
Spot price is a secondary-market number, set by every buyer and seller on the exchanges, most of whom never touch an ETF. The two are linked, but loosely, and they can point in opposite directions for days.
When creations stay positive and price refuses to rise, someone is selling into that allocator demand at the same pace it arrives. That is absorption. It is neither bullish nor bearish on its own: it is a question about who runs out first, the buyers or the sellers meeting them.
The 31 August reading, and the day before it
The reported figures for 31 August 2026 are these: a $217 million net inflow into US spot bitcoin ETFs, with BlackRock’s IBIT supplying roughly $206 million of it. Spot ether ETFs took in $87.68 million, and BlackRock’s ETHA carried about $59.94 million.
Those numbers are the Insider feed’s, dated one session after our own series ends, so we hold them at the feed’s word rather than our own.
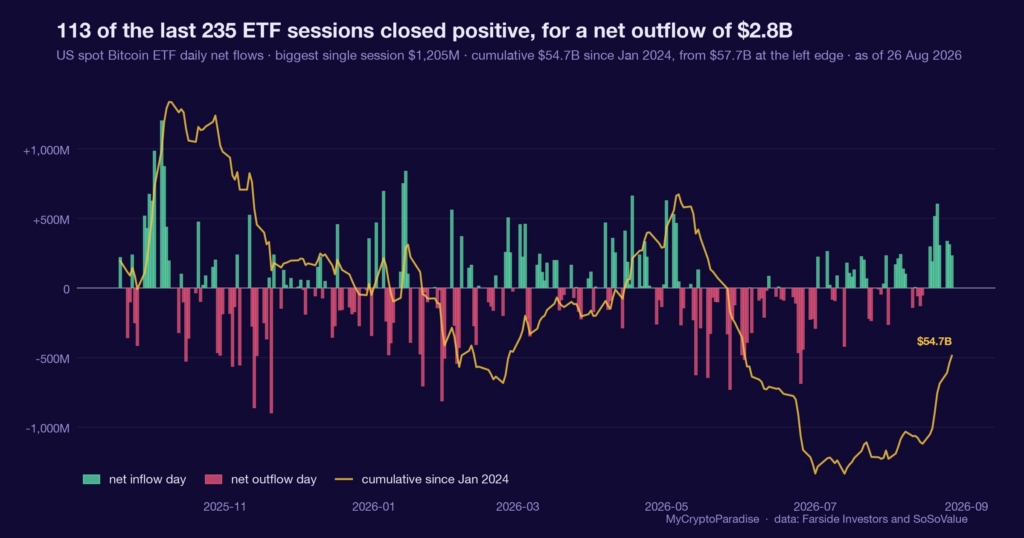
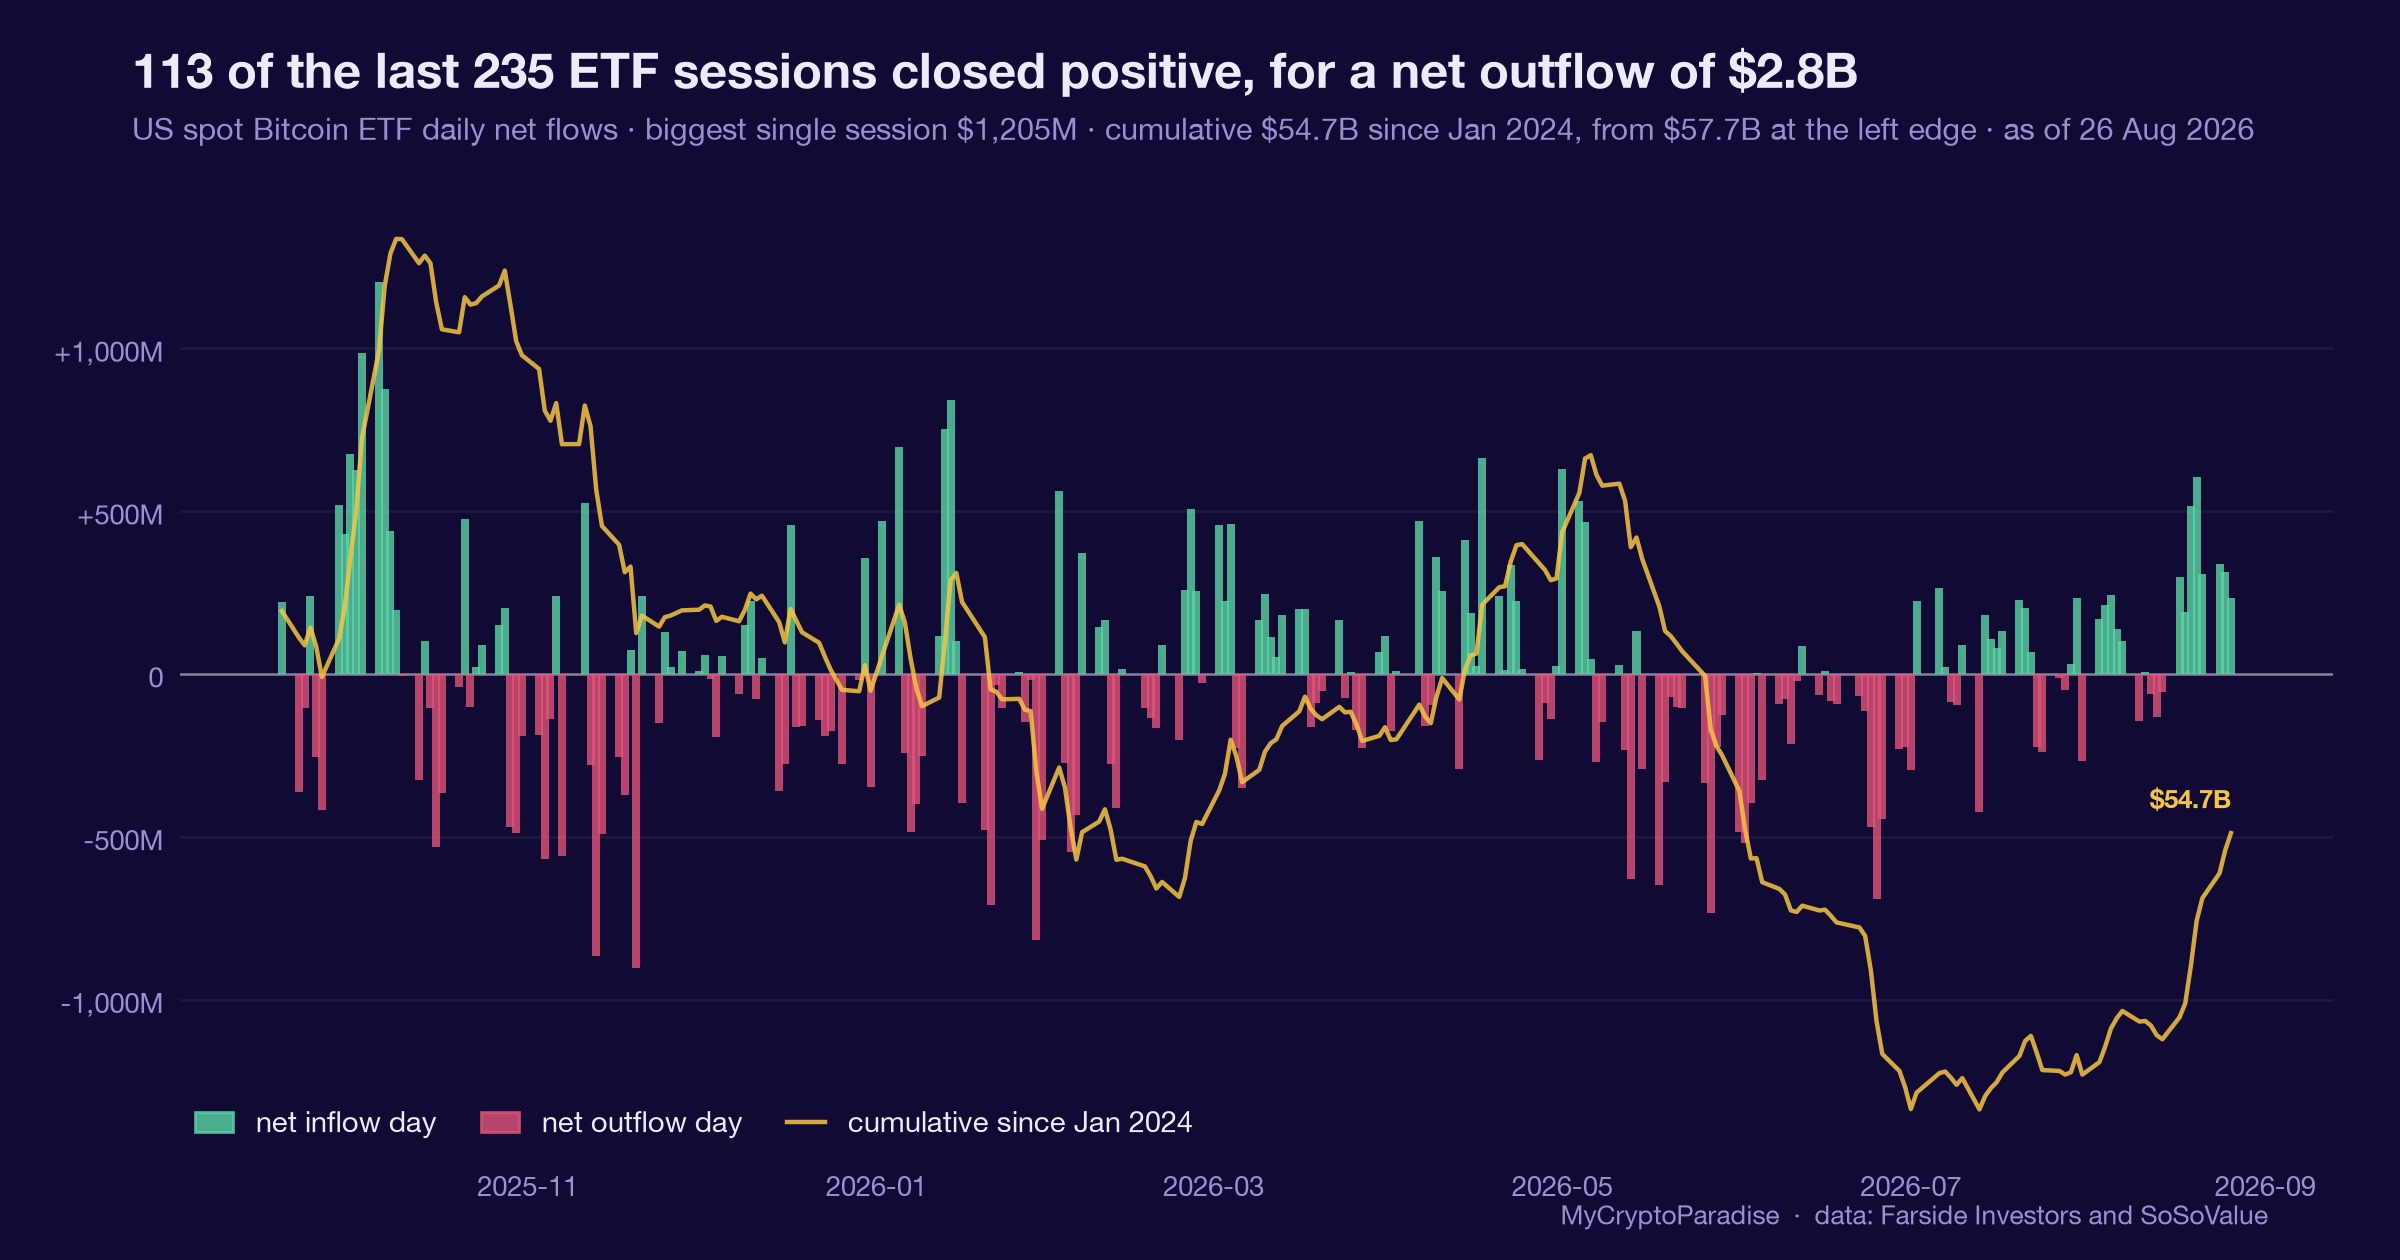
Our own MCP Insights ETF-tide data runs to 26 August 2026 and tells the fuller story. The tide grade reads 53 on a 0-to-100 scale, an eight-day inflow streak was live, and net creations over the trailing five sessions totalled about $1.8 billion.
Cumulative net flow since launch stood near $54.66 billion, with IBIT alone at roughly $63.1 billion; our Bitcoin ETF flow tracker carries the same streak and cumulative curve.
Against all of that, price returned minus 0.57 percent over the same five sessions. Our tide model flags the split by name: positive flows, soft price, allocator absorption. Per Farside Investors and SoSoValue, the eight-day streak is real demand meeting a market that has not moved on it.
Eight days of inflows that price ignored is not a rally postponed. It is a standoff.
Record inflows are not a buy button
The easy misread is to see eight straight days of inflows and a $217 million headline and treat it as confirmation to add. The tide grade of 53 argues against that.
Fifty-three is the middle of a 0-to-100 scale, a market leaning in but not committed, and the soft price says the lean has met resistance.
This is one input. It sits alongside funding, open interest and spot absorption, and today it is the reading that disagrees with the bullish flow number on its surface. The deeper layers that would tip a coin flip either way live in PRO Paradiser, not in any single day’s flow print.
Absorption is exactly the state where the confirming half of the data and the disconfirming half are both true at once. Flows are real. Price weakness is also real. A read that quotes only the inflows is marketing; the flat price is what sizes the risk.
What is different here
The ParadiseTeam does not read a flow number in isolation. Most feeds report the $217 million inflow and stop; our method pairs every creation print against price and labels the gap, so an eight-day streak that the market ignores registers as absorption, not as a green light to chase.
Which side pays to be wrong
Put a probability on it and the honesty shows. In roughly 11 of 22 comparable ETF-tide inflow readings since 9 April 2024, price resolved higher within the following ten trading days. That is an up-rate near 51 percent: a coin flip with a spreadsheet attached, not an edge.
So the absorption resolves one of two ways, and neither is yet favoured. Either the sellers meeting these inflows exhaust, and price finally tracks the flow it has ignored for eight days. Or the flow is quietly financing distribution, and the soft price is the early tell that the larger seller wins.
We do not know yet, and saying so is the read. The neutral call holds until the flow streak or the grade breaks. A tide grade of 53 is a gauge admitting it has no strong edge, which is more useful than one that manufactures a signal every day.
Reading ETF absorption yourself, step by step
- Pull the daily net flow for US spot bitcoin ETFs and confirm the direction of the trailing multi-day streak.
- Read the tide grade on its 0-to-100 scale: above 60 is committed inflow, near 50 is a lean, below 40 is outflow pressure.
- Lay the trailing five-session price return beside the flow: same direction confirms, opposite direction is your absorption flag.
- Check which funds carry the flow, since one issuer supplying most of a print is thinner demand than a broad bid.
- Mark the level or session that would snap the streak or break the grade, and treat that as your invalidation.
The step most skip is the fourth: a $217 million day is not one bid when a single issuer supplies almost all of it, and concentration is fragility.
Every number above is checkable against the live data. Start with the Bitcoin ETF flow tracker, then cross-read the MCP Insights hub and the Crypto Fear and Greed Index.
Act and invalidate
| Scenario | What confirms it | What kills it |
|---|---|---|
| Absorption resolves up | Price tracks the 8-day inflow streak higher | A daily close back below recent range |
| Absorption caps the market | Flows stay positive, price keeps stalling | A second straight net outflow session |
| Neutral holds | Tide grade lingers near 53 | Grade breaks above 60 or below 40 |
Posture: Defensive-to-flat while flows and price disagree. The higher-probability stance for most is no fresh risk until the streak or the grade resolves the standoff.
Frequently asked questions
What does a bitcoin ETF net inflow actually mean?
It is the net dollars allocators added to US spot bitcoin ETFs in a session, created as new fund shares backed by purchased bitcoin. A $217 million print means creations beat redemptions by that amount on 31 August 2026.
Why is the price soft if inflows are positive?
Because ETF creations are only one source of buying, and the wider spot market can sell faster than allocators buy. When positive flows meet a flat price for days, sellers are absorbing the demand at the same pace it arrives.
What is the MCP ETF-tide grade telling us?
The tide grade scored 53 on a 0-to-100 scale as of 26 August 2026, which places the flow regime in the middle: a lean toward inflows, not a committed one. Near 50 the gauge is honestly admitting it has no strong edge.
Is a $217 million inflow a reason to buy?
On its own, no. In roughly 11 of 22 comparable tide readings since 9 April 2024, price resolved higher within ten trading days, a near coin flip. A single flow print is one input among funding, open interest and spot absorption.
What would flip this neutral read bearish?
A second straight session of net ETF outflows that snaps the eight-day inflow streak and drags the MCP ETF-tide grade below 40 from its current 53. That combination would turn allocator absorption into confirmed distribution rather than a standoff.
Crypto trading involves substantial risk and is not suitable for everyone. Nothing here is financial advice; it is education only. Never risk more than you can afford to lose.
The private Extras feed, where the ETF-tide grade, the multi-day flow streak and the price-versus-flow absorption flag update daily with invalidation levels, is part of PRO Paradiser, the intelligence layer behind the ParadiseFamilyVIP strategies.














Join the discussion
No comments yet. Members, share how you are reading this.