

In short
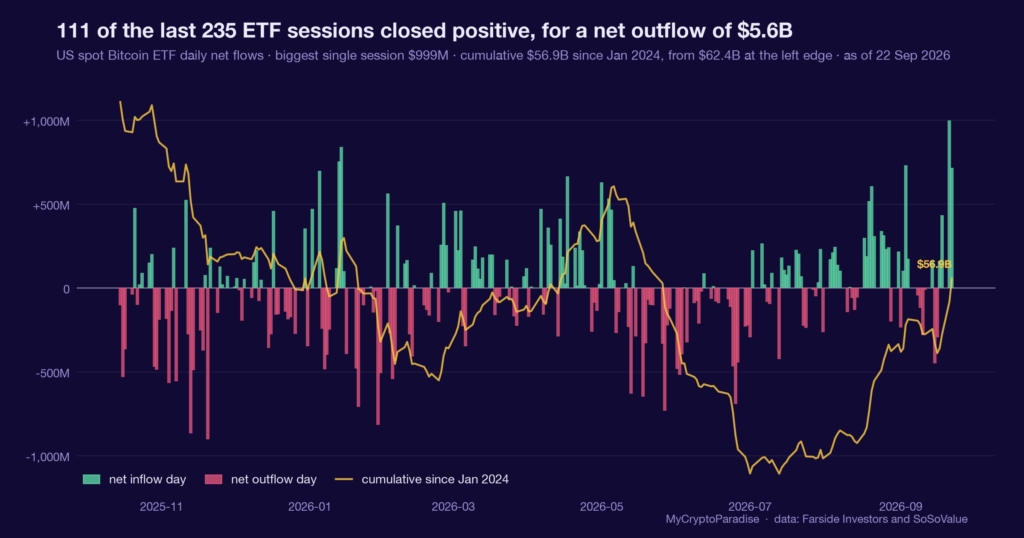
The ETF inflow impulse measures how forceful the last few days of US spot Bitcoin exchange-traded fund (ETF) buying are against the whole two-year history of daily flows. On 22 September 2026 that impulse printed at the 97th percentile: $714.7 million arrived in a single session, a fourth straight inflow day, while Bitcoin ran up 12.8 percent over the same five sessions. Flows and price moved together, not against each other. We called this constructive but unconfirmed, explicitly not a continuation edge, because our own ETF-tide model estimate still grades the setup at 53 out of 100, a coin flip inside a 17-point band. The impulse is loud; the edge is not yet there. This piece shows you how to read the ETF inflow impulse yourself, separate a forceful few days from a durable trend, and set the level that would prove it wrong.
Key facts
- Latest session net flow
- $714.7M
- Net flow over the last five sessions
- $2.01B
- Cumulative net flow since January 2024
- $56.94B
- What would prove this read wrong
- A net outflow day that breaks the four-day inflow streak and drags the five-day net back toward zero, dropping our ETF-tide grade below 50; or the divergence flag returning to active with price rising while flows turn negative.
- Reading taken
- 22 September 2026
- Source
- Our MCP Insights tools, from Farside Investors and SoSoValue. Upstream data published by Farside Investors
What an inflow impulse actually measures
An inflow impulse ranks the most recent burst of ETF buying against the entire record of daily flows since these funds launched. It answers one question: how unusual is the last handful of days?
A high reading means the recent inflows are heavy relative to almost everything that came before. It says nothing, on its own, about whether that pace holds. Force and persistence are different properties.
That distinction is the whole discipline here. A percentile near its ceiling tells you the recent days are rare, not that the next day repeats them.
The reading on 22 September
On 22 September 2026 our MCP Insights ETF-tide data put the inflow impulse at the 97th percentile of every daily flow since April 2024. A single session drew $714.7 million, the fourth straight inflow day.
Over the same five sessions Bitcoin rose 12.8 percent, and the funds added roughly $2.01 billion across that window. Cumulative net flows now stand near $56.94 billion. Flows and price moved in the same direction, with no divergence flagged.
Yet the same tool grades the setup at 53 out of 100, unchanged on the day, inside a 17-point band. That grade is a model estimate, not a calibrated frequency: an estimated up-rate near 51 percent across 22 effective windows, over a 10-trading-day horizon.
A 97th-percentile impulse next to a 53 grade is not a contradiction. It is the difference between how loud the move is and how much edge our own record says it carries.
Why a 97th-percentile impulse is not a green light
The easy misread is that record buying forces price higher from here. It does not. The impulse measures how forceful the recent days were, and forceful days cluster near tops as often as near the start of a trend.
Our own grade says as much. At 53, and as a model estimate that has not cleared its calibration, the tide reads as close to a coin flip over the next two trading weeks. Confidence in the impulse is not confidence in the outcome.
This is one input. It sits alongside funding, open interest (OI) and spot absorption, and today it is the loud reading that our own grade will not yet confirm.
A gauge that reports its own uncertainty is worth more than one that always finds a trend. The 17-point band is the honest part of this reading.
What is different here
The ParadiseTeam does not read a flow headline and stop there. We rank the last few days of ETF buying as a percentile against the full two-year record, separate force from persistence, and pair that impulse with our tide grade so a loud few days is never mistaken for a durable edge.
What the flow-price alignment does confirm
There is a real signal in the alignment. For weeks our readings tracked flows falling while price held, or a green day masking a red week. This time flows, price and the streak point the same way, and no divergence is flagged.
The source event credits squeezed shorts with adding fuel to the run. That is plausible: forced short covering and fresh ETF demand can stack, and a crowded short book pays to be wrong on the way up.
Alignment removes the usual tell. When flows and price disagree, the gap is the thing to study. When they agree, the risk hides in assuming agreement lasts.
What the next ten sessions decide
The tide grade looks ahead about ten trading days, so that is the window this reading actually covers. Inside it, two things resolve the tension between a 97th-percentile impulse and a coin-flip grade.
The first is persistence: whether inflows keep arriving or the streak breaks with an outflow day. The second is alignment: whether flows and price keep moving together, or the divergence flag flips back to active.
Neither is knowable today, and pretending otherwise would be the mistake. The impulse earns attention; the grade earns patience; the invalidation earns the discipline to change your mind.
Reading the ETF inflow impulse yourself, step by step
- Pull the daily US spot Bitcoin ETF net flows and line them up against the full history since these funds launched.
- Rank the last four or five sessions as a percentile of that record, so you measure force rather than the raw dollar figure.
- Check whether price moved the same way over the same window, or whether flows and price are pulling apart.
- Read the tide grade beside the impulse, and treat any estimated grade as a model view, not a settled probability.
- Write the invalidation first: the outflow day and grade level that would say the impulse has faded.
The step people skip is the percentile. A raw two-billion-dollar week sounds decisive, but ranked against the record it may be ordinary, and that ranking is the entire point.
Every number above is checkable against the live data. Start with the Bitcoin ETF flow tracker, then cross-read the MCP Insights hub and the Crypto Fear and Greed Index.
Act and invalidate
| Scenario | What confirms it | What kills it |
|---|---|---|
| Impulse holds, trend extends | Fresh inflow days, grade climbs above 50 | A net outflow day breaks the streak |
| Loud burst, no follow-through | Impulse stays high, price stalls | Grade slips below 50, flows cool |
| Flows and price re-split | Price rises as flows turn out | Divergence flag returns to active |
Posture: Patient and mildly constructive. The momentum is real while the inflow streak and the impulse hold, but a 53 grade does not size an aggressive bet, so treat the alignment as a lean worth one line of risk.
Frequently asked questions
What does a 97th-percentile ETF inflow impulse mean?
It means the last few days of US spot Bitcoin ETF buying rank near the top of every daily flow since the funds launched in 2024. It measures how forceful recent inflows are, not whether that pace continues.
Does record ETF buying mean price will rise?
No. Force and persistence are different things. On 22 September our ETF-tide model estimate graded the setup at 53 out of 100, close to a coin flip, even with the impulse near its ceiling. Heavy buying can cluster near tops.
Why does the tide grade sit at only 53?
The grade blends flow strength with how such setups tend to resolve, then reports its uncertainty as a 17-point band. At 53 it sees roughly even odds over the next ten trading days, and it is a model estimate, not a calibrated frequency.
What would invalidate the constructive lean?
A net outflow day that breaks the four-day inflow streak and drags the five-day flow back toward zero, dropping our tide grade below 50. A return of the divergence flag, with price rising as flows turn negative, would also cancel it.
How do squeezed shorts add to an ETF rally?
Forced short covering means traders who bet against price must buy to close, adding demand on top of fresh ETF inflows. When both stack, moves accelerate, but the fuel is finite and fades once the crowded shorts are cleared.
Crypto trading involves substantial risk and is not suitable for everyone. Nothing here is financial advice; it is education only. Never risk more than you can afford to lose.
The private Extras feed, where the ETF inflow impulse, tide grade and flow-price divergence read update intraday with their invalidation levels, is part of PRO Paradiser, the intelligence layer behind the ParadiseFamilyVIP strategies.














Join the discussion 7
i'm not sure the "impulse" can be separated from the durable edge here. those inflows are clearly concentrated. source for the percentile calculation?
Hmm, that 97th percentile inflow feels a little... manipulated, almost? 🤔 It's hard to shake the feeling some big players are behind that push, even if the tide grade isn't moving.
I'm seeing this more like a "fear of missing out" impulse for the inflows 🤔. People want to jump in fast 🚀 when price moves, but then what happens? 📉
I always have to squint at "impulse" vs "tide grade." Makes me remember when I saw a queue at a restaurant and thought "busy means good," but it was just for the toilet! 😅
The 97th percentile means nothing if it doesn't move the bid. Volume is liquidity, always.
Elif I agree. we have to consider if those flows are new money or just shifts from existing holders into the etfs- it impacts the liquidity picture differently.
97th percentile on flows but the tide grade is 53? That's a mismatch. Where is the real volume in those inflows if it's not moving the needle?