

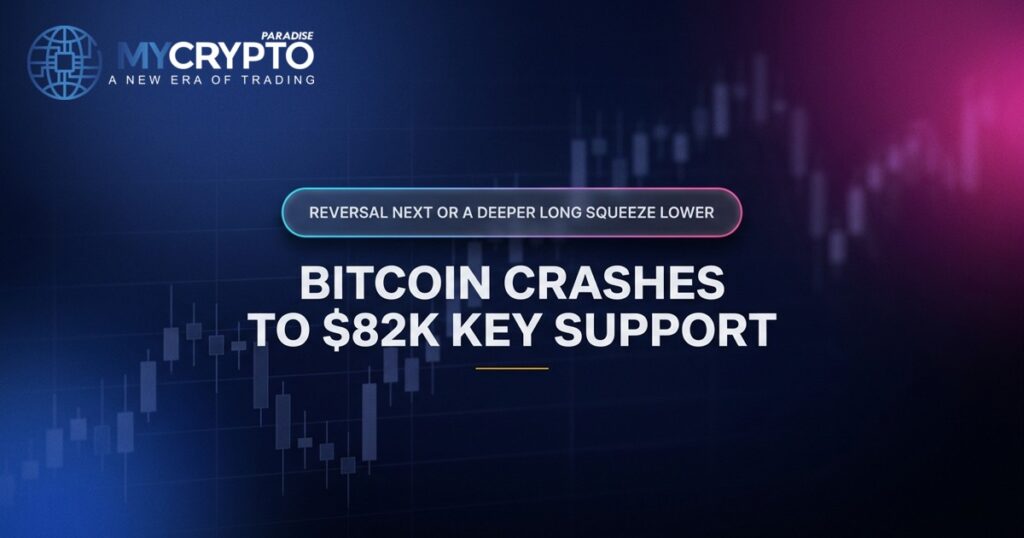
In short: Bitcoin crashed 5% into key support at $82,000 with funding still positive and longs crowded. Simon and the ParadiseTeam stay 60/40 bullish on the 4-hour toward $90,000 while price holds $82,000. But the weekly bias stays bearish toward the $55,000 to $44,000 zone. He wants confirmations before buying.
What did the Bitcoin crash to $82,000 actually signal?
Track it live: our live crypto funding rates updates in real time, so you can watch this shift for yourself.
Bitcoin crashed around 5% straight into its high time frame key support at $82,000, a level that previously acted as resistance. The ParadiseTeam flagged a short-term correction toward $84,000 in the last video. Price reacted there, then broke below it, leaving $82,000 as the line in the sand.
This $82,000 zone is the key level now. Holding above it keeps the path toward $90,000 alive, as Simon has mapped across the recent Bitcoin breakdowns.
Will $82,000 hold or does Bitcoin drop lower?
As long as Bitcoin holds above $82,000, Simon says this is likely not the final fifth wave, and a push toward $90,000 stays probable. A daily close below $82,000 opens the door toward $74,000, with Fibonacci support clustered near $79,600 and $77,700.
Simon reads heavy support from the daily Fibonacci levels. The 0.618 golden ratio sits at $79,600, the 0.786 near $77,700, and the 1.272 extension at $72,000. He sees $77,700 as a possible bottom for any downside impulse.
From a 90-day view, the liquidation imbalance leans down. A grind toward $73,000 could trigger roughly $9 billion in cumulative long liquidations, while a similar move up to $89,000 clears only around $6 billion.
What do funding and positioning say about a long squeeze?
Funding rates are still positive and longs remain crowded, which keeps a long squeeze in play. Even at support, the 4-hour long squeeze probability sits at 30%, higher than before the drop. Simon reads this positioning on the live funding and squeeze data before judging reversal odds.
Whales are still net sellers. Over the past 24 hours, 63% of whales were selling versus 37% buying. Open interest dropped hard during the deleveraging and has not rebuilt much, so few fresh positions have entered, but the ones in place stay long-heavy.
What confirmations does Simon need before buying Bitcoin?
Simon is neutral on the daily and will not buy or short fresh at this level. He wants Bitcoin to recover in five clean moves, close above $82,000, and follow volume properly. A bullish hammer or engulfing candle on the 4-hour, plus bullish momentum divergence, are his triggers.
His approach puts capital preservation first. If the setup confirms, he could enter a long with invalidation tight near $80,000 and a last target around $99,000. That tight structure reflects the ParadiseTeam focus on position sizing and capital preservation.
Where does the macro Bitcoin bias stand?
On the weekly time frame, Simon stays bearish, as he has since $121,000. He gives 60% odds Bitcoin rejects and falls toward the $55,000 to $44,000 zone, 30% to reclaim $88,000 and push to $99,000. And only 10% for a rally to a possible $169,000.
That $55,000 to $44,000 band is what Simon calls the exchange of hands zone, where he and the ParadiseTeam plan to reaccumulate. The $44,000 level has been his key number since Bitcoin traded near $19,000. The macro reversal, he stresses, is not confirmed yet.
Frequently asked questions
What price did Bitcoin crash to in this analysis?
Bitcoin crashed roughly 5% straight into its high time frame key support at $82,000. Simon notes this level previously acted as resistance, which makes it significant now. Price first reacted at $84,000 support, then broke below it, leaving $82,000 as the critical level the ParadiseTeam is watching closely.
Is Simon bullish or bearish on Bitcoin right now?
Simon is slightly more bullish on the 4-hour, but only at 60/40, down from the earlier 70/30. He stays neutral on the daily and bearish on the weekly. He will not press buy or sell fresh here and is waiting for clearer confirmation signals first.
What are the downside targets if $82,000 breaks?
If Bitcoin closes a daily candle below $82,000, Simon sees a path toward $74,000 and lower. Fibonacci support clusters at $79,600 and $77,700, with the 1.272 extension at $72,000. He views $77,700 as a possible bottom, though how price gets there matters more to him.
What would make Simon enter a long trade?
Simon wants Bitcoin to recover in five clean moves, close back above $82,000, and respect volume. He also wants a bullish hammer or engulfing candle on the 4-hour plus bullish momentum divergence. If confirmed, he could buy with invalidation near $80,000 and a last target around $99,000.
Why is the ParadiseTeam still bearish on the weekly?
On the weekly, Simon has stayed bearish since $121,000. He gives 60% odds Bitcoin falls toward the $55,000 to $44,000 exchange of hands zone, where the team plans to reaccumulate. The $44,000 level has been his key target since Bitcoin traded near $19,000.
MyCryptoParadise has run a professional crypto signals and trading-education service since 2016, led by founder Simon Mach and the ParadiseTeam. Simon records these sessions three times a week, and every episode lands on the Bitcoin video analysis hub.
Video transcript
Auto-captioned from the video audio and lightly cleaned, so it can contain transcription errors; the video itself is the record. It is speech, not a written article; for the structured breakdown read the sections above.
Bitcoin has just crashed by 5% straight into rookie support at $82,000. But funding crates are still positive and longs remain crowded. So does that mean this long squeeze [music] could continue and trigger an even larger crash? Or are the boost strong enough to defend 82,000 and create a powerful bullish reversal from here?
Let's analyze the probabilities. [music] My crypto paradise. [music] Hello ladies and gentlemen. This is Simon from my crypto paradise. Welcome back. It's great to be here. Today is Thursday and that means that you're watching the second video of this week. So previously we were looking at 4hour time frame and we have understood in the previous videos that we are bullish and we will start pushing above this contracting triangle towards $90,000.
That was when Bitcoin was trading back at $84,000. Right? So we were bullish and we expected that we will see a continuation of this breakout after we have pumped for around 5% towards around 86 to $87,000. Here in the last video I've told you that there is a lot of bearish confluences and with the highest probability we will see a short-term correction towards $84,000.
So there was a lot of bearish data that told us shortterm there will be a correction, right? So the next immediate support was at 84 $84,000. As you can see, we indeed started to correct from that $86,000. But as you can see, we have touched this support zone.
We have got some reaction right here at that support zone. But then on the next try, we have broke below it. And right now we are trading at 82,000, which is our high time frame key support. Previously it was working as a resistance as you remember.
So this is a key level ladies gentlemen. So right now given that we have went below that $84,000 the confluence of this being a corrective mode wave pattern before continuation towards $90,000 before we can finally start the macro reversal where we expect that in the next bearish wave we will push towards this zone 55 to $44,000.
As you know, since $121,000 on the weekly time frame, we are continuously bearish because we understand the macro mechanics that needs to happen and that happened since 2011 during creation of every bull market. That is also why we have been taking a look at our net unrealized profit and loss and we have seen that something has not happened during the current bare market.
That would tell us that with those probability, the bottom, the macro bottom is in and we can start pushing towards the new alltime high that we presume is going to be at $169,000, the one of the next cycle, right? So, I will not be going through this because in the previous video in the pre in the previous videos, I have been going into this with you in depth, right?
We have been going through this a lot of times already. So, I don't want to bore you with that. If you have not watched the previous videos and you don't understand what we are seeing right here, definitely watch the previous videos. But let me just remind you on the vehicle time frame, we are still bearish.
And the key level, the magical number is $44,000 that we expect to be hit for many months, right? So you you know that already from $19,000 when Bitcoin back in 2025 was trading at around $19,000. We already started to call for the $44,000 given that the major bull trend already was finished.
The five waves to the upside already were finished, right? And that was the time when we started the first corrective mode wave and then secondary corrective mode wave that was however to the upside. So it was very tricky. A lot of bulls got caught right here and they started to buy aggressively.
However, they have just provided liquidity to the bears to the smart money. If you have been in Paris on VIP, you know that we have been distributing our long-term holdings of Bitcoin exactly right here below $121,000 and then very heavily at $19,000 already right here as well.
You know that we have been already also in Paris VIP reaccumulating some of our bitcoins at $61,000 and $71,000 right here as well. And you already know that we have taken profit on both of these reaccumulations. And the last redistribution that we have made was around $86,000.
Right? So if you're in Bism, you know exactly how we do the rotation inside of our hard wallets, which is basically position trading for us. We rotate in our heart wallets between Bitcoin, between USDT and between PEXG which is basically digital gold. And most of our profits actually come from this rotation because we have two capitals in original membership of Paradis and VIP.
That's the trading capital, right? as the active trading capital and then we have the compounding capital where after some winning streaks we withdraw over the years every time the profits we make during our active trading to the hard wallets right so we are not compounding the profits in our active trading portfolio we compound it into our hard wallets it's much safer from our long-term perspective it's much better to do it like
this and in the hard wallets we compound all of all of that all of that money right and then with that money we do the position trading the rotation. So this is extremely important to understand that from the macro time frame perspective we are still bearish right and mostly we are still holding USDT.
I cannot tell you exactly like how much USDT or how much Bitcoin, how much PEXG we are holding or if any because that's just for parallel VIPs. But I can tell you that we are still waiting for lower prices to start aggressively reaccumulating the bitcoins that we were distributing below $121,000 and around $19,000.
And since 20 since 2025, we are being very patient for this exchange of the end zone which is made out of the upper boundary 55 lower boundary $44,000 to do exactly that reaccumulation. Right? So it's nicely confluencing with the net analyze profit and loss chart.
It's nicely confluencing with the technical analysis we are doing on the weekly time frame plus other data. So we understand that the cycles are being created thanks to power of smart money involved in the market and also the dump money right. So 80% of market participants are handling 20% of the money and 20% of the market participants are actually handling and 80% of the money that are circulating in the crypto markets.
That is why we need to follow the smart money in order for us to make long-term high probability trade decisions. Right? accumulation, reaccumulation. And we know that since 2011, these zones are always the macro bottoms where the hands are exchanging the hands of the dump money and the hands of the smart money, right?
So the smart money are always waiting for this exchange of the hand zone and they are waiting for the dump money the bad risk managers basically to sell them in a loss to finally start realizing their losses right and the smart money absorb that selling pressure right so we have aggressive selling on one side capitulation on one side but the market is no longer pushing heavily lower right we are not creating
some aggressive lower lows because the selling pressure has been absorbed by the smart money. Right? So once we see the net earlier profit and loss below the zero baseline and spot volume which is the smart money aggressively having higher highs and we will see on the price action that we are either creating equal lows or very slight lower lows that will tell us somebody is absorbing all of this aggressive selling pressure.
The exchange of the hands is happening and with Paris only VIPs we going to start aggressively reaccumulating our bitcoin as well. That is why me and the paris team we are monitoring the market 24/7. So like as we are doing it since 2016 we can again time it as good as possible the reaccumulation and redistribution later on.
So I do believe that the zone of exchange of the hands will be in this bare market around $55 to $44,000 still. So that is why on the weekly time frame I'm still bearish. So with the highest probability as we already established in the previous videos 60% probability that we will start rejecting from this resistance zone and dumping towards that exchange of the hand zone 55 to $44,000.
that 60% probability, 30% probability that we will start reclaiming the $88,000 and start pushing towards $99,000 which is the next most important weekly time frame resistance and only 10% probability that we will start turning this resistance into support and the bulls will start reaccumulating right here and we will have enough power to start creating the price discovery rally towards the possible next ultra high time frame target of the new alltime high
at $169,000. So that's only 10% probability. But as a professional traders, we need to make sure that we understand that anything can happen. We need to focus on our risk management the way that we are ready for black swan wins. That's events that's basically the 20% of what's happening in the market, right?
But it really comes down to 80% of your results, right? So if you're not ready for the black swan events, then you will finish like the Liverpool. And it wasn't even a black swan event. It was just a slight crash and he got liquidated all of that hedge fund that he was handling, right?
So he wasn't prepared for the black swan events. He didn't have any risk management, but he was definitely outperforming most of the other long-term hedge funds that are in the market for 20, 30 years, right? And everybody was like, "Oh my god, the Leopold is a genius." Well, yes, until the market just do something that majority of people do not expect it to do.
And as we know, the markets can stay irrational longer than you can stay solvent if you don't have a proper risk management. So my methodology and mindset about trading is capital preservation first. I would rather miss a trade than risk my or capital of our clients unnecessarily.
So we are focusing only on the highest probability trades with as good riskreward as we can because we understand it's all about like these kind of rare moments of winning streaks and losing streaks that makes the difference right and then we have these kind of outliers that makes the difference.
So 80% of the time it's like same as the market movement sideways right so we have sideways and then we have 20% of the time some big move right the same way if you have some system is the same thing right so 80% of time it's like win lose win lose lose lose and then the then the winning streaks or losing streaks starts to happen and the other day somebody asked me
like how do you how do you know you're in a winning streak or losing streak so if five trades If you win five trades in a row, you're in a winning streak. If you lose five trades in a row, you're in a losing streak.
And this is when the market portfolio should be moving somehow up or down properly if you're using some system. And then the key thing is to make sure that you understand that in these five trades if you are in winning streak only like one will will make 80% of the profits of that five trades.
Again because of the 80 20% rule. But why does it work? It only works if you have positioned your risk reward strategy well. Right? So on individual trade when you lose you should lose as small as possible but when you win you win as much as possible.
Right? So then your results are made out of these outliers. And the same thing when you lose five trades in a row, it should basically be precise. You should not have any revert prediction error, right? You know exactly when you put a trade on how much you're going to lose, right?
And if you know how much you're going to lose, you then don't get emotional because the dopamine levels will not go below baseline. So you don't need to overtrade. You don't need to try to uh you don't have this kind of feeling of trying to make the loss quickly back, right?
You are just treating your system as a marriage, not as a one night stand. Single trades, right? There should be treated as one night stands. You don't care like it doesn't matter because it's all about luck. If this trade wins or if this trade lose, right, it's it's about luck.
So you don't care about single trades, but you care about the system. So trade we need to treat as a professional traders singular trades as one night stands but our system as a marriage. Basically marriage is about making sure that you're loyal loyal to the other person right and that you are with the person during the good times and during the bad times as well.
So then when you are in some losing streak and you trust in your system because you have been back testing that over at least three 3 years right that's when you understand that the system is actually can be long-term profitable or not you believe in that system and then you can follow it into bad times so you can then experience the good times right and the key distinguish distinction is that if
you have great system that basically is having an edge in the market then you are losing in the losing streaks less money than what you're going to win during winning streaks. Okay? And that's just then it's just about keep on following your system.
It shouldn't give you any excitement because when you win, you know exactly how much you're going to win because you have pre- set up that trade for yourself. And when you lose, you know exactly how much you're going to lose, right? So you don't need to be in this kind of emotional turbulence.
A lot of traders are and a lot of traders are acting as gamblers for some reason, right? When you go into the casino, you also don't expect what you're going to get. That's what's called positive or negative prediction error. So then when you win like a jackpot in the slot machine, it really gets you hooked because you have not expected that, right?
Positive prediction error. And then when when you lose, you have a negative prediction error that doesn't feel good to your brain and you're trying to make it quick back as possible. How gambling more, right? And that's how the machines, the slot machines, the roulette and other games in the casino keeps you hooked.
You keep on playing because you don't understand what's going to happen next. And then you sometimes have a dopamine spike, right? You put your dopamines above the baseline and that gets you hooked because it feels very good. Winning money feels good. And when you lose, you are trying to feel better again.
How? By pulling the lever, right? So you don't expect what you're going to get. That is how you can see on social media. Uh some people call in, oh my god, I have just made like 50x of my portfolio on this singular trade.
That's amazing. Absolutely amazing. But is it because of some strategy? Is it because of some system or you purely got lucky? Right? So with the highest probability this guy just got lucky and we can we can assume that it's a similar thing when somebody hits a jackpot in a casino.
Right? So probably if this trader will continue to keep on doing with this strategy his trading he will start losing everything because he has no edge. He was just lucky. So this is extremely important to understand from a provisional trading perspective and that is also why we are following risk management, precise risk management because then it's just about the survivor, right?
It's about making sure that we give enough time to the probabilities to play out in the long run. That's why we need to have the risk management to slow the process down, right? to give the probabilities enough time to start playing out because we understand the short run we can there there is the luck involved and we can get sometimes unlucky sometimes lucky and without a proper risk management we cannot have
a long-term profitable strategy. So, let's right now zoom in into what's happening right here. And as long, ladies and gentlemen, as we can hold above that $82,000, there is still a very high probability that this sequence right here was not the final fifth wave of our expanded flat ABC, right?
And we can still have a move higher towards that $90,000, right? $90,000. That is still quite a high probability that we can push to before we will have the high time frame reversal to the downside. However, I'm not going to lie to you.
The fact that we have broken below the previous low which might have been previously we have been looking at this as a contracting triangle, right? and we will we will get back to it and I will also tell you why this cannot be already anymore contracting triangle.
But first let's take a look what's happening behind the scenes because something is really not beneficial right now for bulls. All right and the bulls will need to show an extreme strength at this moment to be able to defend all of that cumulative long liquidation below us.
So, we were looking at it in the previous video already, right? From the 180 days, but take a look just from the 90-day perspective, right? Still there is a big imbalance. If you will start pushing towards $73,000, we will liquidate during that move.
Cumulative long liquidation possible $9 billion. All right. If we will keep grinding the similar length but to the upside only around well there is pretty much nothing but only around $6 billion if you will push towards $89,000. All right. So for the market makers still it would be easier to keep pushing to the downside.
And if it's going to happen ladies gentlemen if it's going to happen that will mean that this is really indeed the fifth wave. And if we will keep on pushing and we will push below that $82,000 and close a daily below it and we even continue lower towards that $74,000 which would be around here which would be below the previous low of that fourth wave.
Right? That will mean that we are already creating a third wave. Third wave of a possible impulse in an opposite direction. Then there would be needed to be a fourth wave and then final fifth wave. Honestly, I don't think this third wave if we are in a fourth wave will be this long.
There is a higher probability that it could look something like this fourth wave and then the final fifth wave will push towards that $74,000. If you take a look on our Fibonacci retracement level right here, we can see that we are having at $72,000 a very important 1.27 272 Fibonacci retracement level at $72,000.
All right. And another one important 0.786 at around $77,000. 0.618 at $79,600. 7618 is the golden ratio, right? You see it in the nature everywhere, its shape and also human emotions. So we can naturally assume that this will be by itself already quite strong.
Okay, quite strong. So the immediate support from daily time frame perspective is at $79,700. At this moment, the impulse then would need to look something like this. There's a lower probability that we would be able to push all the way down towards $72,000.
Even though we have enough liquidation there, right? We would be able definitely to slip through this 74 and continue to grind a little bit lower. But from the Fibonacci retracement levels, we can see we will have a heavy support right here around that 79,600 and 77,700.
So this might be the bottom of that zone which is at $77,700 might be the end of the possibly impulse. the price action. However, how we going to get there is much more important. All right? So, it might look something like this. If it's going to look even like this and we'll push towards the next support $72,000, that will increase the probability even more that we are in an impulse of that
opposite direction. But why is that important? Because if we will push towards here or here, we will just be focusing on the subwaves, right? So if we will create five subwaves that will tell us with the highest probability we are already creating an impulse in an opposite direction which suggest that the trend is changing from bullish to bearish.
And what's going to happen next afterwards with us with our trading strategies? Well, we will be looking for the correction in an opposite direction. In this time the corrective mode wave the reactionary wave would be to the upside. And if it's going to have a three-wave structure or variations thereof, basically a corrective mode wave pattern, the secondary waves are usually zigzags.
Well, that will be very bad for bulls because we would be already checking a possible short trading opportunities. I would definitely upon confirmation of that fifth wave in an opposite direction start looking and start trading with bearish trading tactics actively looking for bearish trading tactics on the daily time frame.
So I'm talking about trade setups with leverage. All right. So that would definitely tell us the secondary wave. If this was a first wave, top of the first wave right here at $82,000, the secondary wave would probably have a big resistance at that $82,000 that we are right now retesting as a support.
Okay, but we are not there yet. And because of that, I'm still more bullish on the daily time frame. Even though we have the bearish divergence on the momentum indicators, the bearish cross on RSI, we have the exaggerated and classic bearish divergence. But as you can see, the AI is already telling us this is the indicator that proparacer already has an access to which is injected with AI.
It's called MCP RSI intelligence in prop paracer. So membership. So basically right now we already see there is no edge anymore. The bearish divergence already played out. All right. And so far we can see that indeed we have crossed below the moving average RSI trend line.
Right. We are right now at 0 50 and the price action is kind of stailing behind the momentum. All right. So you can see the price action is creating higher low but the RSI is already having equal low. Okay. So as we can see the momentum is there but a price action is not as aggressive as the momentum.
So somebody might be absorbing that momentum and not allowing to push the price lower. And given that right now we are at support this is kind of bullish sign. So I'm kind of neutral on the daily. I would not really start pushing a buy button freshly right here.
I need to see more confirmations but I would not also create some new fresh short positions at this level given that we are at support and we can see that from the momentum perspective uh the bears are starting to look weaker. All right.
However, we cannot forget the thing that still whales are mostly selling. 63% of whales are selling in the past 24 hours versus only 37 of them are buying. What we also cannot forget is that the cumulative volume delta what we were looking at right here was the reaccumulation of the smart money.
Right? So we were we were pushing in with the price action to the downside. We created lower low but on the cumulative volume delta we saw an reaccumulation. That's why we then had this move to the upside. But afterwards it kind of they started to take profit not much.
They were closing more more so at break even. So average they reaccumulated at around $84,000 and then they were closing at around $85,000 because we saw that already on the CVD spot they already went back to the previous baseline. Right? So here they were already distributed and then basically decreased the probabilities for Bitcoin to keep on pushing higher because the smart money already distributed and as you can see we went we
went lower. Uh so at this moment I want to see some divergences on the CVD with the price action. So so far we don't have it right. I want to see lower high on the CVD, lower low on the price action or I want to see price action keep on pushing to the upside but without leverage moving without open interest moving but the CVD moving aggressively together with the price action.
Once I will see it, I will assume that the smart money is pushing the price to the upside. Not the borrow money aka the leverage. And speaking about leverage, we can see open interest after this push after this basically deleveraging moment when the open interest went down heavily together with the price action.
We have not seen open interest to increase heavily, right? So not much of a new positions are in at this moment, but the ones that are in are still kind of crowded on the long side as I have taught you in the intro of this video already.
So I want that right now. You can see that even though we are at support, the long squeeze probability on the four time frame is still at 30%. Which is even higher than before this push lower. Okay. So, I want to see the open interest to start declining while the price is moving to the upside because I want more over leverage long positions to start closing.
All right, but the CVD I want that absorb that selling pressure. So, once you close a long position, right, you need to sell the contracts back. I want that being absorbed by the CVD, the spot money. All right? And see the price moving to the upside.
So that would mean the long positions are winding down. People are closing their long positions, but the market is not moving heavily down on it. Henceforth, somebody's absorbing the selling pressure. And I want to see the CVD is doing that the spot. Yeah.
And that would tell me all right smart money are positioning with the property we will see a reversal and continuation in that direction and that means to the upside. Okay. So I'm watching for that right now ladies gentlemen. If you're on Paris 7 VIP and I will pull the trigger on some side you will definitely know about it because we are sharing with you our personal trade stuff with clear entry and
exit targets. At this moment I want to see more confirmations from the 4hour time frame perspective as well. We are at support. Yes, but I want to see a clear bullish hammer candlestick pattern and bullish engulfing. You know exactly what I mean by that from the previous videos, right?
When I say this and because you're educating yourself in our MCP3 University. So, I'm waiting exactly for that. You can see that I have also an alternative count right here. One two that's exactly for the possible impulse. But also there's much higher probability right now still even though given that we have broke below this low it's lower.
So it's no longer like 7030 that we will push towards $9,000 before the higher degree reversal. But it's more like 6040 right now. But I'm still I'm still more bullish on the 4hour time frame. But there are no confirmations at this moment. Momentum indicators we are don't see any bullish divergences.
Okay. So other than the support and the possible price action, I need to see more confirmations for me personally at least to pull the trigger. You know that we have more traders in the in the Friday team. We are working as a hedge fund.
So everybody has a different trading tactic. We are working in under the same trading strategy, but everybody has a different positioning and exiting trading tactic. But for me, I can only say that right now, I still see this as a corrective mode wave structure until I can see a clear impulse to the outside.
So there is the corrective mode wave count that this is a B C D E. All right. So we are creating this pattern that you know very well, right? Aka WXY XXZ which is a triple 3. This is looking to the upside but the same direction it is also looking to the downside is this kind of prolonged consolidation.
So I want you to see it perfectly. So this is a corrective mult wave structure right here. Then ABC right here as well. ABC right here. ABC right here. And if I do it this way you will see it actually better right right here.
And right now we might be finishing the Zwave. Okay ladies and gentlemen. So until I will see that there is a clear structure of the impulse right because this could also be one two and right now we are creating third wave but for that I would need to see really the continuation of that impulse.
Uh right now the probabilities are that this is a corrective mode wave structure from 60% perspective and the next big move is going to be still to the upside. All right and 30% perspective is that this is a beginning of the impulse. All right so for a confirmation I want to see bullish divergences some bullish divergences or at least the momentum indicators showing us some bullish signals which they are not yet.
I want to see the price starting to recover in a five moves fashion. Okay, so five moves to the upside that would allow me to watch then for the corrective motive structure if it's going to be three-wave operations of thereof and it will close above $82,000 and it will follow nicely the volume with the impulse increase in volume decrease in volume on the corrective mode wave here.
I would probably enter a long position because that would be a high probability trade setup with great riskreward because the invalidation I would be able to place quite tight to the entry possibly to around $80,000 and the exit target with the last target I would put to around $99,000.
You know exactly why from the previous videos. So right now I'm waiting for more confirmations, ladies and gentlemen. still slightly more bullish on the four time frame, but it's only 6040 and for me to pull a trigger, I need to see some confirmations personally.
So, ladies and gentlemen, until next time, next video will be on Saturday. So, until then, trade safe, trade with a professional trading strategy, and I will see you again on Saturday. Cheers. Calm [music] breath, clear eyes. Work done now. Right. No rush, no drag.
Right time, full snap. Clean set up. [music] Clean click. Execute like a pro. That's it. M [music] clean set
Educational content, not financial advice. Crypto trading carries substantial risk; you can lose your capital. Past performance does not guarantee future results.









Join the discussion
No comments yet. Members, share how you are reading this.