


In short: Simon stays bearish on Bitcoin’s weekly and daily charts, still eyeing $44,000 as a reaccumulation zone. But on medium and lower time frames he turns cautiously bullish, citing bullish divergences and smart-money longs. He expects a possible push toward $90,000 before a larger rejection, with $78,000 the key structure level.
Is Bitcoin bearish or bullish right now?
Simon is bearish on the weekly and daily time frames, still expecting a move toward $44,000 before any new high. On the medium and lower time frames he is cautiously bullish, because bullish divergences show the bears losing momentum. He frames it as a car running out of fuel uphill.
He has held this macro stance since $121,000. A shooting star candle and heavy whale selling keep him from going long on the daily. Short-term, though, the bulls have room to push green candles, as covered in his ongoing Bitcoin analysis videos.
What are the key support and resistance levels?
Simon marks resistance at $84,200, which he flipped from neutral to red after repeated rejections, and the big one at $90,000. Support sits at the ascending trend line near $83,000, with deeper supports at $79,000 and $78,000. Full detail lives on the Bitcoin key levels page.
He explains that a daily long here risks about 11% to chase a 9% move, roughly one to one. That weak risk-reward is why he passes. Solid position sizing and stop placement keeps stops below structure, away from stop-hunting algorithms.
What are the whales and retail doing?
Over 24 hours, 67% of whales were selling, and the past 3 days ran 59% selling versus 41% buying. But Simon notes spot selling can be diversification, not an immediate dump. The retail fear and greed index sits at 55, with the 4-hour at 44.5, so no extreme greed.
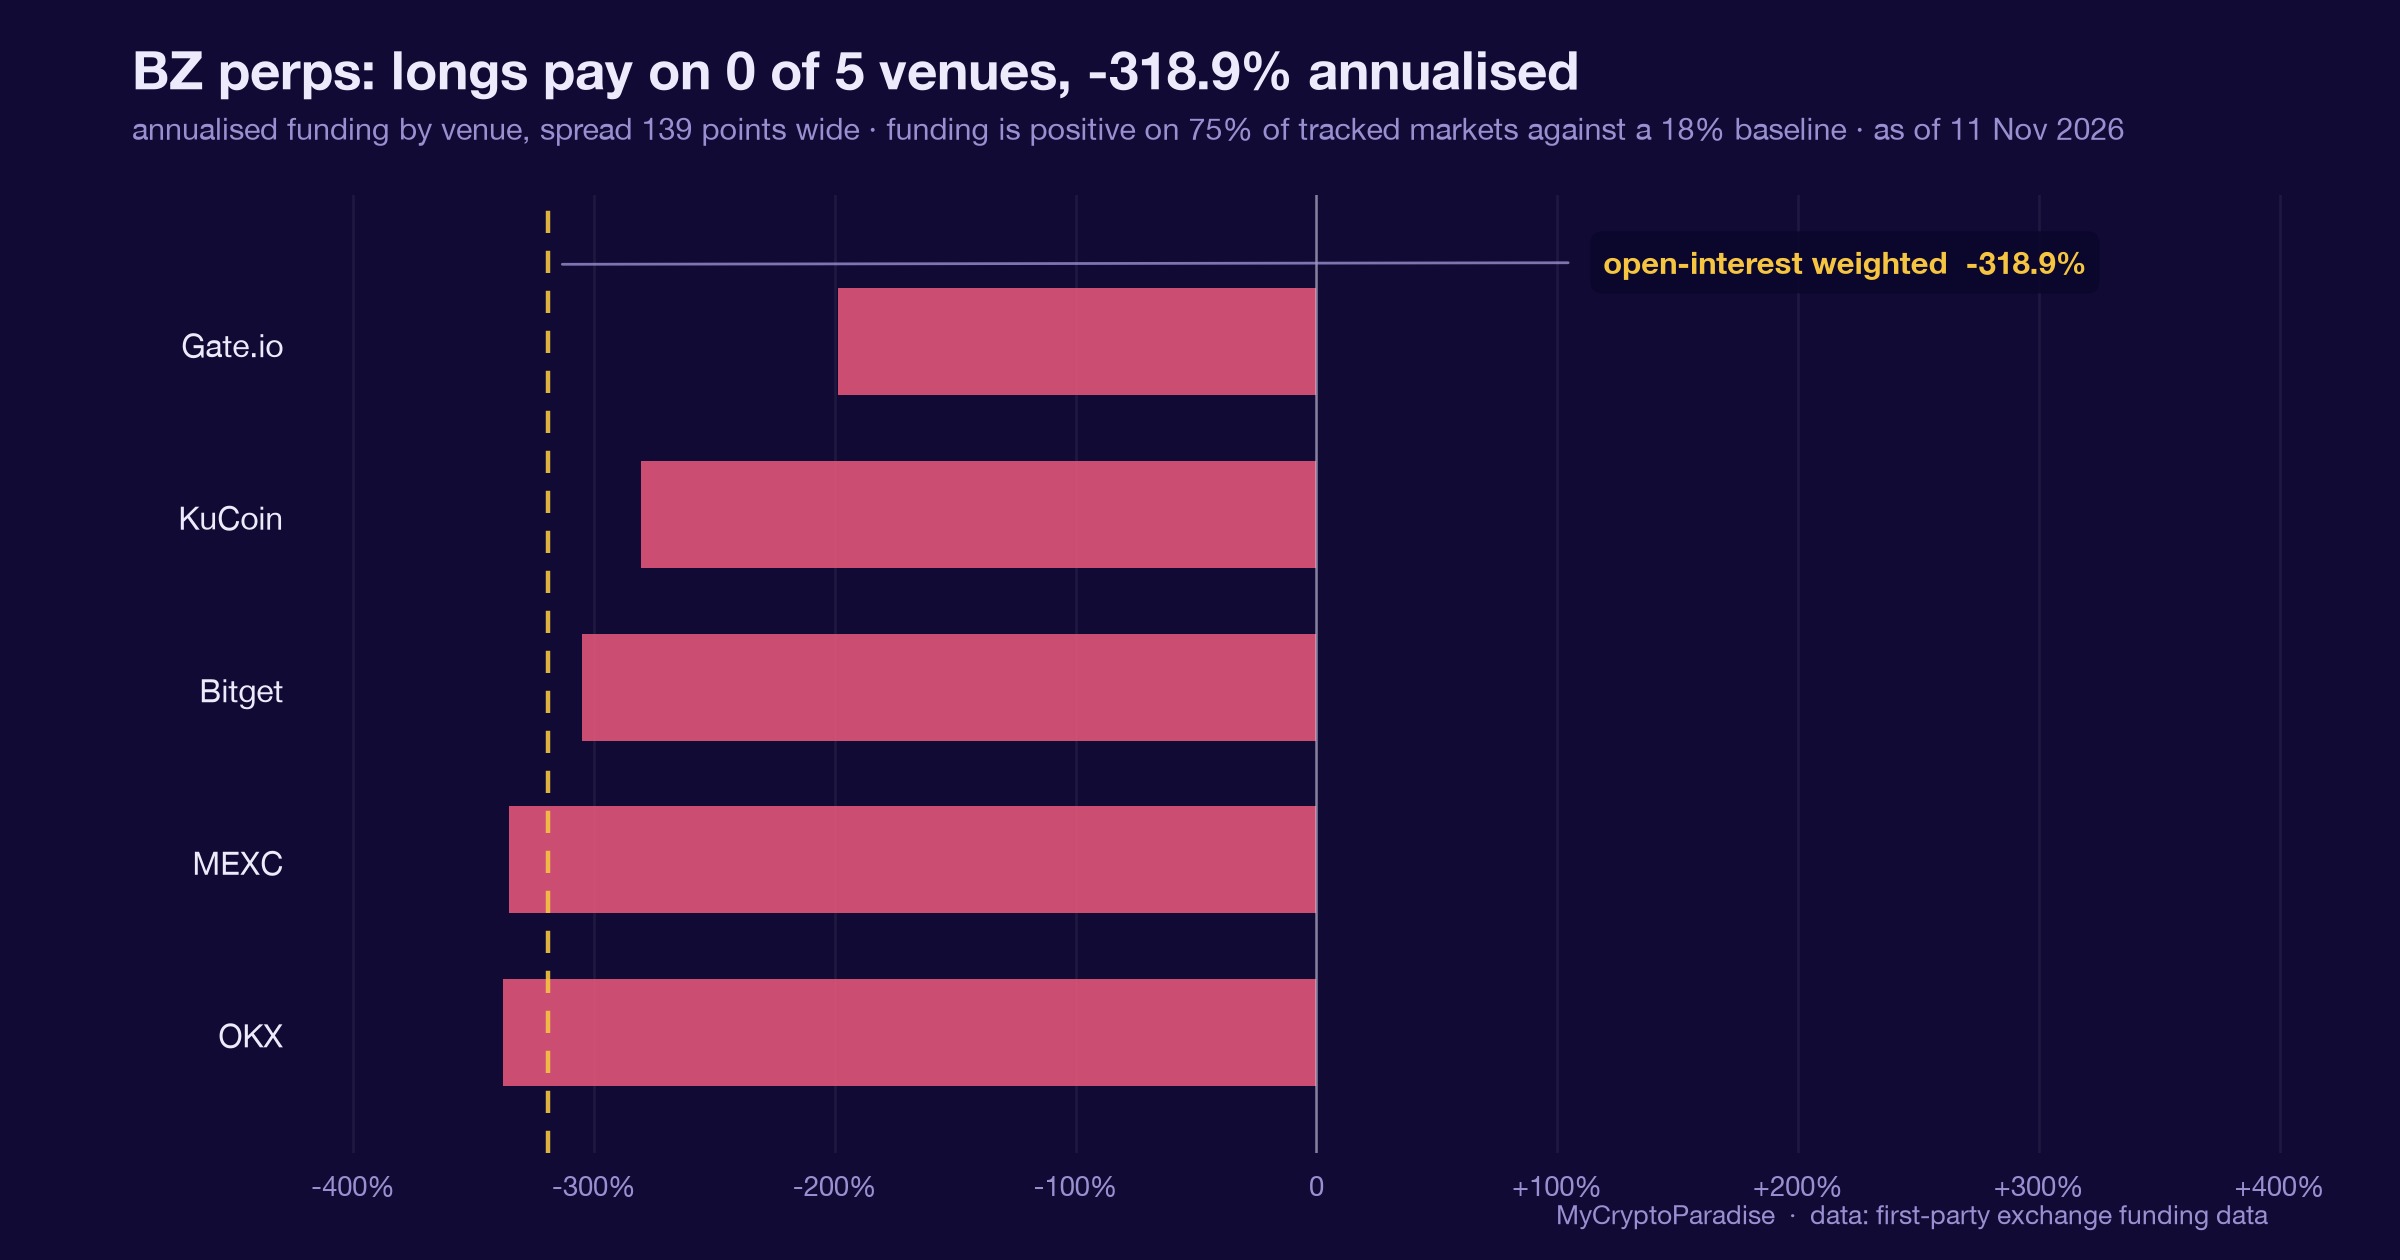
His position intelligence tool shows longs rising while price dipped, a divergence that preceded past pumps. The crypto funding board shows positive funding on smart-money exchanges, meaning smart money, not retail, opened these longs. That lowers the long-squeeze odds for now.
What would confirm the bounce?
Simon wants a clean break above the ascending trend line on rising volume, then a retest on declining volume. That shows weak bear participation and strong bulls defending support. Only after that reclaim does he expect a smooth continuation toward $90,000.
Volume was rising as price approached the trend line near $83,500, which he reads as bullish. Still, he waits for confirmation rather than gambling. He reacted well off $83,000 earlier, using the copied upper trend line as a guide.
What invalidates the bullish structure?
The bullish market structure holds as long as $78,000 is not reclaimed as resistance from below. Price can even wick down to the $79,000 to $78,000 liquidation cluster without breaking it. A reclaim of $78,000 into resistance flips Simon back to the downside.
A move below $73,000 would change the broader structure that is still bullish, Simon says. That is why he places stops below structure levels the whales have no easy reason to hunt.
Frequently asked questions
Is Simon bullish or bearish on Bitcoin?
He is bearish on the weekly and daily time frames, still targeting $44,000 over the macro. On the medium and lower time frames he is cautiously bullish, expecting a possible push toward $90,000 first, because bullish divergences show the bearish momentum fading right now.
What is Bitcoin’s key resistance in this video?
Simon names $84,200 as near-term resistance, which he flipped from neutral to red after repeated rejections and a shooting star candle. The larger, more important resistance sits at $90,000, where he expects smart money to use retail buying as exit liquidity before a reversal.
Why won’t Simon long Bitcoin on the daily?
The risk-reward is poor, roughly one to one. A safe stop sits about 11% lower near $73,000, while the upside to $90,000 is about 9%. Price is also still below resistance with no proper reclaim, so he sees no edge in that trade.
What are the whales doing now?
Mostly selling: 67% in the past 24 hours and 59% over 3 days. But Simon says spot selling can be diversification, not an immediate dump. His funding data shows smart money opening the current longs, which is partly why price is pumping right now.
What breaks the bullish structure?
A reclaim of $78,000 as resistance from below breaks the medium-term bullish structure, turning Simon bearish again. Price can wick into the $79,000 to $78,000 liquidation cluster without damage, but a move below $73,000 changes the broader structure that is still bullish.
MyCryptoParadise has run a professional crypto signals and trading-education service since 2016, led by founder Simon Mach and the ParadiseTeam. Simon records these sessions three times a week, and every episode lands on the Bitcoin video analysis hub.
Video transcript
Auto-captioned from the video audio and lightly cleaned, so it can contain transcription errors; the video itself is the record. It is speech, not a written article; for the structured breakdown read the sections above.
Bitcoin is at support and on the medium time frame we are forming multiple bullish divergences. Is this the recipe for Bitcoin's recovery or are the bulls still too weak to do anything right now? Let's analyze the probabilities. Hello ladies and gentlemen, this is Simon from MyCryptoParadise.
Welcome back, it's Greg here at Ladies Tuesday and that means that you are watching the first video of this week. So Bitcoin on the weekly time frame still bearish. In the previous video we went through the probabilities and through the possible 3 scenarios that can happen and how much probability each has.
The biggest one is the probability of getting rejected from the current or that 90 000 dollars towards 44 000 dollars where it's gonna happen the re-accumulation zone. Let's not spend too much time on the weekly time frame. If you have not watched the previous video, definitely watch it where I have went in depth of what we are expect and why on the weekly timeframe so on the weekly timeframe i'm still mostly
bearish all right i'm still bearish since 121 000 years where i have started to get pretty bearish and i've showed you this price action that might happen and take us towards 44 000 years i'm still taking the same stance i don't believe that the macro bottom has been created and i still believe that that we need to go a little bit lower before we can start pushing towards the new all-time high,
that will be the highest probability to be at $169,000. So let's quickly move to daily time frame, here, there doesn't make sense to trade with bullish trading tactics from my perspective neither, so on the daily time frame I'm still bearish as well, even though there is a high probability that we can push and create a final 5th wave and we can push towards $90,000 before the larger rejection, but as we have
already established in the previous video, the risk required, neither the probabilities are enough for me on the daily timeframe to look for some swing plus long positions, so I am not playing with bullish trading tactics on the daily timeframe, neither, alright. yesterday, as you can see, the candle on attempt of breaking above this moon average trend line created a shooting star candlestick pattern which is bearish, you can see this big wick
above the small body of this candle and that basically tells us that the bears are quite strong and the whale tracker actually supports that bias, you can see that in the past 24-7 hours 67% of the whales are selling and if we take a look at the past 3 days, still it's kinda evenly split but there is much more selling happening than buying as you can see so 59% selling versus 41%
buying in the past 3 days and as you can see today the whales are really pushing the sell button quite aggressively but does that mean that there is no probability at all that we can push towards 90,000 dollars before dumping and before having the big reversal to the downside.
It does not mean that, right? You actually know that on the lower timeframes I'm more bullish than bearish. But as approach on traders we are analyzing the market from multiple time frame perspective and we are looking at the trading from multiple angles so we are not just stuck with accumulation and redistribution as we are doing on the weekly time frame rotation in our hard wallets as you know if you are in
ParadiseFamilyVIP original membership how we are rotating our funds that we compound in our hard wallets between Bitcoin USDT and PAXG which is digital gold so that's position trading on the weekly time frame then we are doing swing plus trading on the daily time frame but we are not stuck only with these two styles right then we also do day and short-term swing trading well and then we are also doing on the
lower time frames scalping right and intraday trading so we are not stuck only with two strategies we are focusing on the market cycles and trying to find opportunities whenever it's possible but on the daily time frame from a swing plus trading perspective aka from the long-term swing trading perspective.
For me there is not enough opportunity on the daily timeframe. In previous video this was this zone of 84,200 dollars and the lower boundary 82,000 dollars. I had in as white color right it was a white color it was a neutral zone but given the shooting star candlestick pattern and multiple attempts of breaking above it I have I have turned it already into red because this is right now acting as a
proper resistance as you can see the upper boundary was tested multiple times and rejected right now the lower boundary that is being supported already with this moving average trend line is also being tested multiple times so it's acting already this as a resistance zone henceforth on the daily time frame longing it's not actually a great idea to do so from like you obviously we can push through and the lower time frame
actually tells us that there is quite a high probability that it can happen but from the daily time frame perspective do this over and over again just to catch a possible 9% move, right? You can get lucky few times but do such trades 100 of times, right?
And obviously in a row for example even 10 times you can make money but most often then and not, right, after those 100 trades, if you will be taking it over and over like this, you will lose money because this is a low probability thing to do and the risk reward is not good neither.
However, if we take a look on the opposite side, right, shorting here or here, focusing on the short trading setups come with much higher probability given that we understand the price section, we understand that we are in a final 5th wave, right, of our motive wave, sea wave structure, that is having only 5 waves, and the 5th wave is a final.
We also understand that there is much better risk-reward opportunity, because the invalidation level from here, from here, or even from here, from that $90,000 will be extremely close, right. But if we want MyCryptoParadise, Simon Mach, ParadiseFamilyVIP, PRO Paradiser, make sure that our levels are as good as possible but just for the sake of explaining to you right now the risk reward on the daily time frame you understand that to be safe
from the noise and that's always what you want to do right be safe from the noise from the volatility of the market before the real move happens right so to be safe from the noise all right we would need to place the stop loss around 11% lower right now from the day trading perspective, okay?
And because if this level gets hit, that's $73,000, then this is very high probability that the price action will follow in that direction, right? If we would place it higher, for example, only below the low of this wave, right, to around, let's say, below 79,000 Earths, well, we still understand that there is kind of high probability that the noise can wick out this level and then the real move will still happen
in the opposite direction. So as a professional trader, we need to always find such levels that the market makers and the whales and the stop-loss hunting algorithms that are in the crypto market will have no reason to first off hunt and also it will be extremely difficult for them to do so.
So we want to place it exactly below as strong support as possible and below levels that will change the market structure and if we will push below seventy three thousand dollars it will change the overall market structure that is right now still bullish, right?
So that would make, because we also understand that the next important resistance is at $90,000, multiple confluences for that, that would make very low risk reward trade for me, not very nice risk reward. 10% profit versus 11% loss, that's one-to-one, I don't like it, all right?
It's not giving me an edge, so I'm not taking such trades, given that also technically we are below important resistance we have not seen a proper reclaim of this resistance so for me this is a no trade on the daily time frame but does it change on the lower time frame because does the selling right now of the whales mean that immediately we need to go down it does not right because
sometimes the whales can just be selling on the spot exchange just to basically diversify their portfolio, right? So that is why also it's important to observe on our whale tracker on our website MyCryptoParadise.com if it's like a spot selling, right, or spot buying, or if it's actually happening on the futures market, if they are taking a leverage position, right?
So if they are taking leverage positions, that's usually for catching the smaller, like smaller time frame moves, smaller time frame moves. But if they are buying or selling, right on spot it can be just strategic accumulation or distribution which doesn't mean that if we are selling like vast amount of selling from the whales the market immediately needs to go down right it doesn't so what however is important for the immediate directional
trades to look for on the whale tracker is the kind of divergence between the retail and what the whales are doing right and do we see right now some heavy divergence well if we take a look at our fear and greed index and compare it with the whales so what we don't want to see that the retail is extremely greedy right now so as you can see we are 55 out of
100 which is out of neutral all right but still there is no extreme it doesn't really suggest that right now the retail would heavily provide the whales exit liquidity. So if you take a look on our fear and greed index for on the for our time frame on the for our time frame we can actually see that we are at 44.5 points we are a neutral almost fear zone all right there
is no extreme so the divergence between the dump money aka the retail money and the smart money aka the whales is not huge right usually at the top of some bigger trends, we always see like these kind of extremes, right? When the fear and greed index goes to the number 20, which is fear to extreme fear, so that's usually a bottom-end signal.
If we can confluence it that the whales are actually having a buy-in, so they're actually absorbing that selling pressure from the retail. And for the top-end signals, when we go to 80 or above 80, which is greed or extreme greed and there is the divergence between the whales where the whales are actually using that buying pressure from the retail as an exit liquidity.
So right now we can see just one piece of the puzzle. The whales are selling mostly, right, but the retail is not in an extreme grid mode and they are not pushing the buy button aggressively right now, right? So there isn't this kind of bias from these two data points that we would right now see the high degree reversal at this moment.
So that also suggests that what we are seeing on the medium time frame, right and as you can see right here on our MCP RSI indicator that we have injected with AI we have meshing learning coach in that we are actually have two bullish points out of five all right two probability points for the bulls out of five because we have created few bullish divergences right here so we have already seen
that the bearish momentum is actually slowing down and and as we have already established in the previous video that I recorded for you on Saturday, it's this kind of analogy with the car, right? So when the car is going uphill, but it starts to lose fuel, it starts to slow down, slow down, it starts to lose the momentum, and then when the fuel is out completely, the gravity will start to play
out and the car will start to move in an opposite direction. and that is right now something, what is happening to the price. The price is losing the momentum and the bulls have a great opportunity to start taking over because the bears are losing the steam, they are losing the momentum, they are getting weaker.
Together with that, we are at that important support zone, alright, on multiple time frames and that suggests that given that we don't have extreme greed from the retail, so the The retail is not right now extremely buying. It suggests that the bulls, the day trading bulls, the smart money that are day trading focusing on these kind of short term time frames, they have actually a great opportunity to pick up the market,
push a little bit of green candles, create this kind of excitement and given that we understand that the retail is not fully in right now, not fully involved, There will be enough liquidity left for the retail to then push the price a little bit higher and then possibly at that $90,000, create enough buying pressure for the smart money to use it as an exit liquidity which will then help the market to
create the reversal, alright? So right now we can assume that given all of these data, the market can actually, from from the lower time fan perspective, start push to the upside. Another thing that is interesting, what we can see right here, on our new indicator that we have pushed, positioning intelligence, we can actually see multiple divergences.
A divergence that, similar divergence that happened already back in 18th of October, alright, few days ago. The price action went down, but what happened with the long positions? they started to increase, right? So the price action created lower low, but the positioning indicator created higher low.
So on the price action to the downside, no long positions have been created. What happened with the price afterwards? A PUMP! Right? Let's take a look at this. Before, price action was going down in the past two days, right? What happened with the positioning index indicator?
Divergence, right? the longs actually have been absorbing the selling pressure and they have they have been opening long positions without actually moving the price right so they have got nice entries and what's happening right now we can see the market from the lower time frame perspective is pumping out of that support which is bullish but who created these long positions smart money or dumb money we have an We have an answer
because we are having our funding rates on our website MyCryptoParadise.com created by the ParadiseTeam, the expert traders, provisional traders and that is why we've actually selected the exchanges, two columns, so the retail heavy exchanges and the smart money exchanges, all right? So where the smart money is trading, where the dumb money is trading, most of the Digital Retail is trading on the most famous exchanges and they like to pay the fees
for some reason because they feel like everybody is trading on Binance, they have this kind of crowd effect where they want to follow the herds because it feels safe. So I'm gonna be paying big fees, extreme amount of fees because everybody is trusting Binance, everybody is trusting Bibit.
Even though they are hunting my stop losses and they are doing a lot of shady stuff, I'm I'm gonna still trade at Bybit and Binance and OkeyX and BitGet for some reason, I don't know why, but it's this kind of follow the herds effect, right?
So most of the retails are okay with paying a huge amount of fees on these exchanges and that is why we can put a column right here and we can understand, alright, retail is trading right here, if we get some data out of these exchanges we can understand most of the retail traders are doing that.
And then we have all of these exchanges but there are extremely low fees which is interesting and attractive for the big money, for the smart money, right? And that's where the smart money is trading, and we can again, thanks to that, create a column out of it, and it's on our website MyCryptoParadise.com, where you go to Membership, MCP Insights and you find Funding Crates.
So, right here, what we can see right now, the retail exchanges, they have the funding crates quite neutral, who is actually pushing right now the long positions, as we can see the smart money. On these exchanges we can see quite heavy funding rates.
That is also what's creating the long squeeze probability. But given that we understand that actually these long positions are being created by the smart money, because we can see the funding rates are being positive on the exchanges where the smart money is trading, it's decreasing the probability that the long squeeze right now will be effective, because we still have all of the retail to get in right so that is also why
the market is pumping right now because smart money went into the long positions okay not dumb money that's big difference so ladies and gentlemen that is why we have these indicators it's in the PRO Paradiser membership which you can right now subscribe to on MyCryptoParadise.com we are doing this because it's very helpful okay it's very helpful you can get much better trading decisions out of it and you can create your own
edge thanks to it and obviously these insights tools they're also for free not the indicators but we are preparing one indicator that we will push out there for free for everyone that is actually going to be extremely useful so once we push it you will let we will let you know about it on our free telegram channel so right now what we need to watch first off how the price The price
action is gonna react to this lower trend line of our channel, right? We have analyzed the slope of the trend line previously by copying the upper trend line of the channel, placing it to the important point right here. And as you can see, it reacted and beautifully worked right here at $83,000.
And right now the price is trying to attack again around $83,500. So, once we will be able to break with nice volume, let's take a look at the volume right now Rise in with approaching this ascending trendline, which is bullish, alright, but we need to keep going, we need to keep going So once we start breaking above this trendline, which right now seems like we will, given that the volume is quite
nice as we are approaching the trendline but we are not random gamblers, right? We need to wait for confirmations. So, as we break above it, then for a proper reclaim, what I want to see is a retest of this ascending trendline or a decline in volume, alright?
Which will tell us, alright, the bears are pushing, but the participation of the bears is weak, right? Much weaker than the participation of the bulls, which will suggest that there is much higher probability that the bulls will be able to defend this ascending trend line as a support, and that the price action will be able to very smoothly continue to trend in our channel, alright, as previously it was, and we can
continue to create the final wave towards that 90,000 dollars before the larger rejection. on the medium timeframe and on the lower timeframes I am cautiously bullish but I am being very cautious because I understand that the higher degree trends they are not really supporting to be much bullish but on the medium timeframe there is now much higher probability and from the lower timeframe perspective that we will push towards $90,000 before having
some bigger reversal, right? So obviously you understand risk reward was quite good right here because this was the important support and the risk reward is nice also because we understand that the next important resistance is at $90,000, right? Why is it important resistance?
We went through it in the previous video. So right now still I'm holding the same bias as I've I've told you about on Saturday, on the medium time frame, on the lower time frames are, I'm more bullish than bearish until, until, ladies and gentlemen, because you understand that if we push down, we can actually, we have this Bitcoin exchange liquidation cluster down to $79,000, right, so we can actually push down to
$79,000 to $78,000 without breaking the in the higher degree bullish structure. However, if we will start reclaiming this support $78,000 into resistance, it will start interfering with the first wave. We went through it in the previous videos. I will not be repeating that.
Basically, the bias is if we will start reclaiming $78,000 from below into resistance, then we will start going down because it will break the bullish market structure we are in right now. So ladies and gentlemen, these are the things and the data and the biases, so I will see you again on Thursday, I hope this helps, alright?
And if you have some question, feel free to let me know, you can write me on x or connect with me on LinkedIn, or write a comment here, I'm reading all of the comments, and I will see you again on Thursday, until then, take care, cheers!
No rush, no drag, right time for snack, clean setup, clean click, execute like a pro, that's it, clean setup
Educational content, not financial advice. Crypto trading carries substantial risk; you can lose your capital. Past performance does not guarantee future results.









Join the discussion
No comments yet. Members, share how you are reading this.