

In short: Simon and the ParadiseTeam see only a low probability that Bitcoin crashes to $74,000 and liquidates over $12 billion in long positions right now. On the daily and 4-hour charts he favours bullish tactics, expecting a push toward $90,000, with a possible dip to $84,000 first.
Will Bitcoin crash to $74,000 and liquidate $12 billion in longs?
Track it live: our live crypto funding rates updates in real time, so you can watch this shift for yourself.
Right now that is a low-probability scenario, according to Simon. A drop to $74,000 would be roughly 14% below current levels near $86,000. It could trigger a cascade across more than $12 billion in cumulative long positions.
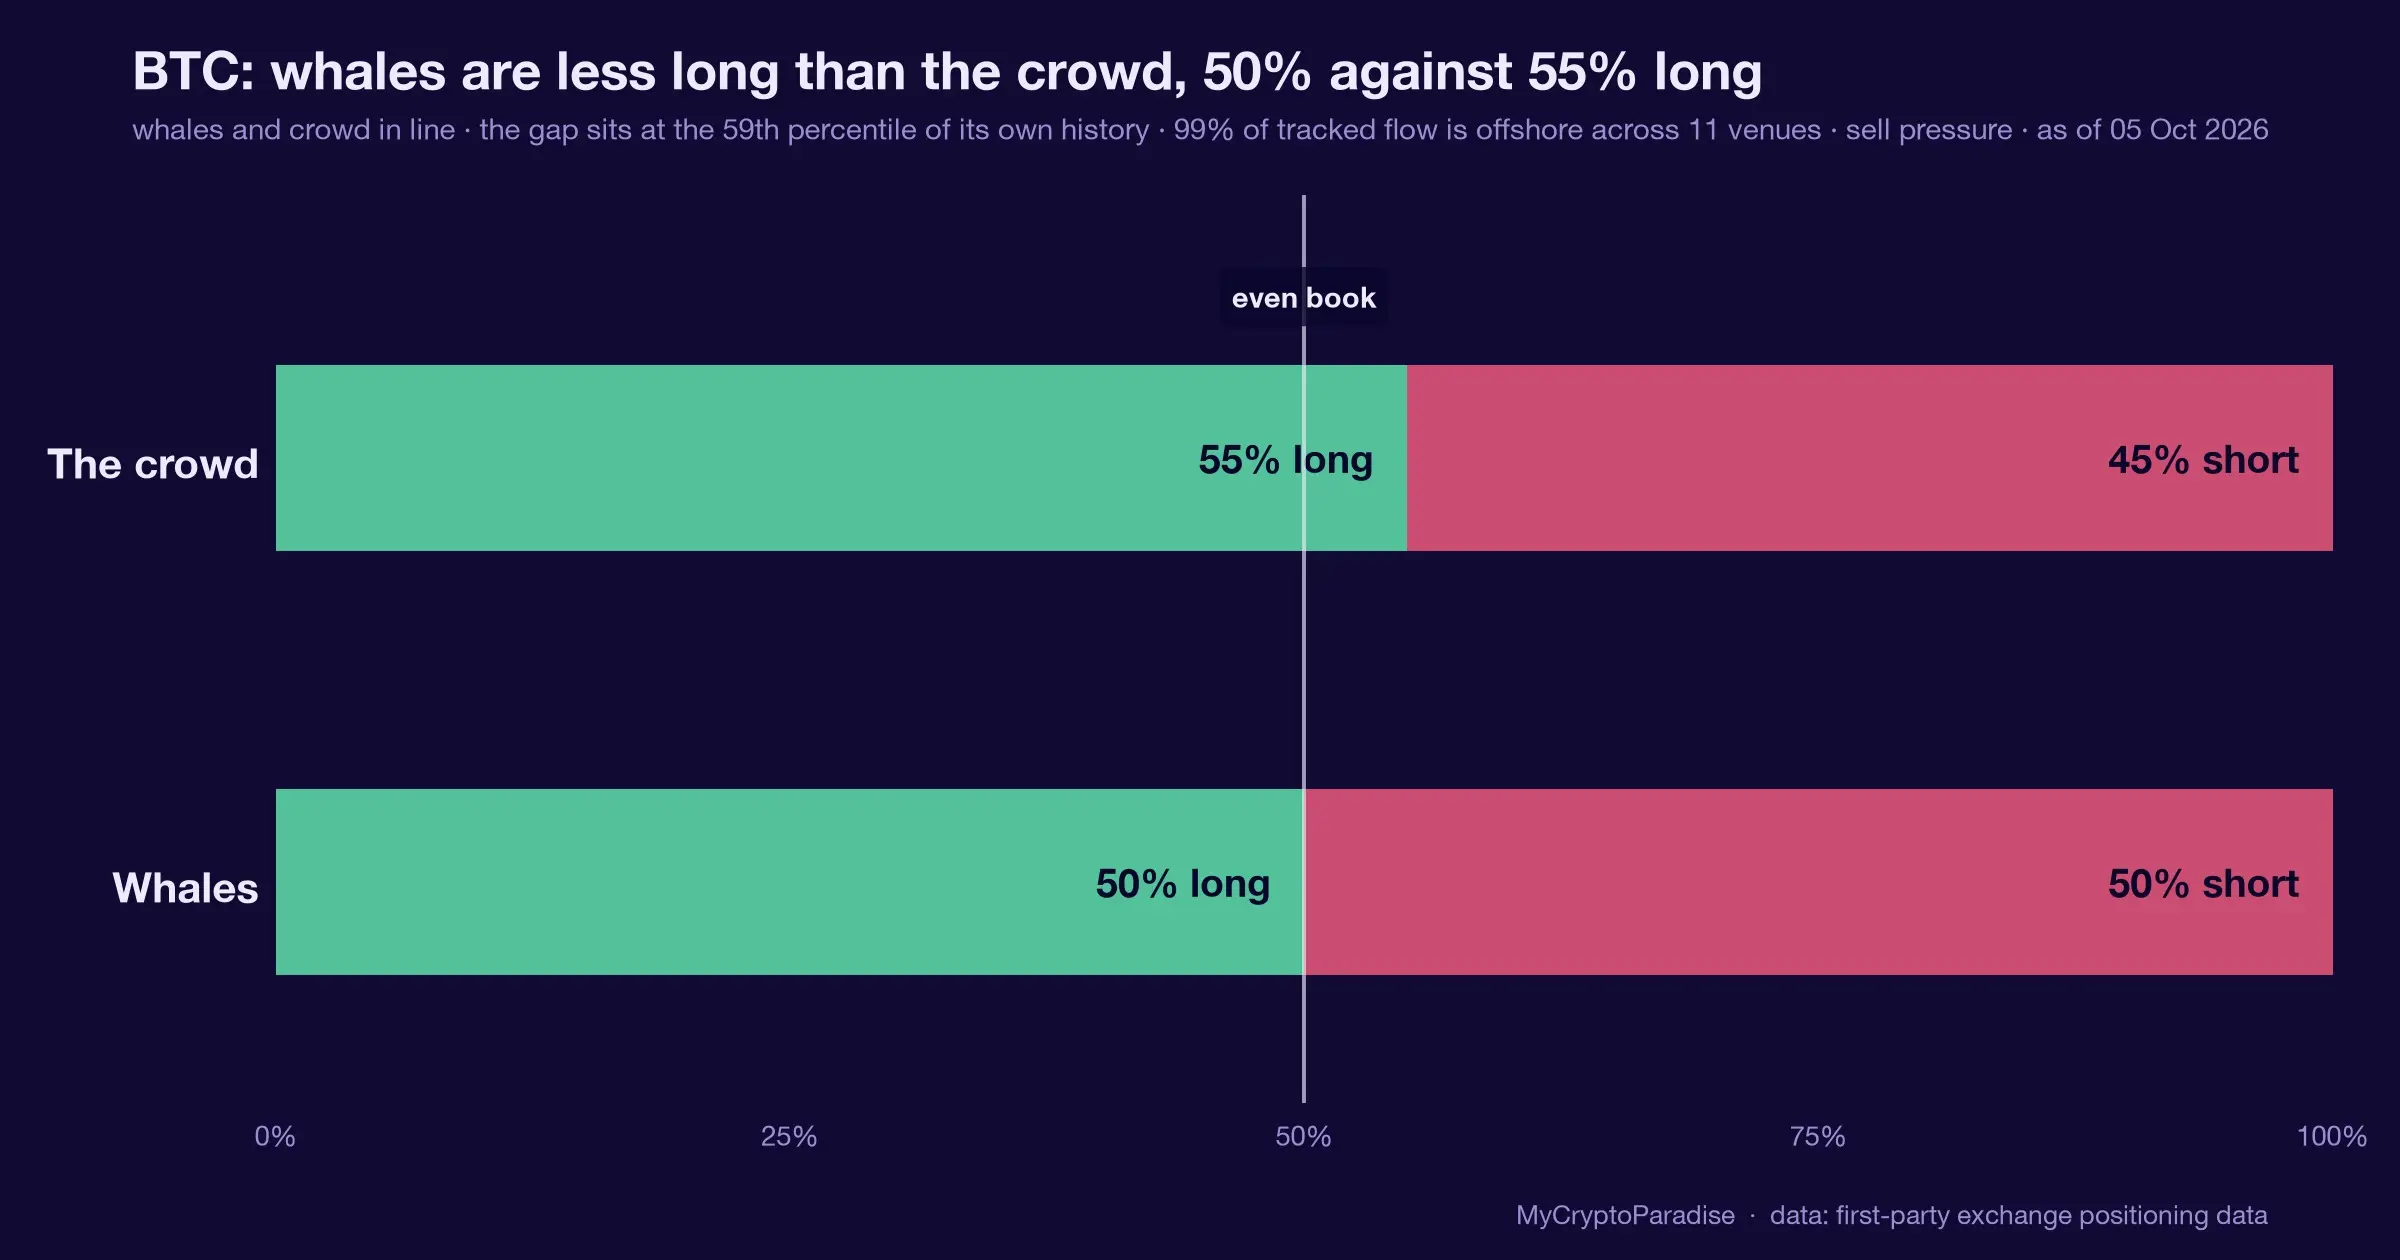
The data Simon tracks does not support that move yet. He sees longs crowded but funding history nowhere near the extreme that has marked past tops. Sentiment is greedy but not extremely greedy.
What is the most likely path for Bitcoin from here?
Simon assigns a 60% probability that Bitcoin is rejected at $88,000 to $90,000, then falls toward the $44,000 to $55,000 exchange-of-hands zone. A 30% path reclaims $90,000 and pushes to $99,000 before rejecting.
Only a 10% path breaks above $99,000 and grinds toward a new all-time high near $169,000. On the weekly chart Bitcoin sits in an expanded flat, with the final fifth wave still due. See more counts in the Bitcoin analysis hub.
Why is Simon still trading bullish on the daily and 4-hour?
Because the near-term structure stays bullish. The $82,000 to $83,000 zone flipped from resistance to support on strong volume. His Elliott wave count points to a fifth wave targeting $90,000, possibly $95,000.
Simon sees no five-wave move down and no bearish divergence to justify a short yet. A medium-term short would need a stop near $87,500 for a $84,200 target, a weak setup by his risk and sizing standards.
What does the funding and sentiment data show?
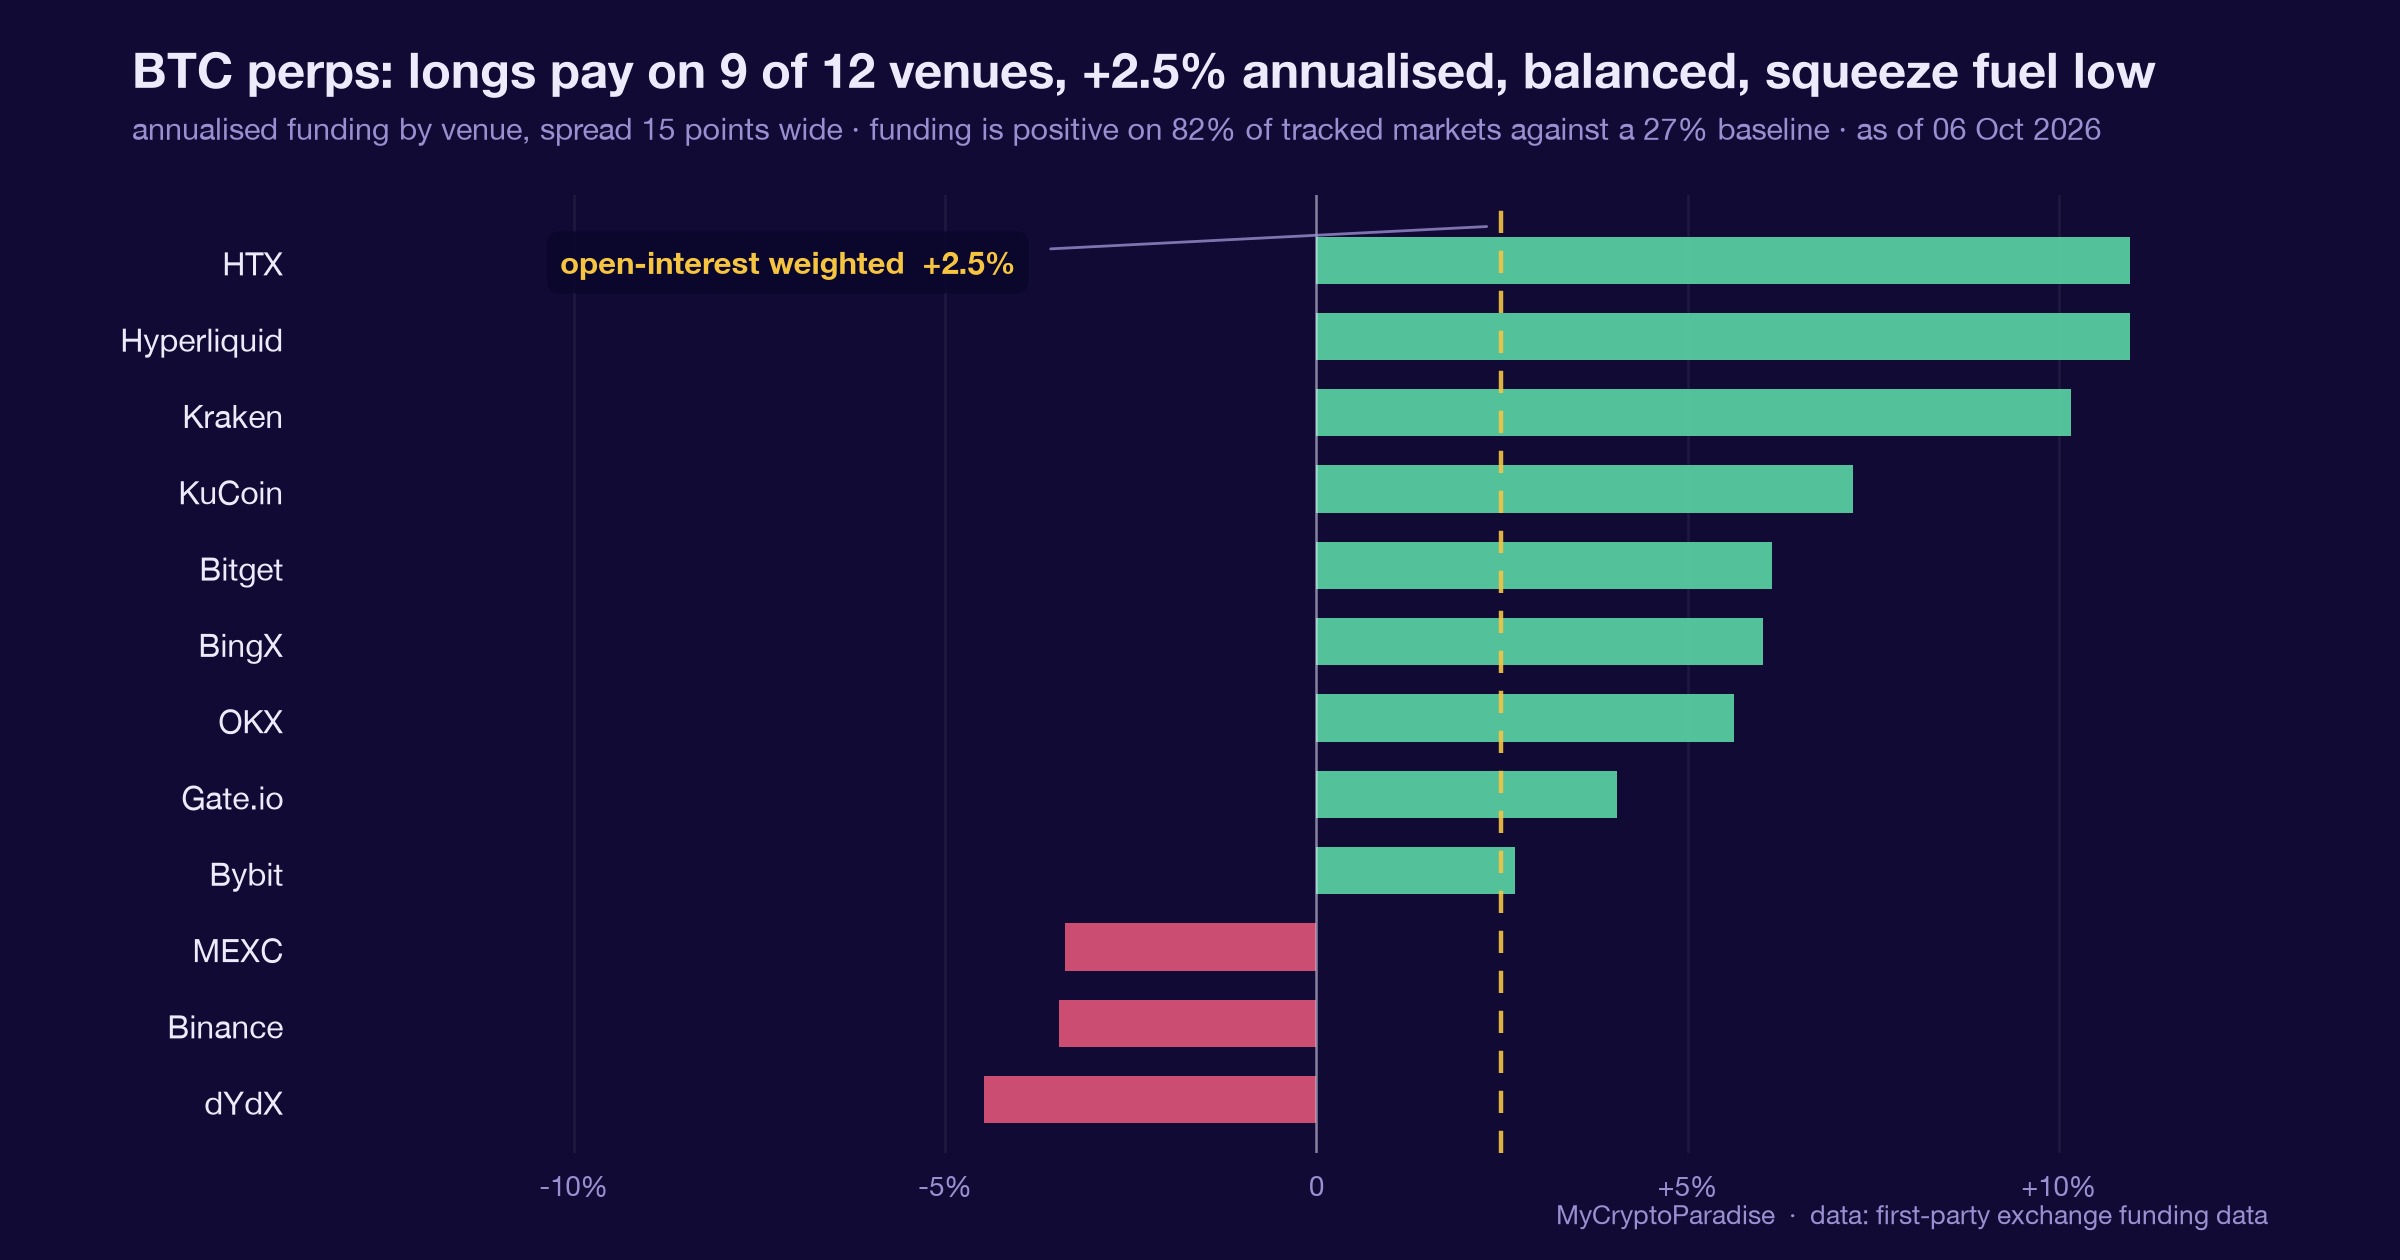
Simon sees some long-squeeze probability with longs more crowded. But funding history is not near the +10 reading that has marked past reversals. The crypto fear and greed index is greedy on lower timeframes, not extreme.
He also flags a large short cluster toward $90,000, around $2.8 billion, leaving that zone vulnerable to a short squeeze. The positioning detail lives on the funding and squeeze board.
Frequently asked questions
What price would trigger the $12 billion long liquidation?
Simon points to $74,000 as the level where more than $12 billion in cumulative long positions could be liquidated in a cascade. That is roughly 14% below current levels near $86,000. He rates the odds of reaching it from here as low right now.
What is Simon’s Bitcoin price target?
On the medium timeframe Simon expects a push toward $90,000, lining up with a 1.272 Fibonacci level. If the fifth wave extends or the structure develops, the move could reach $95,000 or tag $99,000 before a rejection. A new all-time high toward $169,000 sits at only 10%.
Is Simon bullish or bearish on Bitcoin?
It depends on the timeframe. On the weekly he stays bearish, still waiting for lower prices to reaccumulate after distributing near $121,000. On the daily and 4-hour he favours bullish tactics, since the near-term structure and momentum do not yet justify a short position.
Could Bitcoin dip to $84,000 first?
Yes. Simon sees a high probability that Bitcoin extends its fourth-wave correction in an ABC zigzag toward the $84,000 support before grinding higher. He is not shorting that move, because the risk reward is poor and the medium-term trend remains bullish on his charts.
When is the next MyCryptoParadise video?
Simon says the next video will be on Thursday. This breakdown was the first of the week, recorded on a Tuesday. He will update the Elliott wave counts and probabilities as the live price action develops around the $88,000 to $90,000 resistance zone.
MyCryptoParadise has run a professional crypto signals and trading-education service since 2016, led by founder Simon Mach and the ParadiseTeam. Simon records these sessions three times a week, and every episode lands on the Bitcoin video analysis hub.
Video transcript
Auto-captioned from the video audio and lightly cleaned, so it can contain transcription errors; the video itself is the record. It is speech, not a written article; for the structured breakdown read the sections above.
Not one billion, not two billion, but more than 12 billion [music] dollars worth of cumulative long positions could be liquidated on the way down if Bitcoin [music] crashes towards $74,000. That would mean roughly a 14% [music] drop from current levels and potentially a massive liquidation cascade.
[music] So, is Bitcoin now at risk starting that move or can the bulls defend before it happens? Let's analyze the probabilities. [music] My [music] cryptoiseise. Hello ladies and gentlemen. This is Salmon from Micry Paradise. Welcome back. It's great to be here. Today is Tuesday and that means that you're watching the first video of this week.
So clearly a big imbalance and more people are in long positions, cumulative long positions. They are holding more longs right now. We can however see that there is a big cluster right the only one above us that if you will start pushing towards $90,000 we will create over around $2.8 billion worth of short positions.
So right now we can clearly see that this level this zone is vulnerable for a short squeeze. So in my opinion there is a high conviction and I will explain to you why that from the medium time frame perspective we still have a room to go to the upside after however a little bit of correction.
So from a price action perspective development there is something that confirms this bias we will be talking about it. Let me remind to you first the previous video that where we were talking about Bitcoin on the medium time frame and since couple of previous videos we still expect that we will push towards $90,000 before the larger correction right so in the previous videos we were going through this contracting triangle ABCDE right
and when Bitcoin was at around $84,000 we have seen the probabilities are higher that Bitcoin will start pushing towards that $90,000 then that the bigger move is going to be lower and we will start breaking below the immediate supports that were around $83,000.
So this breakout above this contracting triangle is right now playing nicely right and from the price action perspective we can see that we are creating very clear aliot wave pattern. So in the last video we have understood that we are with the probability at the fourth wave in the and then we will do a fifth wave that will complete the third wave higher and then we will have the higher degree fourth
wave and then the final fifth wave with the highest probability will push us towards that 1.272 Fibonacci retracement level which is sitting exactly at that $90,000. Right? However, we have also understood that if those five waves will not finish right here, there's also the probability that the fourth wave might finish right here.
All right, we will see a consolidation and then the final fifth wave will push us towards the next important resistance that is sitting at $95,000. Right, for that is very important for us to be monitoring the current price action development. So, let's take it from beginning very slowly.
We understand that from the hard degree perspective we are right now inside of this expanded flat right where with the highest probability we were saying that the final fifth wave of this C-wave structure will finish at around $90,000. So the probabilities that we will start getting rejected from here from that 88 to $90,000 is 60% and after a rejection we will push towards $44,000 towards this zone of exchange of the hands.
Lower boundary $44,000 upper boundary $55,000. So that's 60% probability that it's going to happen like this. 30% probability is that we will reclaim this resistance at that 88 to $90,000 and we will continue to push higher towards that $99,000 resistance. Right? So this is 30% probability and then we will get rejected.
All right. So this price action like this is right now 30% probability and 10% probability. That would mean however that this final fifth wave is going to be an extension right we'll be able to spot it soon on the rejection of that resistance.
So if this is going to be a corrective mode wave structure which is three waves or variations of thereof this is just a correction we will be able to get positioned if we will find a great higher riskreward and high probability trade setup with paradis VIPs we will position into a nice long position another one like if we will have enough probabilities we will increase our our our exposure and we will
be riding the wave safely towards $99,000. However, if the correction if the correction will have a pattern of an impulse which is a fivewave structure, right? It can either be an impulse or a leading diagonal. This would mean that we are already changing the trend and that on the correction we will position ourselves into a short position because the higher probability is going to be that the next big move is going
to be in that opposite direction and that means to the downside, right? So it's all about the price action watching the price action. However, the lowest probability that 10% that I have left is for the price action that would look something like this that we would be able to break above that $99,000 resistance reclaim it into a support.
All right, turn it into a support. Then after that we will be able to continue to keep grinding higher above the previous high and continue to grind towards the next major resistance $169,000. This currently based on the data that we were watching in the previous video the explanation in the previous videos is only 10%.
All right. So 60% is that the price action is going to look like this. 30% that the price action is going to look like this and only 10% that the price action will look like this and we will start pushing towards the new alltime high.
Okay, as a provisional traders we need to be prepared for not only all of the seniors but mostly for the black swan events that these are the rare but moments that really determine if you will be long-term profitable or not. Right? So we understand that in the short run the gambler and the professional trader is going through the period of where the luck is involved.
So we lose, we win, we lose, we win, we lose, we win. And then however we understand that in trading we have winning streaks and losing streaks, right? During the losing streaks, the gambler because of the law of probabilities, he loses everything because he's constantly trading without an edge, right?
And during the winning streaks, we understand that the professional traders that have an edge and have a great risk management only enter highest probability trade setups with great risk reward. They are actually making more money than during the losing streaks, right? And that's uh what's the difference between the long term.
The short term is pretty much the similar between the gambler and the professional trader. However, the long-term is the difference. And for being profitable long-term, you need to have a proper system with an edge and keep following it with discipline. Right? So that's extremely important.
Discipline and consistency. Whatever you're building your trading capital, your business, your good habits, your health, eating healthy, consistency is important, right? So if you want to be healthy, it's not enough to eat the eat the vegetables like only once, right? You need to basically set up your diet and constantly keep following it if you do something about your health.
Right? So the same way a professional trader needs to constantly follow his system that has an edge and only in the long run he will see the results if he is able to stick with the system he built for himself. So right now this is from the weekly time frame perspective.
So we are in that expanded flat which is the hard degree fourth wave and then the final fifth wave should take us towards this exchange of the hand zone. If you have not been watching the previous videos definitely watch it where you will understand more insights that we are watching that tells us that with probability still this is the 60% way of how the price action is going to look like before
we can start pushing towards the new alltime high. you know that we are patiently waiting for hitting that $55 to $44,000 zone since $121,000 where we have already understood that we are in a bare market. Right? So at this time I'm still bearish on the weekly time frame.
Let's right now put our focus on this sequence and let's zoom in into what's going on on the daily time frame. So here I can pretty much already turn this into a green color. We have successfully turned this zone $84 to $82,000 into a support.
This was a nice reclaim where we have been breaking above this previously resistance $82,000 with nice volume. All right. So the price action had higher high. The volume had a higher high as well. So as we are breaking above this level, the volume increased which is healthy.
There was a spot volume support in this price action and then on this retest we had a decline in volume. So the bears were much weaker and the bulls were able to defend this level $82,000 and turn it into a support. So right now 82 to $83,000 extremely important support that is being defended by this moving average orange trend line as well.
We can see some bearish divergences that we have created. However, on the top of the possible third wave of that higher degree Cwave, right? And that is why we have got this bearish divergence. We understand the context. It is not bearish divergence upon completion of the final fifth wave.
It is only during the impulse that is still has not finished with the highest priority. Right? So right now on the daily time frame, I am more bullish than bearish. There is still much higher probability that we will start pushing towards the key high time frame resistance zone that is nicely being confluenced with the medium time frame resistance zone at around that 90 to $95,000 ladies and gentlemen.
Right. So on the high time frame we can see the lower boundary of our resistance zone is being at around that $95,000. But we can see on the medium time frame we are already getting a lot of Fibonacci retracement level confluences and previous price action that we were going historic price action levels that we are going into in the previous videos at around $90,000 already.
So naturally we can assume uh because also we have 1.618 Fibonacci retracement level on the medium time frame 90 to $95,000 will be extremely important resistance zone from multiple time frame perspective. So right now ladies and gentlemen on the daily time frame I would not enter into a short position until I can see that on the move to the downside we can create a fivewave structure.
If we will then I will understand that the bears are able to control the price action and upon that I would be waiting for a correction of this move and if it would be a three-wave structural variations thereof I would see that the bulls are having a very hard time to take back the control and also if I would see a confluences for example on this move to the upside decline in
volume now the bearish divergence creation or multip multiple momentum indicators that we are watching. This would be a clear entry for me into a short position. And if you are in Paradise MVIP and I decide to pull the trigger or somebody from the Paradise team, you will know about it because we are sharing with you our personal trade setups with clear entry and exit targets exclusively in only Paradise Family VIP.
So right now, let's zoom in into what's happening on the 4hour time frame. So that gets us to calculation of the subwaves on the medium time frame. So we need to understand that from the hard degree perspective we are right now creating the C-wave.
The C-wave of an expanded flat is a multi-wave structure. That means it s out itself into five more waves. So far we have created one two three four and right now we are creating the fifth wave. If the fifth wave is going to be an extended we will push towards $99,000 with the probability.
However, at this moment, the higher probability is that we will not have an extension and that means that we will finish around at 90,000. Again, as we have already established, getting rejected from 88 to 90,000, 60% probability from the weekly time frame perspective, 30% probability that we will continue to push towards $99,000 and then get a rejected.
and only 10% probability that we will reclaim that $99,000 and continue to push higher towards the new all-time high. Okay, so right now this doesn't seem like the fifth wave will be an extended one. However, if it's going to be we will be able to spot it early once we will see the move to the downside.
If it's going to be a corrective mode wave pattern, there is going to be very high probability that the next big move is going to be to the upside and then we will be playing with bullish trading tactics, right? But right now, let's take a look what's happening on the medium time frame because it will help us to understand how is the fifth wave actually behaving.
All right, so $75,000 that's where we have finished the fourth wave, right? So here we have finished the fourth wave at our 75,000 D support and right now we are creating the fifth wave. What we know about the fifth wave is that the fifth wave is a motive wave structure right motive wave structure.
So we can see it right here. The fifth wave of an impulse and basically of any motive mode wave is other than the ending diagonal is a motive wave structure that means it subd itself into five small waves right five small waves fifth wave cannot be an leading diagonal so it's either an impulse or an ending diagonal given however that we have already established that the third wave right the third wave
was an impulse, right? This should be an impulse. What we also know is that the fif because the ending diagonal has all of the subwaves corrective mode wave patterns, right? So, we are in an impulse with the highest probability. What we know about an impulse is that the fifth wave can go beyond the end of the third wave, but can be also truncated, right?
That means that the final fifth day doesn't need to go above the previous high of the third wave that finished at $87,400. Low probability at this moment, but we need to understand that it's also a possibility. That's why we need to monitor the price action live.
So take a look at this. Did we completed the five wave structure already? We have not. Right? So, so far we have created one, two right here. Then extended third wave. All right? extended third wave which is also increasing the probability that the fifth wave won't be an extended one.
Okay. Then we have created the fourth wave that was the contracting triangle from which we have expected the breakout towards that $90,000 in the previous video and that is why in the last couple of videos I have been telling you medium time frame playing with bullish trading tactics.
I'm focusing on bullish trading setups. If I get it I will pull the trigger on the bullish side. I will not be playing with bears until I see some invalidations of that bullish structure. Right? So we are right now breaking above this contracting triangle and we are in the final fifth wave.
What we know about the fifth wave again it's a motive wave structure separate itself into five small waves. Right? So so far let's see what we have created. So we know that the fourth wave finished right here with the contracting E-wave right contracting triangle E-wave.
So contracting triangle subdivides itself into five small waves A B CDE E that finished right here. Then we have started already the fifth wave. So the fifth wave we have created one two and right now we are creating the third wave that is subdivide itself into five small waves as well because it's a multi- wave structure.
So we have created one two three and right now I don't think this was the fourth wave. All right this one right here of that hard degree third wave. So I do believe that we are in a creation of the fourth wave which usually has a structure of a triangle right contracting or expanding.
This will not be a skewed anymore because this high would need to go above the third wave high. So with the highest probability this will be a contracting triangle. So so far we have created one two and right now we might be in a third wave.
Then we will have a fourth fourth fifth one two three four fifth and then we will be breaking to the upside and we will complete the fifth wave of that high degree third wave then with the highest probability we will start creating the final fourth wave if it's going to happen right below that $90,000 that fourth wave the final fifth wave will with the highest probability will be finished right here at
the next important resistance $95,000. All right. So that is why on the medium time frame I'm kind of bearish. I don't think there is enough power right now because of the stuff we are watching on the whales page on our website micro days with the stuff that we are watching with our live crypto and greed index because I don't see that the retailer is extremely greedy right now and we know in
the final fifth waves we usually see extreme greed right that's what the whales then use as an exit liquidity to turn the market down so I don't see extreme greed right now the readings is greedy on the lower time frame but not an extreme greed and not only on the daily time frame as well funding crates we have some long squeeze probability so longs are being more crowded but on the funding
history I don't see that we are entering plus 10 neither plus 20 right plus 10 was always the level from where we have then seen a big reversal so all of this all of this stuff right plus the other stuff but I don't have time for that I don't want take too much time of yours for that.
All of the stuff is telling us there is much lower probability right now that from the current level $86,000 we would have enough power to keep pushing all the way down towards that $74,000 and liquidate over that $12 billion of that cumulative long positions.
Therefore, right now, the probability that we from the current price, we would be able to continue all the way down towards $74,000 and liquidate that cumulative long positions that that are right now over $12 billion, right? If we start pushing towards that $74,000, this is right now very low probability.
All right. What is kind of high probability because we are in the fourth corrective mode wave structure is that we might be pushing and continuing in that ABC zigzag another corrective wave of that fourth wave towards $84,000. That is a high probability from the medium time frame perspective.
The important support is at $84,000. Given that I don't think that we have completed the fourth wave structure yet, there's a high probability we might push towards $84,000. Does it mean that I'm entering on the medium time frame short position right now? With the highest probability, I won't create any short position.
Not only it's not a high probability thing to do to go against the trend, and the trend on the medium time frame right now is still bullish, but also the risk reward wouldn't be very nice for me. I would need to place my stop loss around like $87,500 and the target would be only $84,200, which is not a great risk reward for me.
So I'm still playing with bullish trading tactics on the 4 time frame. There is also a possibility that this is some kind of a pattern I have failed to recognize and we might be already able to push towards $89,000 with the highest probability will be the third wave right finished.
But at this time, at this time, this is still much higher probability than that we would be able to start pushing to $74,000 from here. Henceforth, I'm focusing on bullish trading tactics, not on bearish trading tactics. Given that on the momentum indicators, I also have a lack of some bearish divergences.
So, there is no reason to be to be bearish or to work with bearish trading tactics on the four time frame. Okay? But there is a probability that we might push towards $84,000 right before we can start grinding higher towards the next important resistance.
So from the 4hour time frame the next important resistance is that $90,000. If we take a look at this important sequence as I've already established around $88,000 might be the high of the third wave right third wave on the four time frame. But if the third wave will go all the way up towards $90,000 which is also confluencing with the 1.61 if you want to trace mental as you can see tight
zone between $89 $9,800 and $90,400. If we will stop the third wave right here, right, and start consolating and creating the fourth wave right here below this important resistance of that $90,000, then very high probability then that the whole impulse will finish at that $95,000 before we can start seeing a reversal towards the downside.
Right? And if that's going to be the case and the fourth wave will be very aggressive and then the first wave of the fifth wave will be with an extreme volume then it's also quite high probability that we can wick above that medium time frame $95,000 towards touching that 1.61 Fibonacci retracement level on the weekly time frame the resistance of $99,000 and then starting to reject it.
Right? So ladies and gentlemen, nothing bearish for me other than on the weekly. You know that on the weekly with paradis only VIPs, we are still bearish. We have been distributing our Bitcoin back at $19,000 and below $121,000. We are still waiting for aggressive reaccumulation.
So on the weekly, I am still bearish. I'm still waiting for lower prices before we start reaccumulating. On the daily time frame, however, I don't have a conviction or some high probability trade setups for short positions. So I'm focusing on bullish trading tactics on the daily time frame and likewise also on the 4hour time frame.
So ladies and gentlemen, I will keep you updated and next video will be on Thursday. Until then, take care, trade safe and focus on your protests, not on the outcome. Cheers. Calm breath, clear eyes now. No rush, no drag. [music] Right time, full snap.
Clean set up. Clean click. Execute like [singing] a pro. That's it. [music]
Educational content, not financial advice. Crypto trading carries substantial risk; you can lose your capital. Past performance does not guarantee future results.










Join the discussion
No comments yet. Members, share how you are reading this.