


Listen: the breakdown
Market briefing: Bernstein sees Bitcoin near $150,000 by mid-2027 and $300,000 by 2029 on a debt and debasement thesis. Yet BTC sits near $78,671, still capped under $79,000, where the real fight lives.
- Bernstein projects Bitcoin near $150,000 by mid-2027, then $300,000 by 2029.
- The case leans on rising government debt, currency debasement, institutions and long-term holders.
- BTC trades near $78,671, still stuck below the $79,000 zone where selling keeps winning.
The Bernstein Bitcoin forecast paints a road to $300,000 by 2029, yet BTC still cannot clear $79,000 today. So who is really meant to buy this story?
Bernstein just laid out a long road for Bitcoin. The firm expects a fresh record near $150,000 by mid-2027. Then it sees $300,000 by 2029. The thesis rests on rising government debt and currency debasement. Scarce assets, the argument goes, win when money loses its value.
It is a clean story. It is also a very distant one.
The reasoning is not new. Institutions keep adding Bitcoin. Long-term holders keep sitting still. Both trends are real, and both genuinely support the multi-year case. We do not dispute the direction over that horizon. A target for 2029 is easy to publish and hard to be wrong about before then.
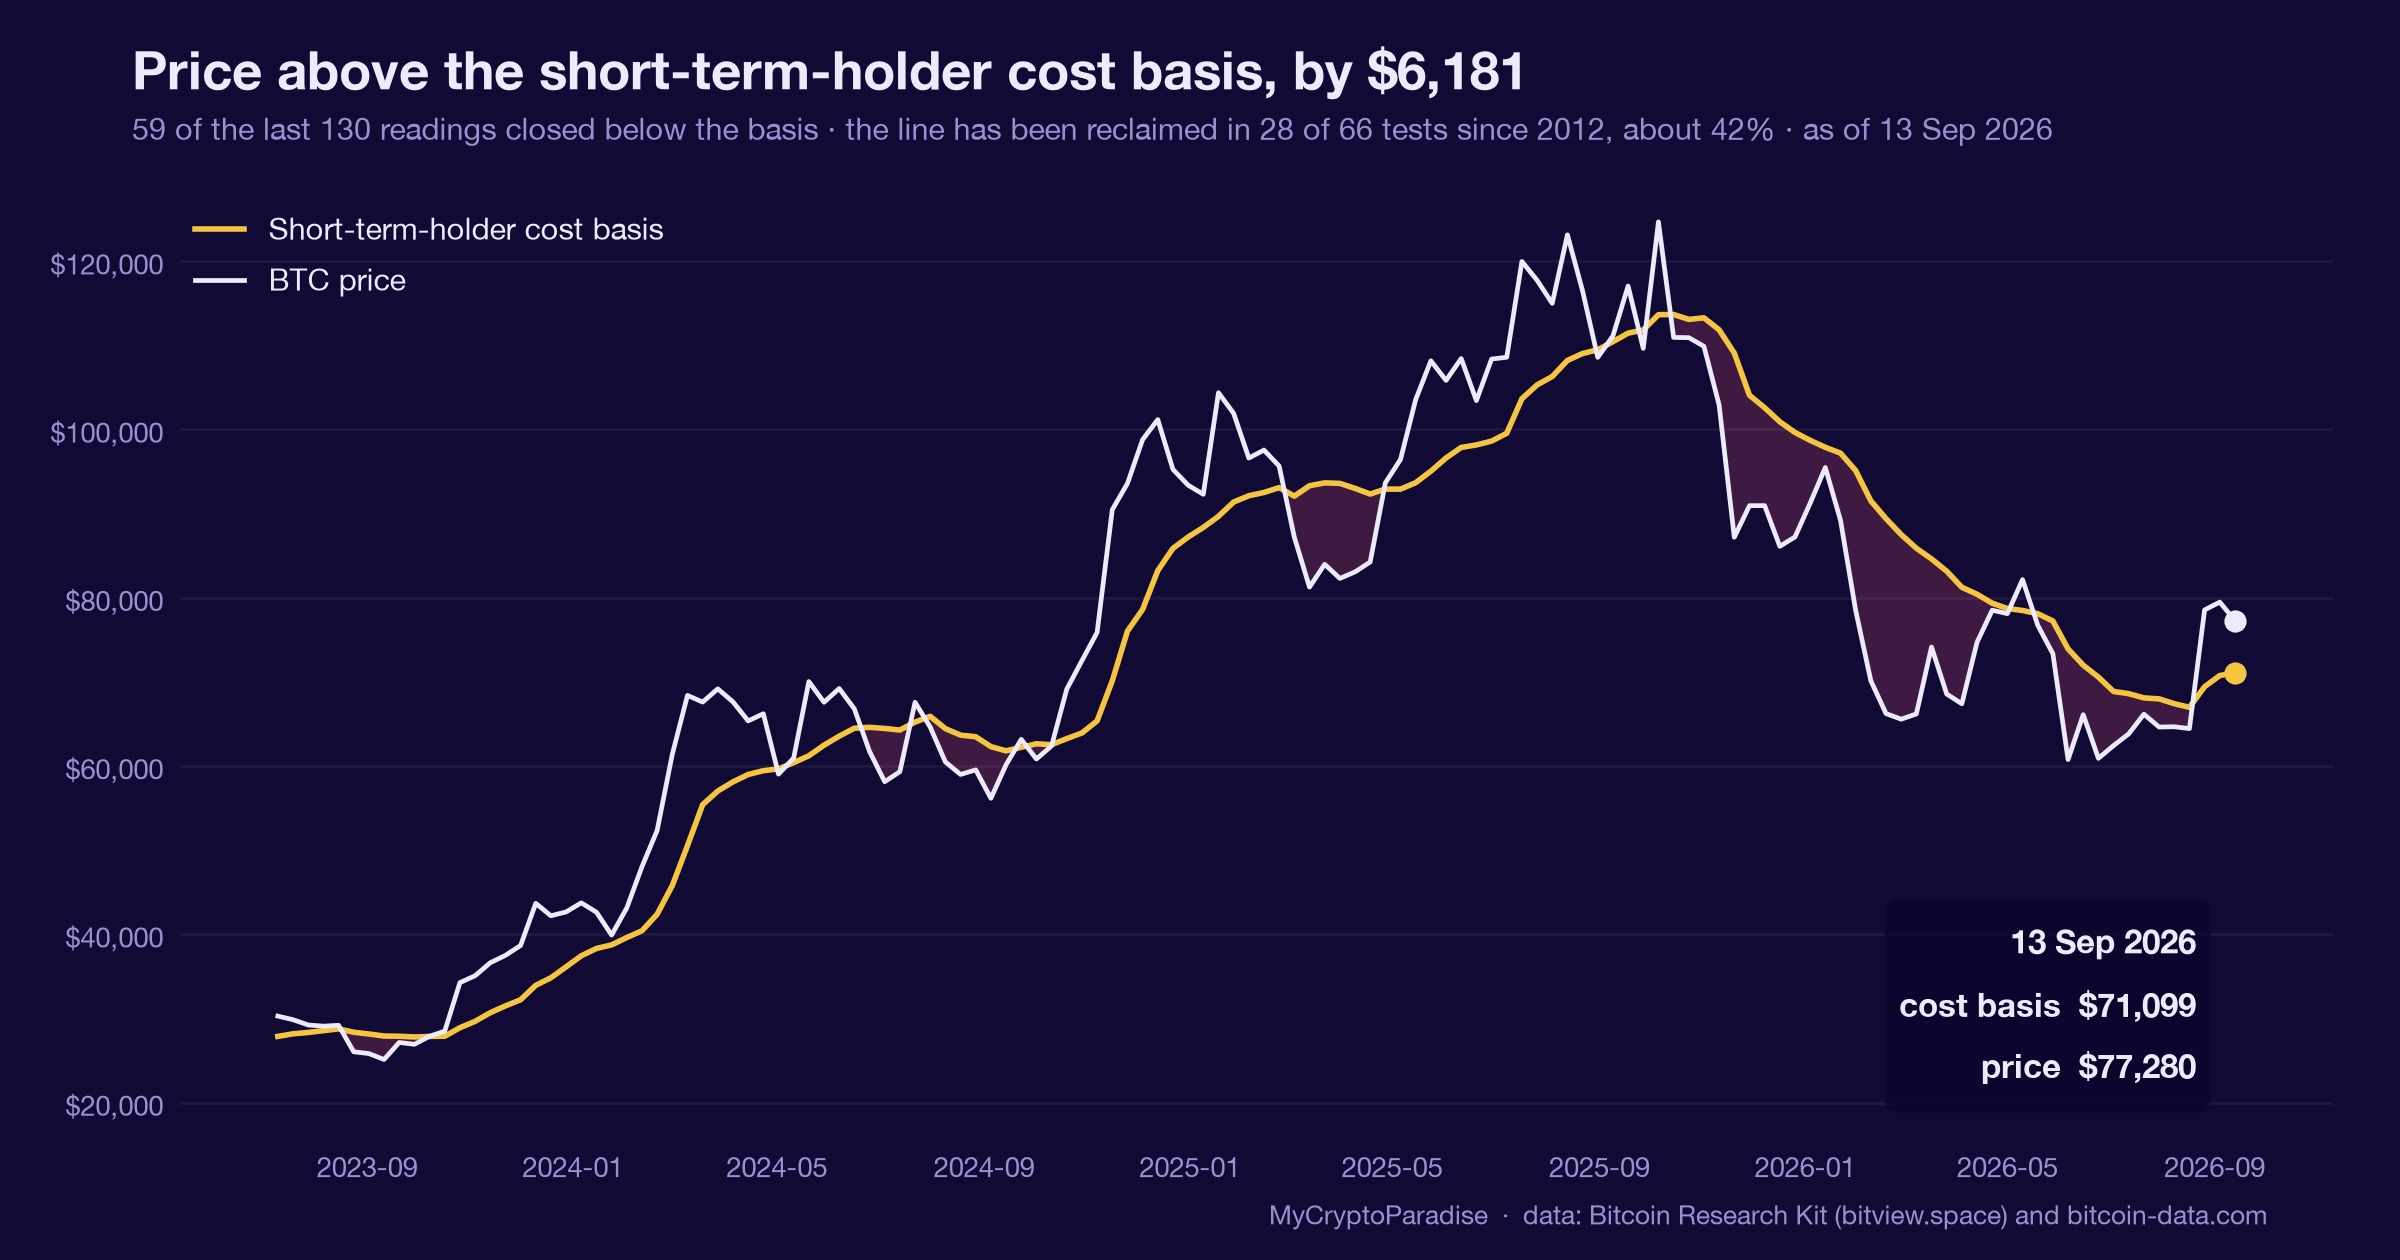
The timing is where it gets awkward. Bitcoin was trading near $78,671 as of the latest read, down about 0.8% on the day. That price sits just under $79,000, the level that has capped every recent push. A forecast about 2029 does nothing for a chart that keeps failing at resistance now.
So the real question is who benefits from the headline. Bold long-term numbers tend to arrive exactly when late buyers want a reason to chase. Currency debasement is a decade-long theme. Liquidation happens in an afternoon. That gap between the glossy target and today's tape is the whole story, and it is worth sitting with before you act on it.
Debasement thesis meets a $79,000 wall
The macro logic behind the call is sound on its own terms. When governments run heavy deficits, the pile of debt grows faster than the economy. Investors then hunt for assets that cannot be printed. Bitcoin, with its fixed supply, fits that search cleanly. This is the flight-to-scarcity trade, and over years it has real weight.
But a macro thesis and a market entry are different things. Debasement is slow. It plays out across budgets, elections and central bank cycles. Price, by contrast, moves on positioning and liquidity right now.
That is the disconnect. The narrative tells you to own Bitcoin for 2029. The chart tells you Bitcoin cannot hold above $79,000 in 2026. Both can be true at once. A believer in the long thesis can still get liquidated on the way there.
Here is why the transmission stalls. A distant target does not add fresh buying power today. It adds conviction, and conviction at high leverage is fuel, not support. When late entries pile in above resistance, they hand exit liquidity to anyone already positioned. The debasement story becomes the reason retail holds through a drawdown it should have avoided. So the same headline that looks bullish for the decade can weaken the tape for the quarter, because it invites buyers precisely where sellers want them.
Distant targets pull liquidity from spot
Bitcoin still leads, so it decides the tone for everything below it. Right now that lead is fragile. BTC hovers near $78,671, unable to convert $79,000 into a floor. Until that changes, every risk asset downstream inherits the same ceiling.
Watch how a forecast like this feeds the order book. It pulls new money toward long positions, often with leverage. Open interest, or OI, the total value of live futures contracts, tends to climb into these narratives. Rising OI on a stalling price is a warning, not a green light. It means more traders are trapped if price slips.
If BTC cannot break higher, the flush runs top down. Bitcoin cracks first and drags the majors. Ethereum follows with a sharper move, because ETH carries more leverage on the way down. Then altcoins gap lower, since they hold the thinnest liquidity and the widest spreads.
That cascade is not a prediction of doom. It is simply how forced selling travels through a market built on borrowed money. A single sweep below support can clear thousands of longs in minutes.
The cleaner path would be different. Real strength shows up as BTC reclaiming $79,000 and holding it on strong spot volume, not as another headline promising $300,000 while the current candle bleeds.
Capitulation signals versus a genuine breakout
The next move gets confirmed or denied at a few clear places. Focus on those, not on the 2029 number.
First, the $79,000 line. Bitcoin has to close firmly above it and defend it on a retest. One reclaim on strong volume would put the bearish read on notice. Repeated rejection there keeps the pressure to the downside intact.
Second, watch the momentum tape. A daily candle that spikes and closes weak, a shooting star, would signal buyers running out of fuel at resistance. Bearish crosses on the four-hour momentum tools point the same way. When price prints a higher high but volume prints a lower high, participation is thinning, and thin rallies break.
Third, the downside levels. A clean loss of $61,000 opens the door toward $58,000, below the prior low. Below that sits the $55,000 to $44,000 band we treat as the real reaccumulation zone.
Invalidation for the cautious view is specific. A push through $89,000 would squeeze shorts and force a rethink. That single trigger, not a research target, is what flips the near-term structure.
So the checklist is simple. Reclaim $79,000 and hold, or fail and drift toward capitulation. Everything else is noise dressed up as insight. Let the levels, not the narrative, tell you which one is happening.
Why the $79,000 zone still caps this
The ParadiseTeam reads this forecast as a sentiment tool, not a fresh catalyst. Nothing about a 2029 target changes what the current chart is doing near $78,671. The lens stays bearish on the daily and weekly while price sits under the $79,000 to $79,500 band.
That band matters because it is where the heavy selling has been landing. Supply keeps hitting the market there without absorption. A headline promising $300,000 is exactly the kind of story that pulls late buyers into that zone with leverage. Smart money does not need to chase; it can sell into the enthusiasm the forecast creates.
Here is the structure we care about. The medium timeframe still points lower, toward $58,000 first and the $55,000 to $44,000 reaccumulation band after. That range, not this year's target, is where we think a durable base gets built. A high-probability magnet sits near $44,000.
Manage risk-to-reward, or R:R, the size of the reward against the amount risked, from the levels, not the narrative. As long as $79,000 caps price, the balance favors patience over chasing.
The read flips if BTC reclaims $79,000 and holds, and it breaks outright above $89,000. Until one of those prints, the $300,000 story stays a reason for the crowd to hold, not a reason for us to buy.
The read behind this: we framed this story through our own market analysis, Bitcoin Bull Market Back? $15B Says Be Careful.
Track it live: our live crypto funding rates and the crypto liquidation heatmap both update in real time, so you can watch this shift for yourself.
Related coverage
For exact entries, targets, and stop losses with full risk management, that is what ParadiseFamilyVIP is for. New to reading these moves? Start with our crypto trading strategies guide.
ParadiseTeam is monitoring the market situation closely, and we are taking these developments into consideration while building our trading tactics inside ParadiseFamilyVIP.
Crypto trading involves substantial risk. Prices are volatile and you can lose money. This article is educational and is not financial advice. Past performance does not guarantee future results.












Join the discussion
No comments yet. Members, share how you are reading this.